An ideal gas is taken from the state A (pressure P, volume V) to the state B (pressure p/2, volume 2V) along a straight line path in the P-V diagram. Select the correct statement (s) from the following :
The work done by the gas in process A to B exceeds the work that would be done by it if F62the system were taken from A to B along the isotherm.
In the T-V diagram, the path AB becomes a part of a parabola.
In the P-T diagram, the path AB becomes a part of a hyperbola.
In going from A to B, the temperature T of the gas first increases to a maximum value and then decreases.
The correct Answer is:A, B, D
Work done by the gas in the process A to B exceeds the work that would be done by it if the system were taken from A to B along the isotherm. This is because the work done is the area under the P−V inicator diagram will be more than that in the second diagram. When we extrapolate the graph shown in fig let P0 be theh intercept on the P-axis and V0 be the intercept on the V-axis. The equation of the line AB can be written as
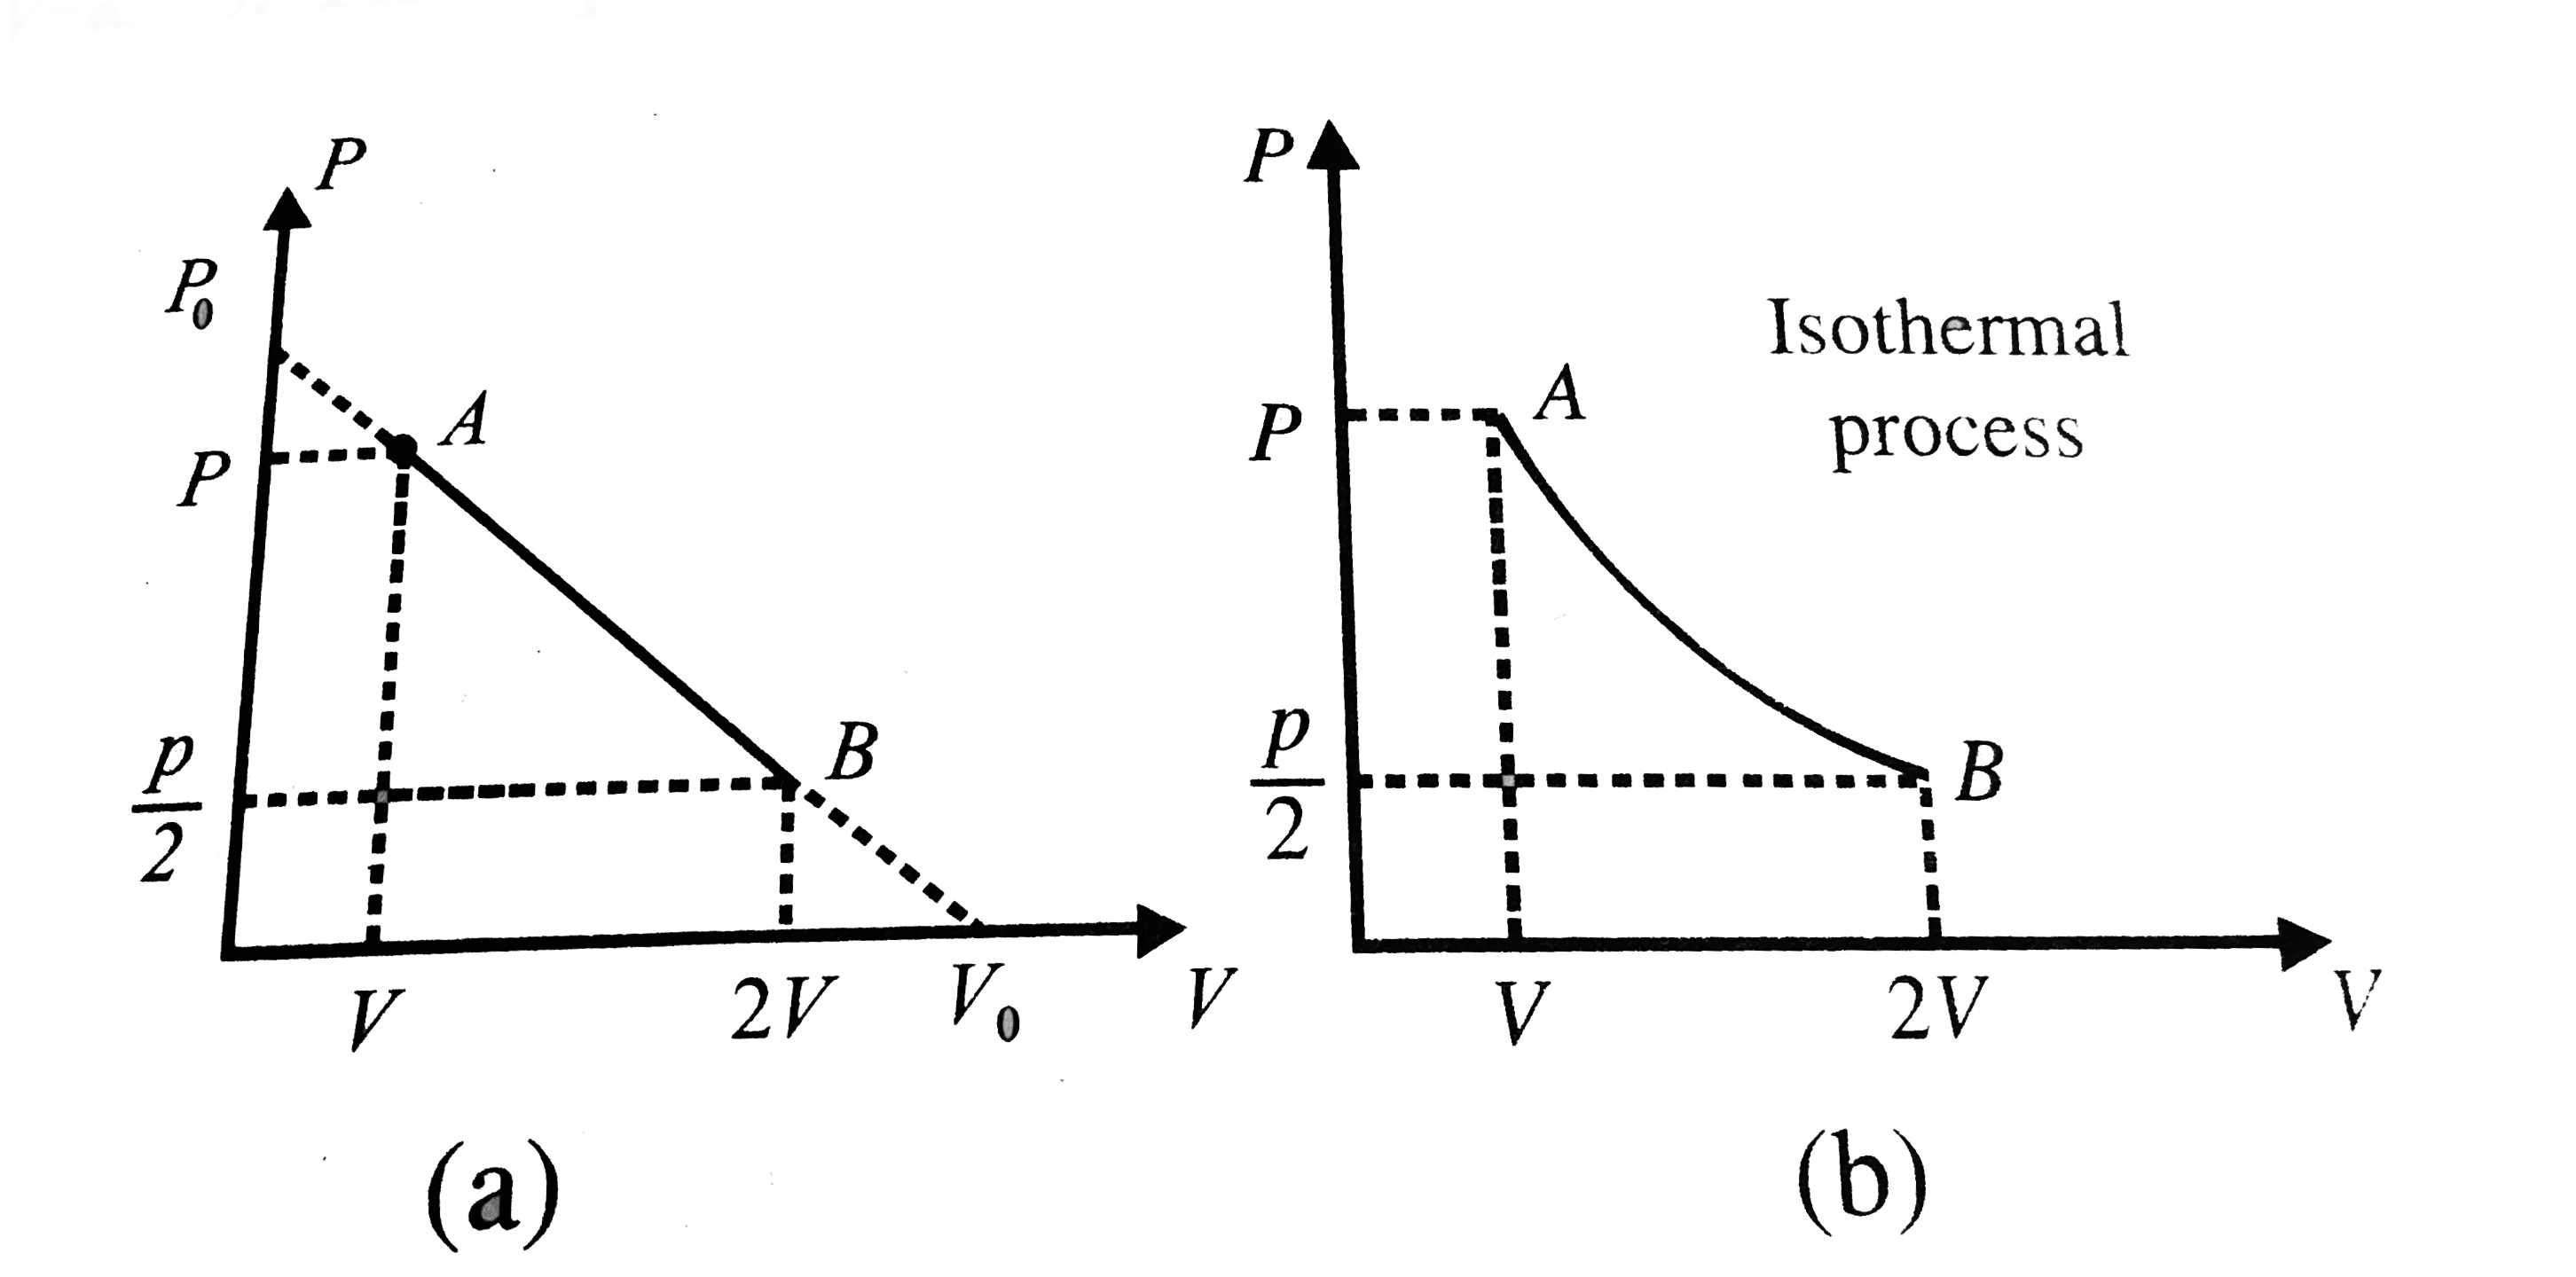
P=−P0V0V+P0 , [∴y=mx+c] (i)
To find a relationship between P and T , we use
PV=RT⇒V=RTP (ii)
From Eqs. (i) and (ii),
p=−P0V0×RTP+P0
⇒P2V0−PP0V0=−P0RT (iii)
Relation between P and T is the equation of a parabola.
Also PV=RT
∴P=RTV (iii)
From Eqs. (i) and (ii),
RTV=−P0V0V+P0
⇒Rt=−p0v0v2+p0V (iv)
The above equation is of a parabola (between T and V)
T=−P0V0RV2+P0RV
Differentiating the above equation w.r.t. V we get
dTdV=−P0V0R×2V+P0R
when dTdV=0 ,
then P0V0R×2V=P0R ⇒V=V02
Also d2Td2V=−2P0V0R=−ve
⇒V=V0/2 is the value of maximum of temperature
Also PAVA=PBVB⇒TA=TB (From Boyle's law)
⇒ In going from A and B , the temperature of the gas first inceases to a maximum (at V=V0/(2) and the decreases and reaches back to the same value.
Topper's Solved these Questions
- ARCHIVES 1 VOLUME 6BOOK - CENGAGE PHYSICSCHAPTER - ARCHIVES 1 VOLUME 6EXERCISE - Assertion-Reasoning
1 Videos
- ARCHIVES 1 VOLUME 6BOOK - CENGAGE PHYSICSCHAPTER - ARCHIVES 1 VOLUME 6EXERCISE - Comprehension
3 Videos
- ARCHIVES 1 VOLUME 6BOOK - CENGAGE PHYSICSCHAPTER - ARCHIVES 1 VOLUME 6EXERCISE - Single Correct
54 Videos
- ARCHIVES 2 VOLUME 6BOOK - CENGAGE PHYSICSCHAPTER - ARCHIVES 2 VOLUME 6EXERCISE - Integer
4 Videos
Similar Questions
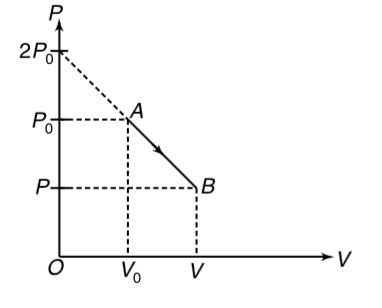
One mole of an ideal gas is expanded from the state A(P0,V0) to final state B having volume V. The process follows a path represented by a straight line on the P–V diagram (see figure). Up to what volume (V) the gas shall be expanded so that final temperature is half the maximum temperature during the process.
View SolutionAn ideal gas has pressure P, volume V and temperature T. Select the correct option.
View Solution
Knowledge Check
An ideal gas is taken from the state A (pressure P, volume V) to the state B (pressure P/2, volume 2V) along a straight line path in the P-V diagram. Select the wrong statement from the following:
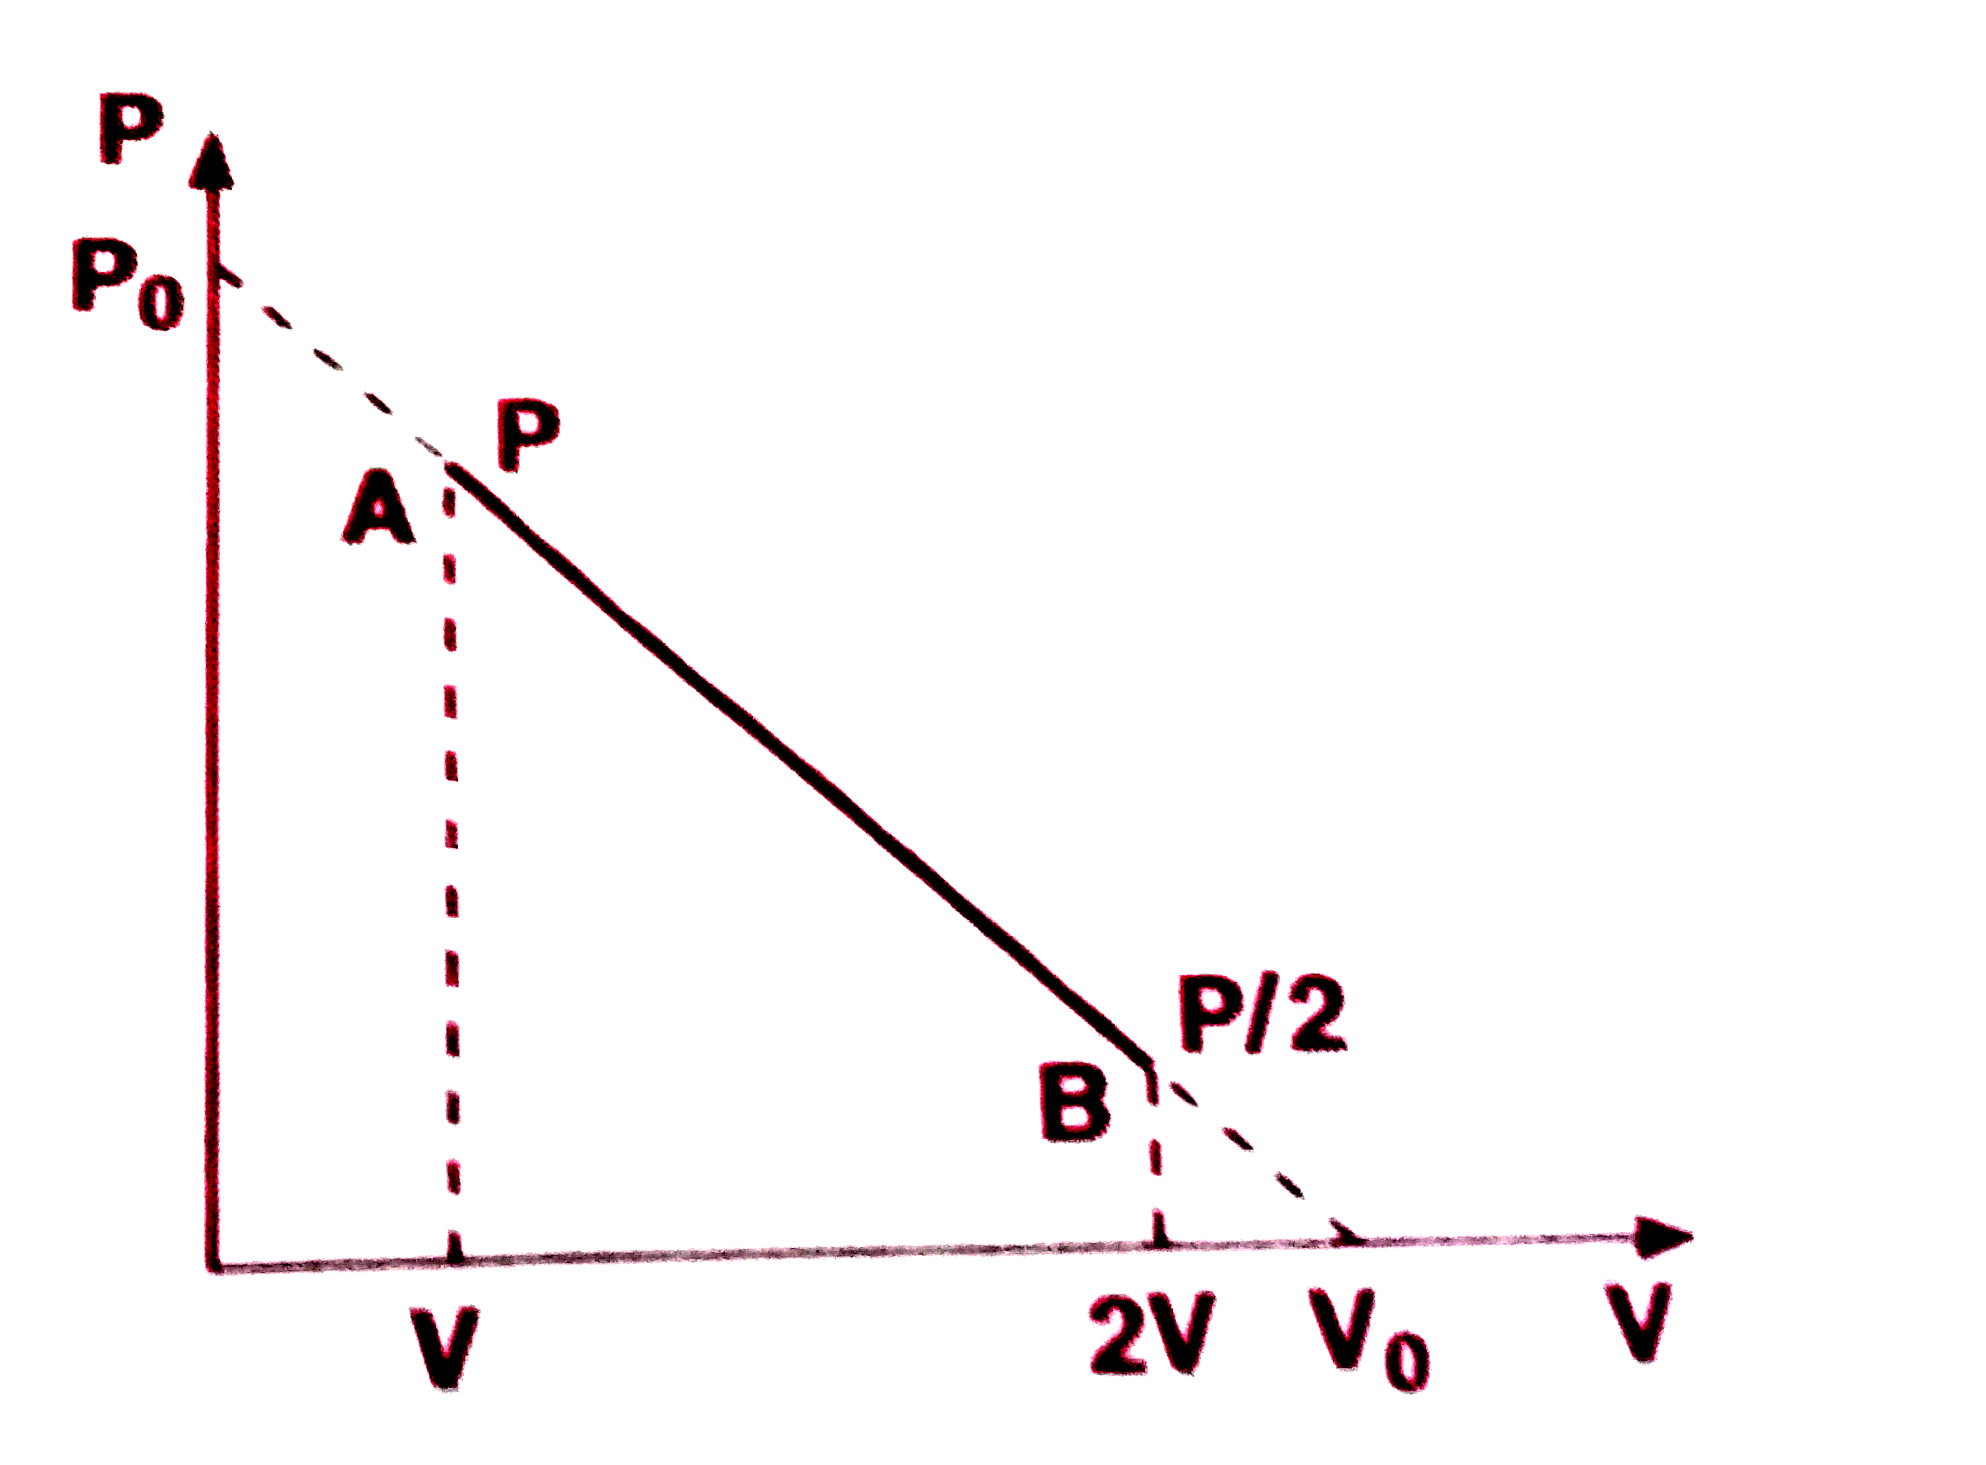 AThe work done by the gas in the process A to B exceeds the work that would be done by if the system were taken from A to B along the isotherm.BIn the T-V diagram, the path AB becomes a part of parabola.CIn the P-T diagram, the path AB becomes a part of hyperbola.DIn going from A to B, the temperature T of the gas first increases to a maximum value and then decreases.
An ideal gass is taken from state A (Pressuer P, VolumeV) to the state B
( Pressure P/2, Volume 2V) along a stright line path in PV diagram as
shown in the adjacent figure .
Select the correct statement (s) among the following .AThe work done by gas in the process A to B exceeds the work that
would be done by gas in if the system were taken from A to B along the isotherm.BIn The T- V diagram, the path AB become part of parabola.CIn the P-T diagram, the path AB becomes a part of hyperbola.DIn going from A toB, the temperature T of the gas first increase to a maximum value then decreases.An ideal gas is taken form the state A(P,V) to the state B(P2,2V) along a straight line path in the P−V diagram.
Select the correct options
(i) The work done by the gas in the process A to B exceeds the work that would be done by it if the system were taken from A to B along the isotherm
(ii) In the T−V diagram, the path AB becomes part of a hyperbola
(iii) In the P−T diagram, the path AB becomes part of a hyperbola
(iv) In going from A to B, the temperature T of the first increases to maximum value and then decreasesA(i),(iii)B(ii),(iii)C(iii),(iv)D(i),(ii),(iv)
An ideal gas taken from state A(P,V) to the state B(P/2,2V) along a straight path in PV diagram. Select the correct option(s).
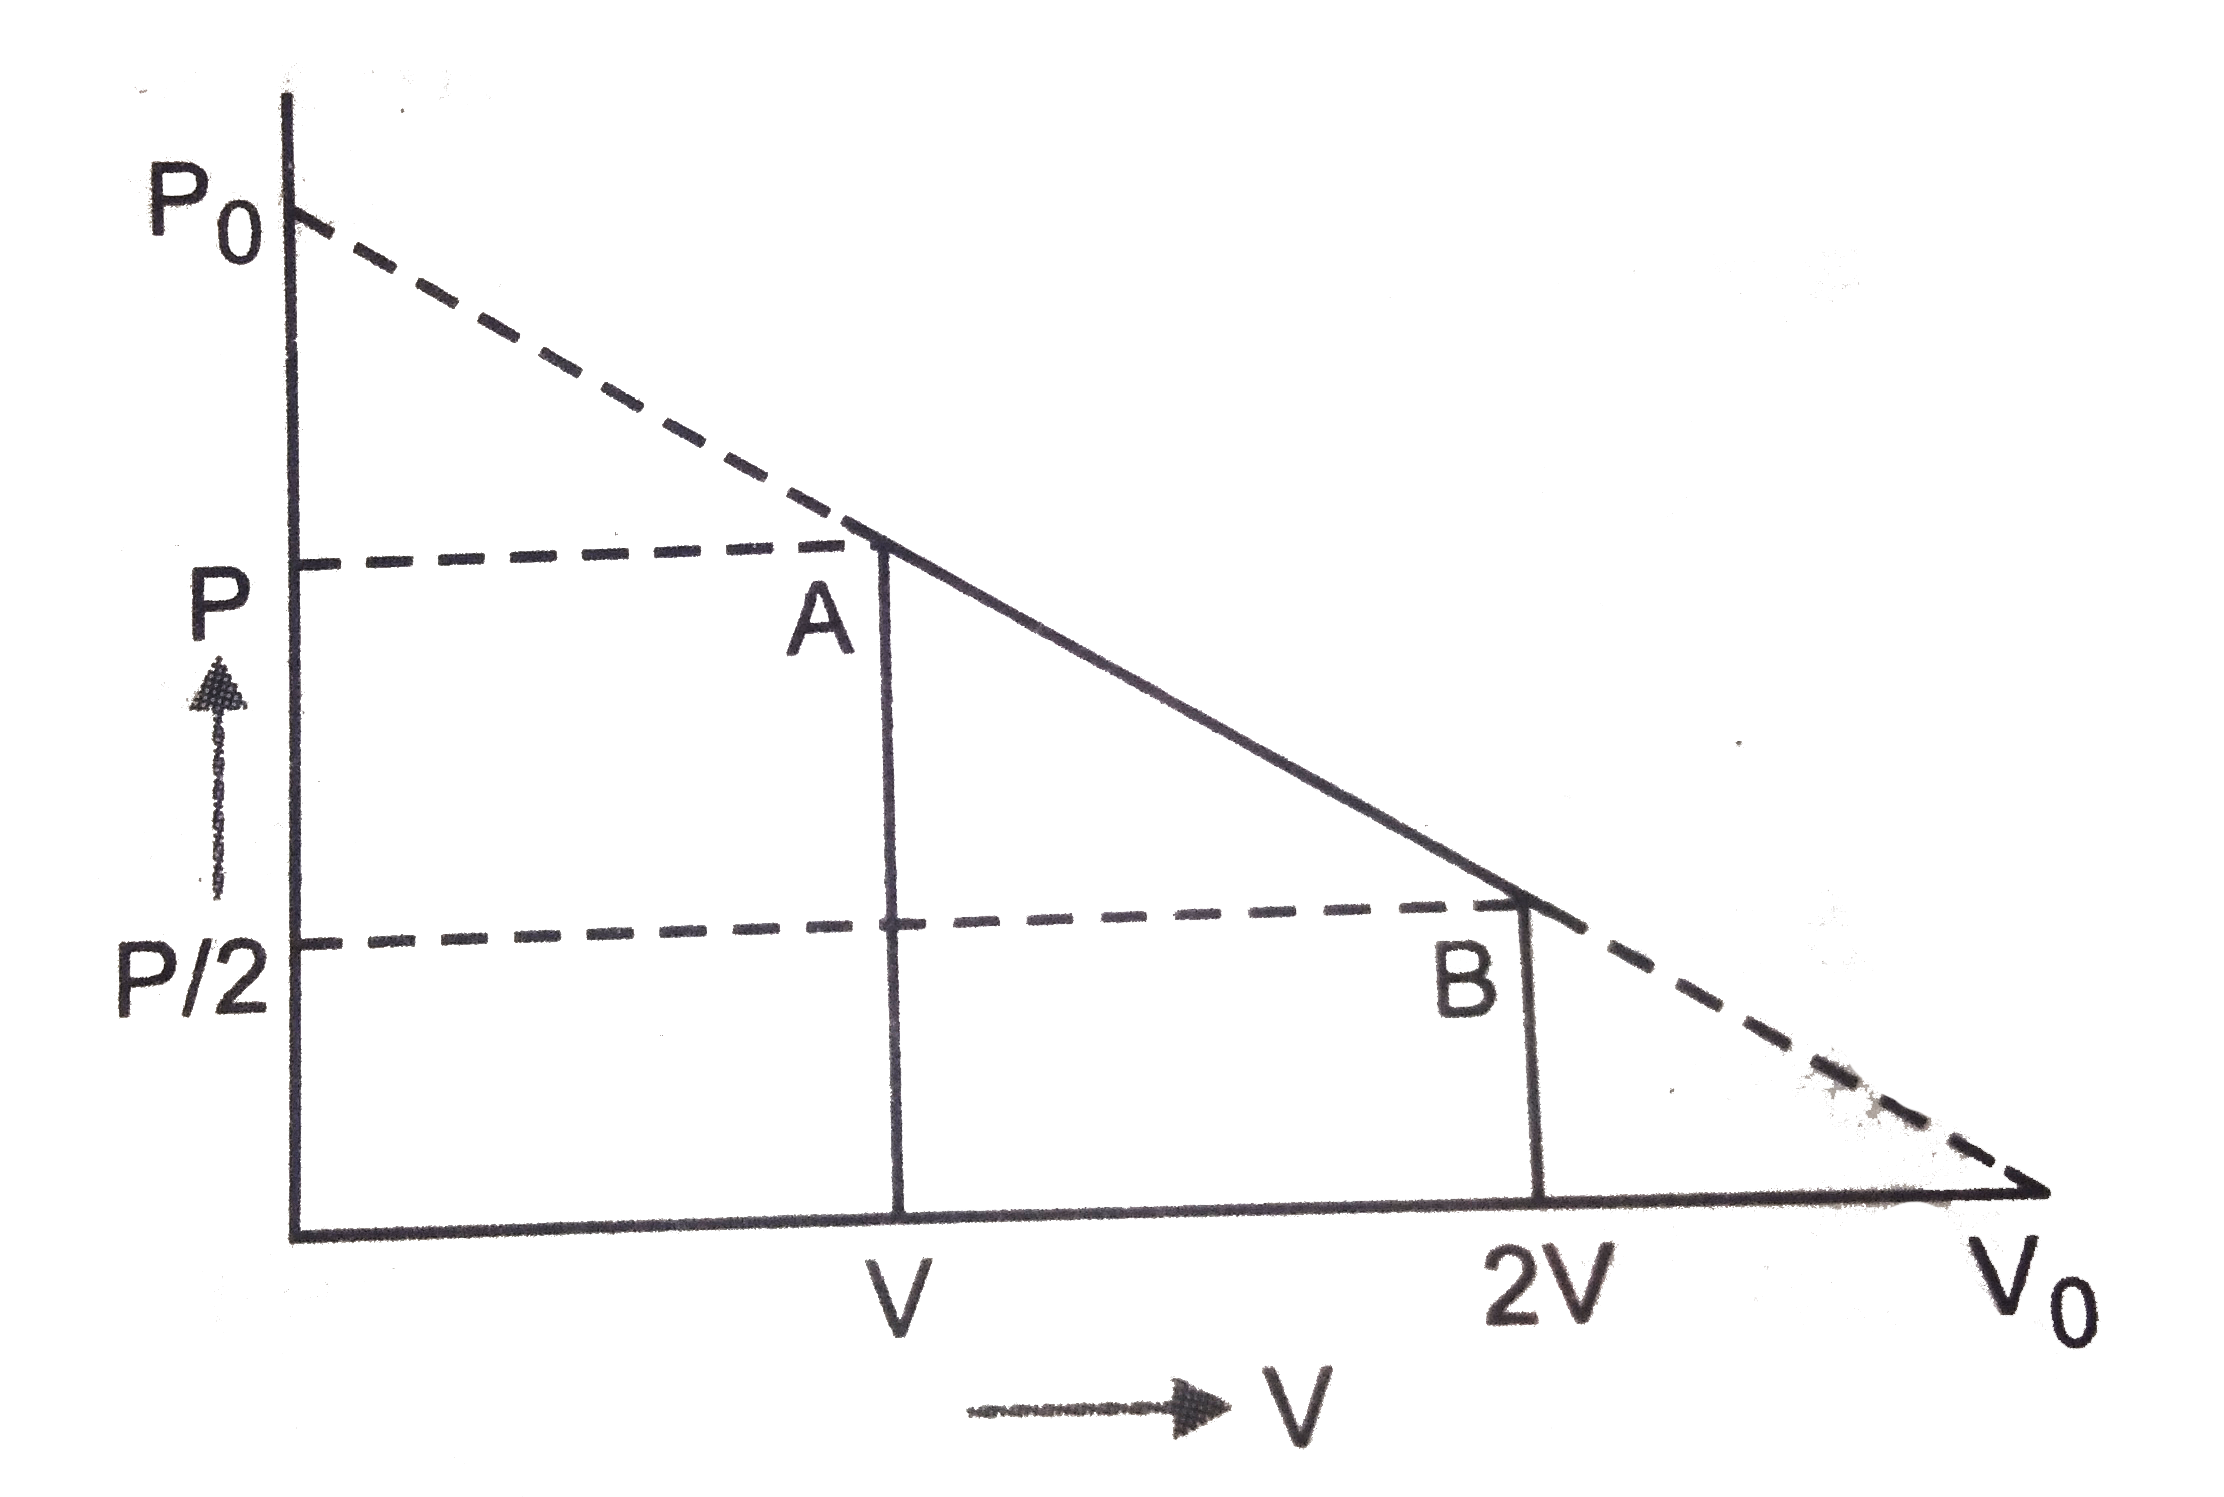
View SolutionAn ideal gas is taken from the state A (P, V) to the state B (P/2,2V) along a st. line path as shown in Fig. Select the correct statement from the following:
View Solution2 moles of ideal monatomic gas is carried from a state (P0,V0) to a state (2P0,2V0) along a straight line path in a P- V diagram. The amount of heat absorbed by
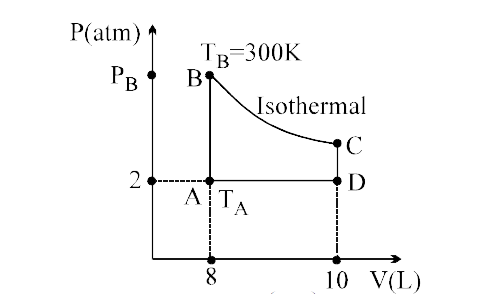
View SolutionAn ideal gas behaving 2moles ( fixed) is subjected to the changes as shown is ( P-V) diagram.Select the correct option ( s) from the following diagram.
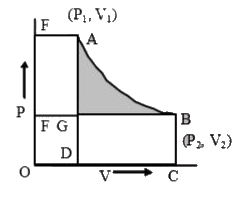
View SolutionAn ideal gas is transformed from state A(P1,V1) to the state B(P2,V2) through path AB. In this process the work done by the gas is
View Solution
