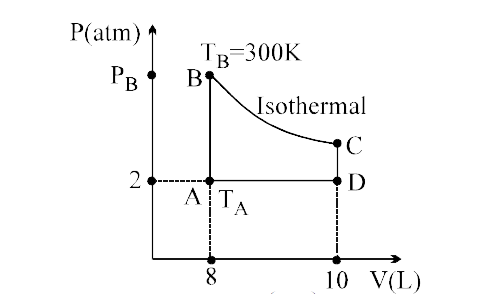
An ideal gas behaving 2moles ( fixed) is subjected to the changes as shown is ( P-V) diagram.Select the correct option ( s) from the following diagram.

Temperature "A" , Pressure at "C" ( 60 R )
Temperature at "D" , Pressure at "B" ( 75R )
Temperature at "A" , Pressure at "B " ( 75R )
Temperature at "D" , Pressure at "C" ( 60R )
The correct Answer is:B,C
Topper's Solved these Questions
- GASEOUS STATE BOOK - MOTIONCHAPTER - GASEOUS STATE EXERCISE - EXERCISE-3
55 Videos
- GASEOUS STATE BOOK - MOTIONCHAPTER - GASEOUS STATE EXERCISE - EXERCISE-4( LEVEL-I)
15 Videos
- GASEOUS STATE BOOK - MOTIONCHAPTER - GASEOUS STATE EXERCISE - EXERCISE-2(LEVEL-I)
48 Videos
- ELECTROCHEMISTRYBOOK - MOTIONCHAPTER - ELECTROCHEMISTRYEXERCISE - EXERCISE-4,II
44 Videos
- GOCBOOK - MOTIONCHAPTER - GOCEXERCISE - Exercise - 4 Level - II
14 Videos
Similar Questions
Knowledge Check
Select the correct option(s) for an ideal gas.
AMost probable speed increases with increase in temperatureBFraction of particles moving with most probable speed increases with increase in temperatureCFraction of particles moving with most probable speed are more for Cl2 than H2 under similar conditions of T,P andVDMost probable speed is more for Cl2 than H2 at same temperature.An ideal gas taken from state A(P,V) to the state B(P/2,2V) along a straight path in PV diagram. Select the correct option(s).
AIn PT diagram path AB becomes a part of hyperbola.BWork done by the gas In the process A to B is more than the work done if the system were taken from A to B along an isotherm.CIn TV diagram,t he path AB becomes a part of parabola.Din going from A to B the temperature T of the gas first increases to a maximum value and then decreases.An ideal gas is taken from the state A (pressure P, volume V) to the state B (pressure p/2, volume 2V) along a straight line path in the P-V diagram. Select the correct statement (s) from the following :
AThe work done by the gas in the process A to B exceeds the work that would be done by it if the system were taken from A to B along the isotherm.BIn the T-V diagram, the path AB becomes a part of a parabolaCIn the P-T diagram, the path AB becomes a part of a hyperbolaDIn going from A to B, the temperature T of the gas first increases to a maximum value and then decreases.
An ideal gas is taken from the state A (pressure p, volume V) to the state B (pressure p2, volume 2V) along a straight line path in the p-V diagram. Select the correct statement(s) from the following.
View SolutionAn ideal gas is taken from the state A (pressure p, volume V) to the state B (pressure p2, volume 2V) along a straight line path in the p-V diagram. Select the correct statement(s) from the following.
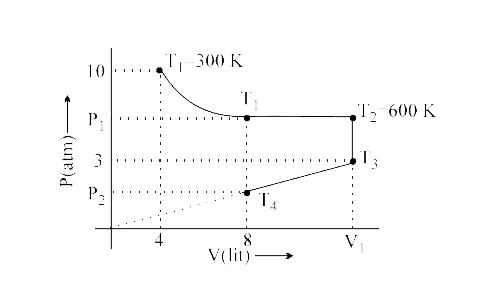
View SolutionFixed mass of a gas is subjected to the changes as shown is diagram, calculate T3,T4,P1,P2 and V1 as shown is diagram .Considering gas obeys PV = nRT equation.

View SolutionAn ideal gas is taken from the state A (pressure p, volume V) to the state B (pressure p2, volume 2V) along a straight line path in the p-V diagram. Select the correct statement(s) from the following.
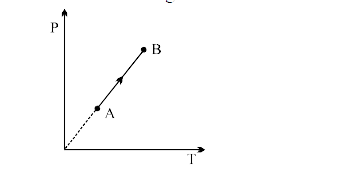
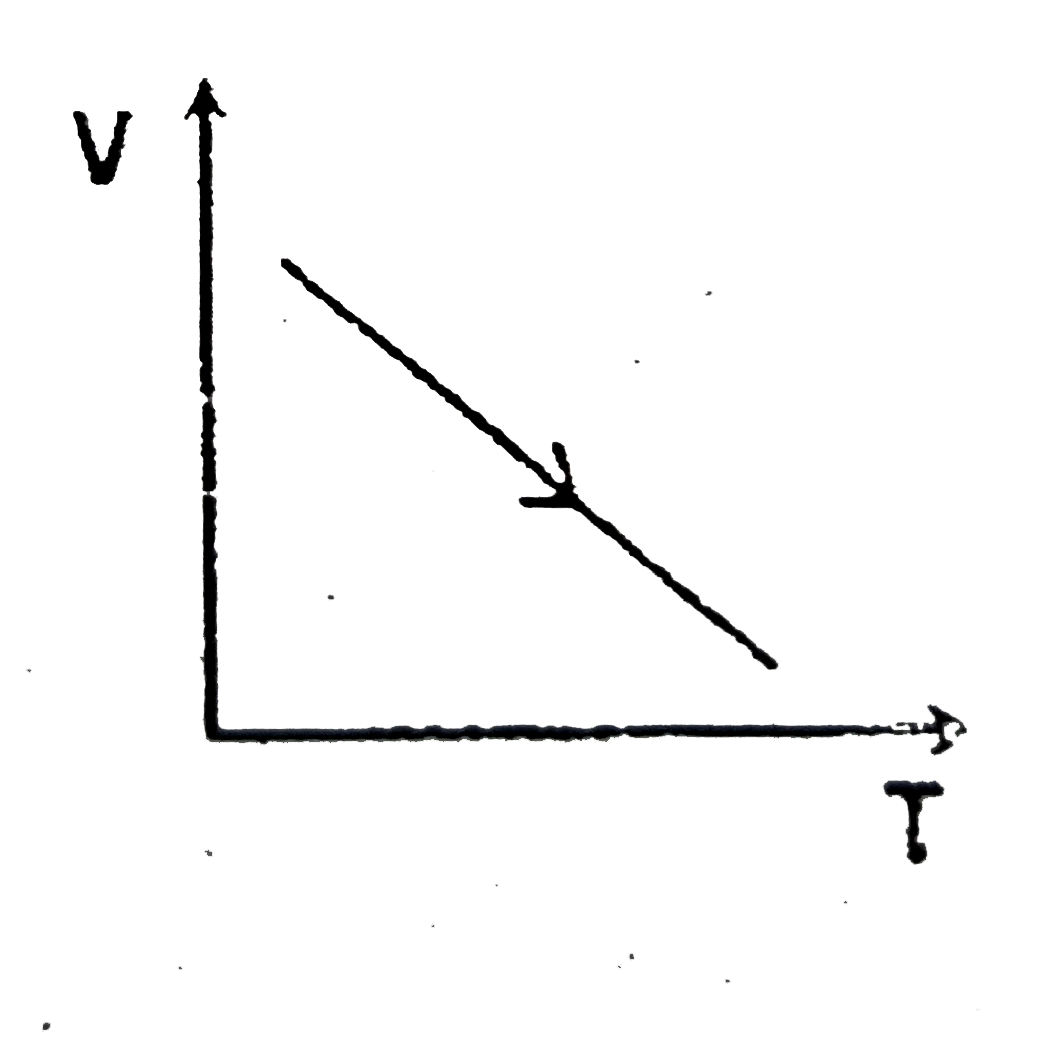
View SolutionSelect the correct option for an ideal gas undergoing a process as shown in diagram.

View Solution

