Answer the following based on the graph given

What is the state of the substance in the regions DE of the garph ?
Liquid and gas
Topper's Solved these Questions
- HEATBOOK - CHETAN PUBLICATIONCHAPTER - HEATEXERCISE - Paragraph Based Question .
4 Videos
- HEATBOOK - CHETAN PUBLICATIONCHAPTER - HEATEXERCISE - ASSIGNMENT - 5 (Answer the following)
3 Videos
- HEATBOOK - CHETAN PUBLICATIONCHAPTER - HEATEXERCISE - Darw a neat and labelled diagram.
4 Videos
- GRAVITATIONBOOK - CHETAN PUBLICATIONCHAPTER - GRAVITATIONEXERCISE - ASSIGNMENT-1
15 Videos
- LENSESBOOK - CHETAN PUBLICATIONCHAPTER - LENSESEXERCISE - Assignment
14 Videos
Similar Questions
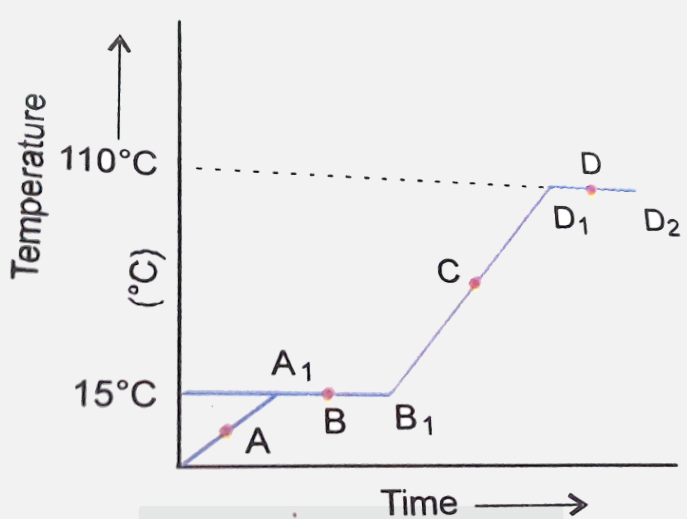
The temperature-time graph below shows the heating curve for pure wax. From the graph answer the following :
(a) What is the physical state of the substance at the points A, B, C and D ?
(b) What is the melting point of the substance ?
(c ) What is its boiling point ?
(d) Which portions of the graph indicates that change of state is taking place.
(e ) Name the terms used for heat absorbed during change of states involved in above processes.
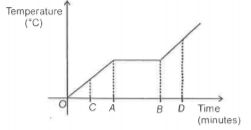
View SolutionFor the following temperature-time graph, in which region the state of material changes
View Solution
Knowledge Check
RS part of the graph indicates _________ state of substance
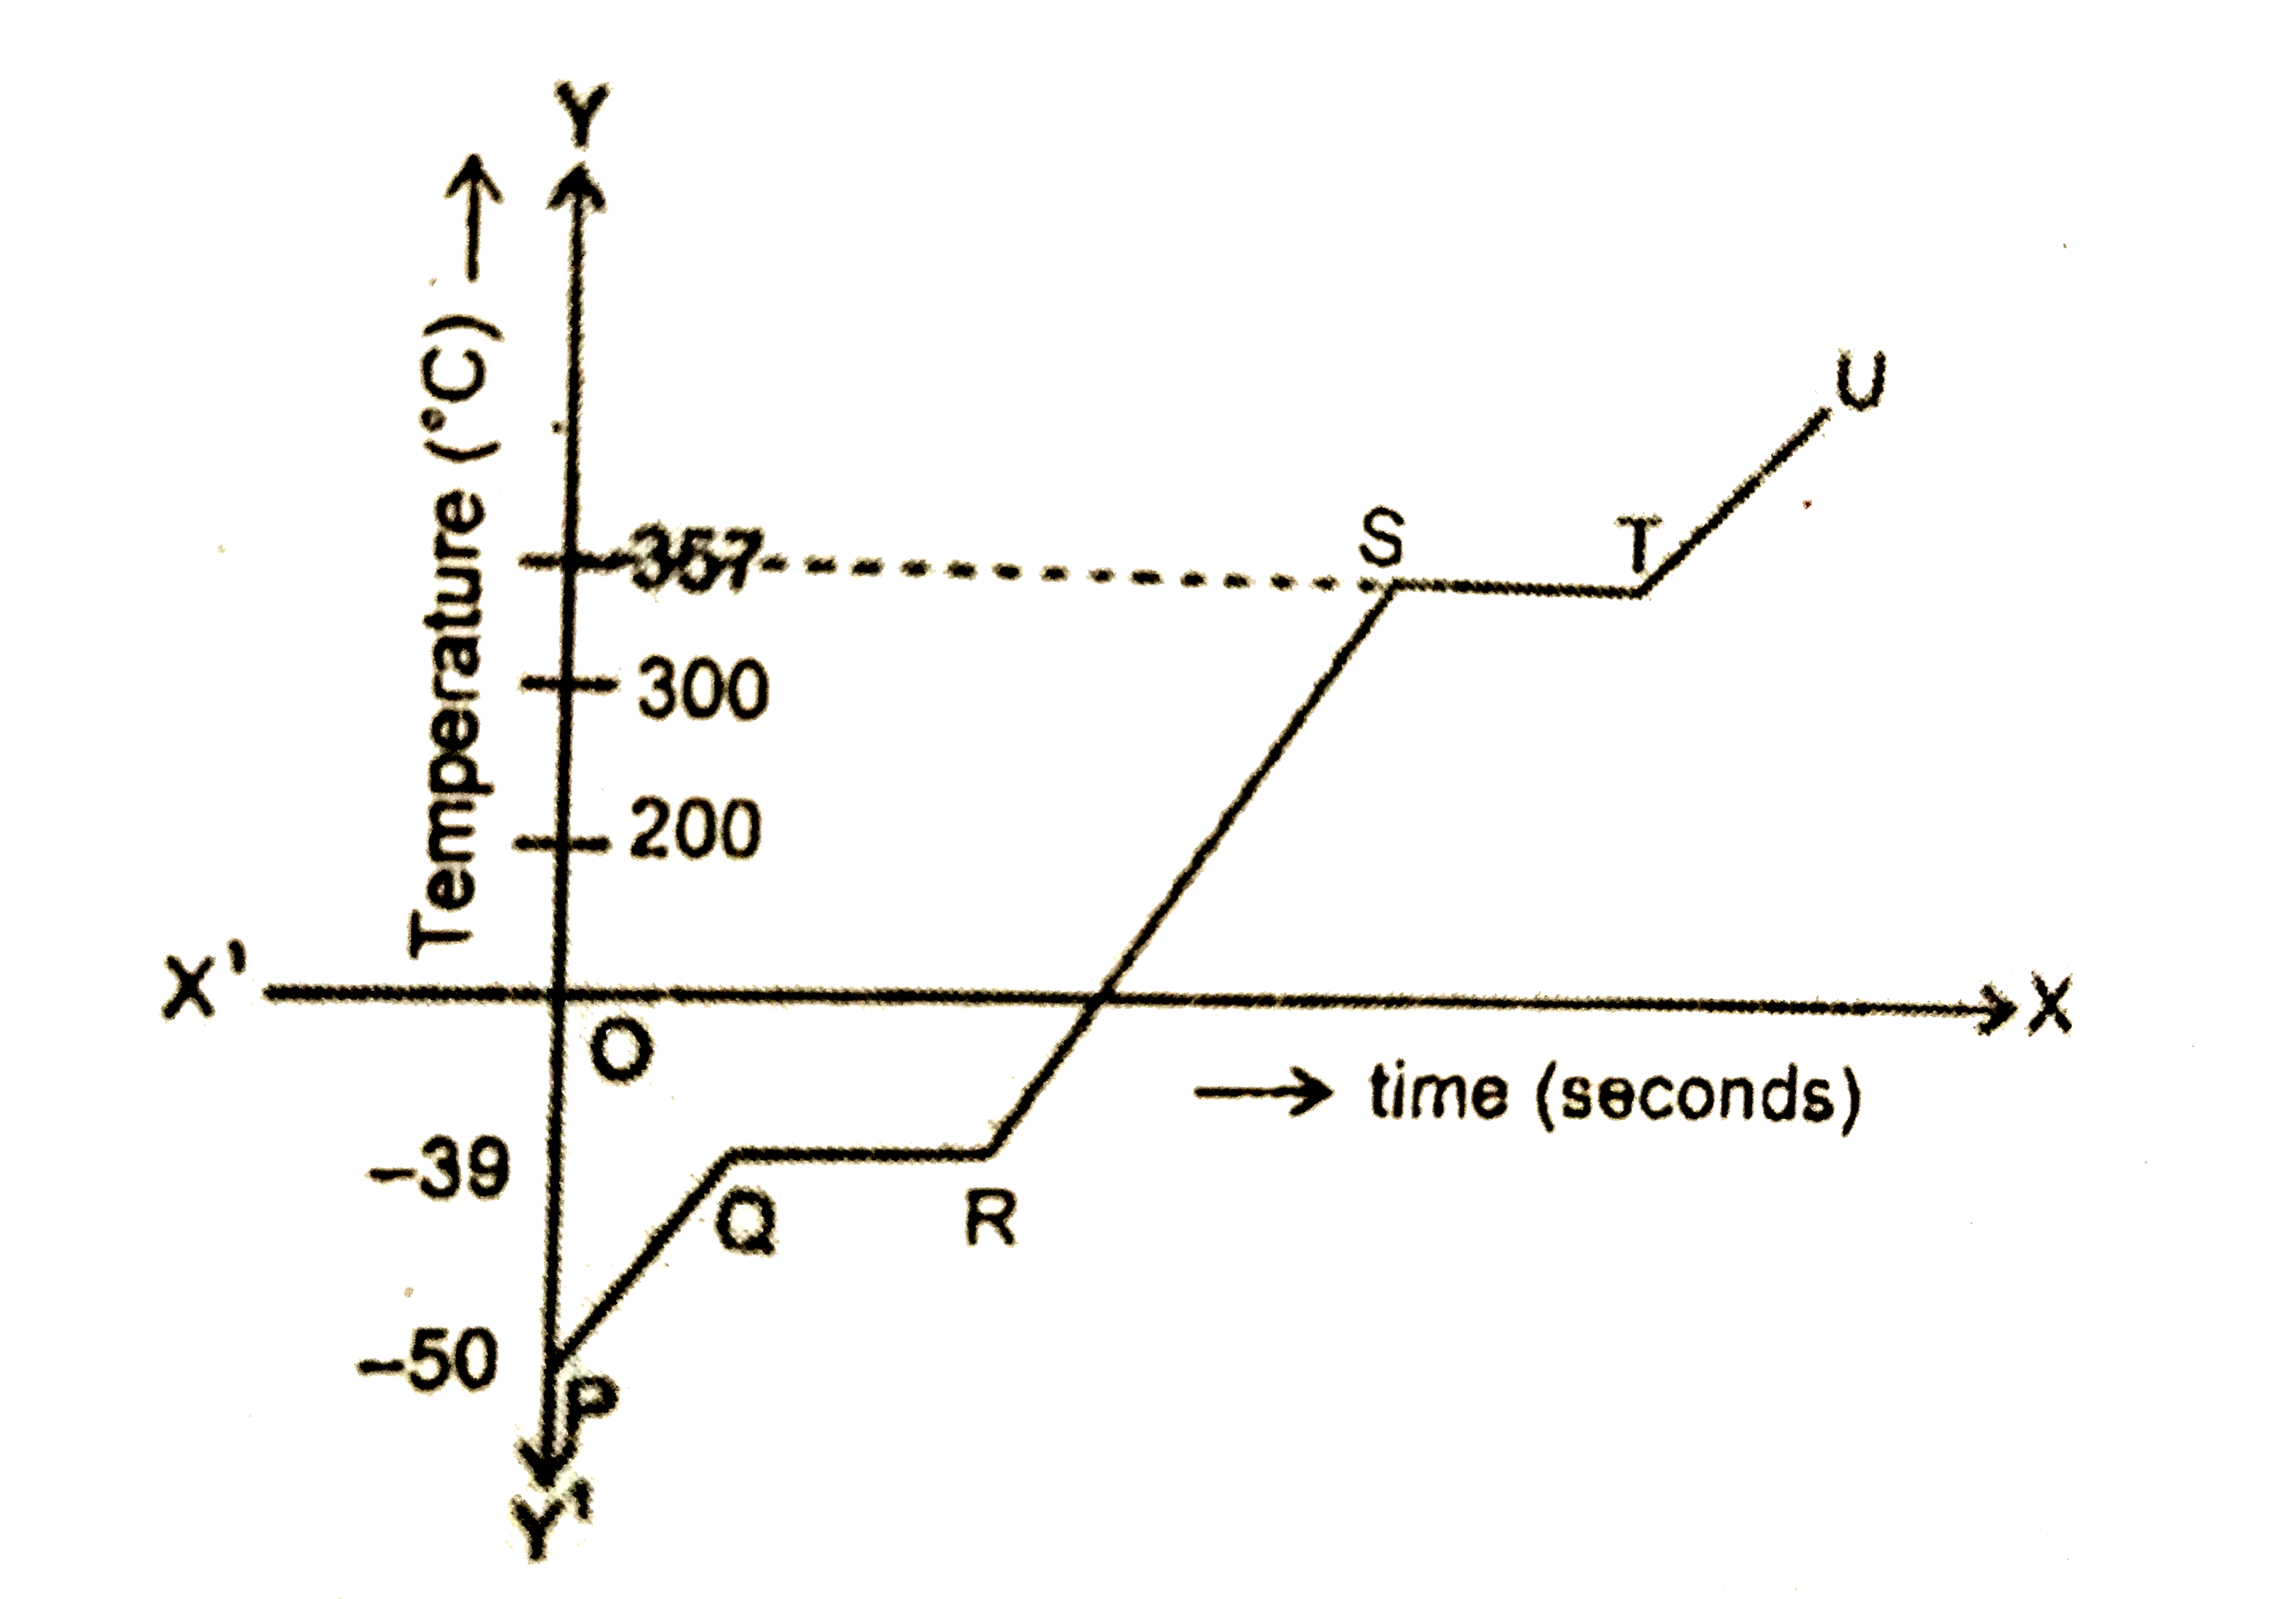 AsolidBliquidCgaseousDcannot be determined
For the following temperature-time graph, in which region the state of material changes
 AOCBABCBODCA
Study the graph carefully and answer the following questions.
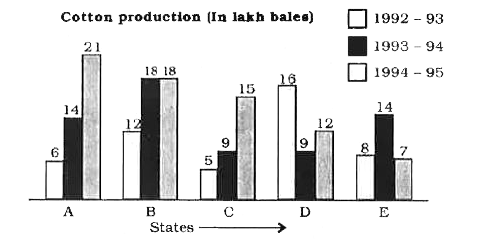
What is the average production of the four states in the year 1994-95 taken together ?A12.3B14.6C15.6D16.3
Based on the given graph, what will be the type of Gynoecium in the B?
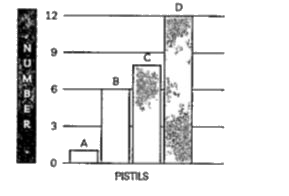
View SolutionThe given graph shows the heating curve for a pure substance. The temperature rises with time as the substance is heated :
(a) What is the physical state of the substance at the points A, B, C and D ?
What is the melting point of the substance ?
(c ) What is its boiling point ?
(d) What happens to the temperature while the substance is changing state ?
(e ) The substance is not water. How can you judge from the graph ?
View SolutionStudy the following graph and answer the question based on the graph.
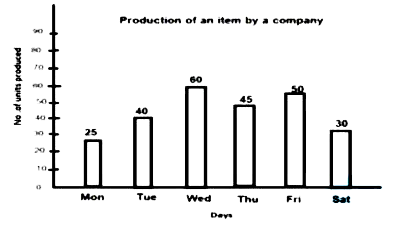
What was the percentage decline in the production from Friday to Saturday?
View SolutionStudy the following graph carefully and answer the given questions.
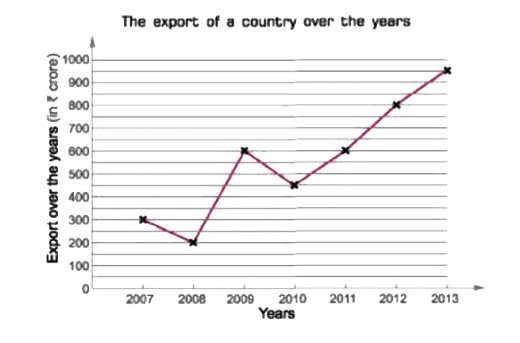
What is the total exports ( in ? Crore) for the given years ?
View SolutionExamine the following graph carefully and answer question based on the informations given in it
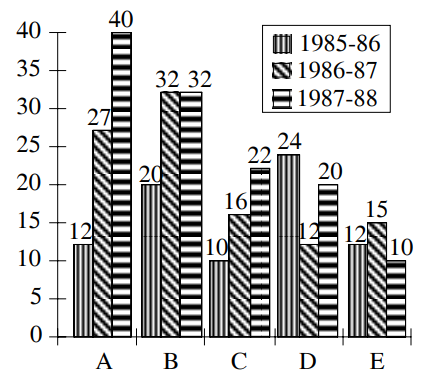
What is the average production (in lakh bales) of these states during 1987-88 ?
View Solution
