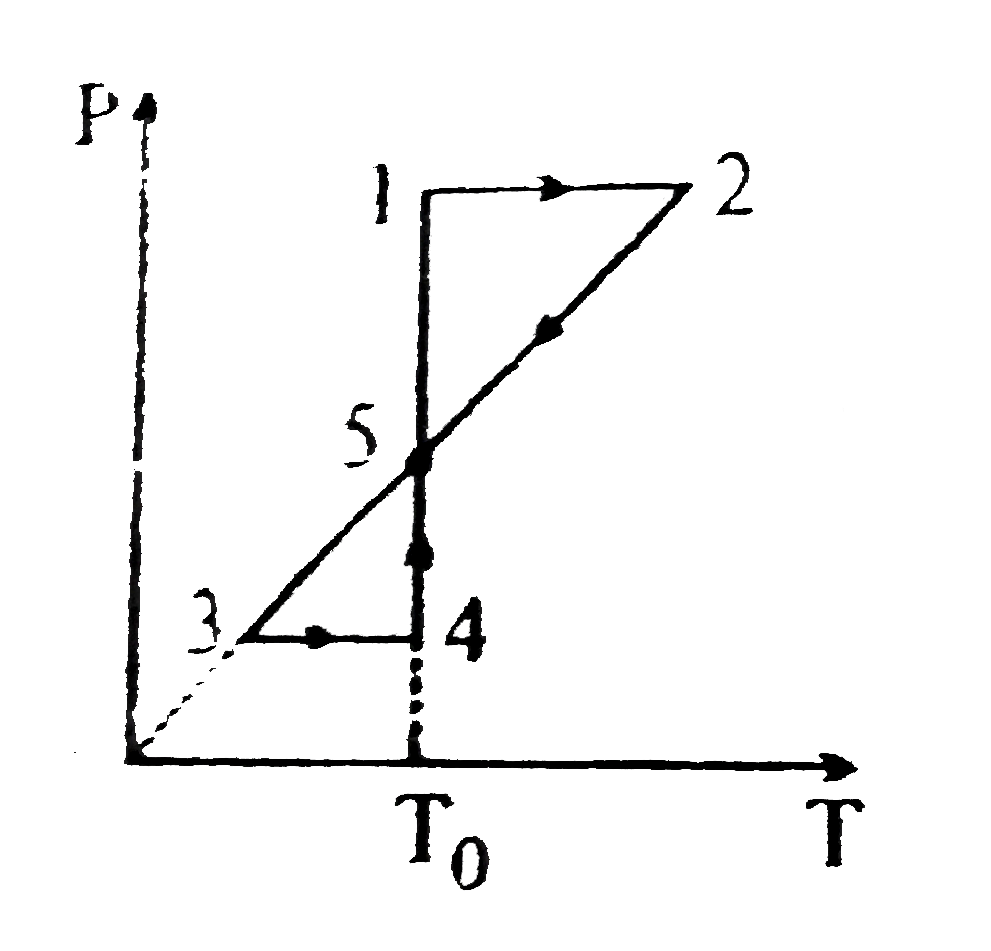
Consider PT graph of cyclic process shown in the figure. Maximum pressure during the cycle is twice the minimum pressure. The heat received by the gas in the process 1-2 is equal to the heat received in the process 3-4. The process is done on one mole of monoatomic gas.
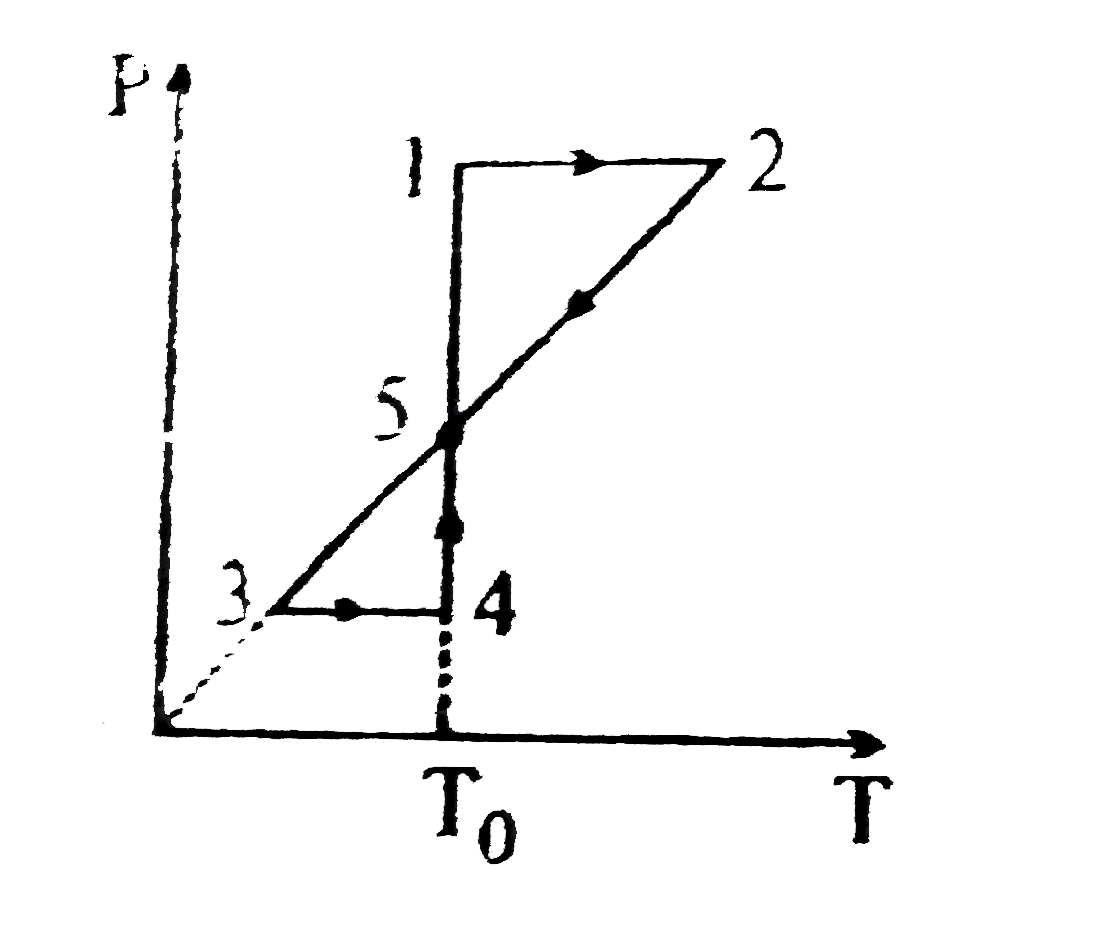
Correct PV diagram for the process is-
A

B

C

D

Video Solution
Text Solution
The correct Answer is:D
It is clear from the given diagram that the gas undergoes following processes during cycle.
1→2, isobaric
2→3, Isochoric
3→4, Isobaric
4→1 , Isothermal
Option (d) depicts the correct P-V diagram for the given cyclic process.
|
Topper's Solved these Questions
- THERMODYNAMICSBOOK - NCERT FINGERTIPSCHAPTER - THERMODYNAMICSEXERCISE - MCQs
6 Videos
- THERMODYNAMICSBOOK - NCERT FINGERTIPSCHAPTER - THERMODYNAMICSEXERCISE - Assertion And Reason
15 Videos
- THERMODYNAMICSBOOK - NCERT FINGERTIPSCHAPTER - THERMODYNAMICSEXERCISE - Carnot Engine
9 Videos
- THERMAL PROPERTIES OF MATTERBOOK - NCERT FINGERTIPSCHAPTER - THERMAL PROPERTIES OF MATTEREXERCISE - Assertion And Reason
10 Videos
- UNITS AND MEASUREMENTSBOOK - NCERT FINGERTIPSCHAPTER - UNITS AND MEASUREMENTSEXERCISE - Assertion And Reason
15 Videos
Similar Questions
Knowledge Check
Consider PT graph of cyclic process shown in the figure. Maximum pressure during the cycle is twice the minimum pressure. The heat received by the gas in the process 1-2 is equal to the heat received in the process 3-4. The process is done on one mole of monoatomic gas.
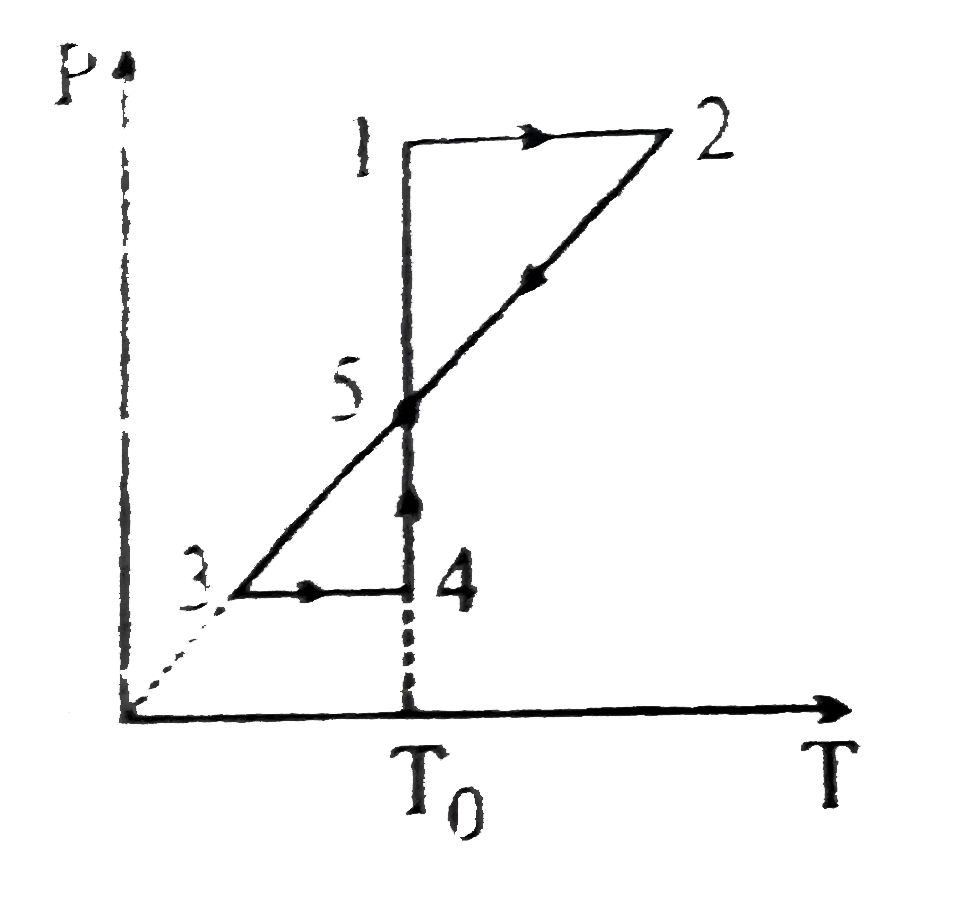
What is the heat released in the process 2-3?A5RT03BRT0C1.5RT0D2.5RT0Consider PT graph of cyclic process shown in the figure. Maximum pressure during the cycle is twice the minimum pressure. The heat received by the gas in the process 1-2 is equal to the heat received in the process 3-4. The process is done on one mole of monoatomic gas.
If the maximum pressure is P then what is the pressure at the point 5?A2P/3B4P/5C3P/4DNoneA cyclic process is shown in the figure. Work done during the cyclic process ABCDA is
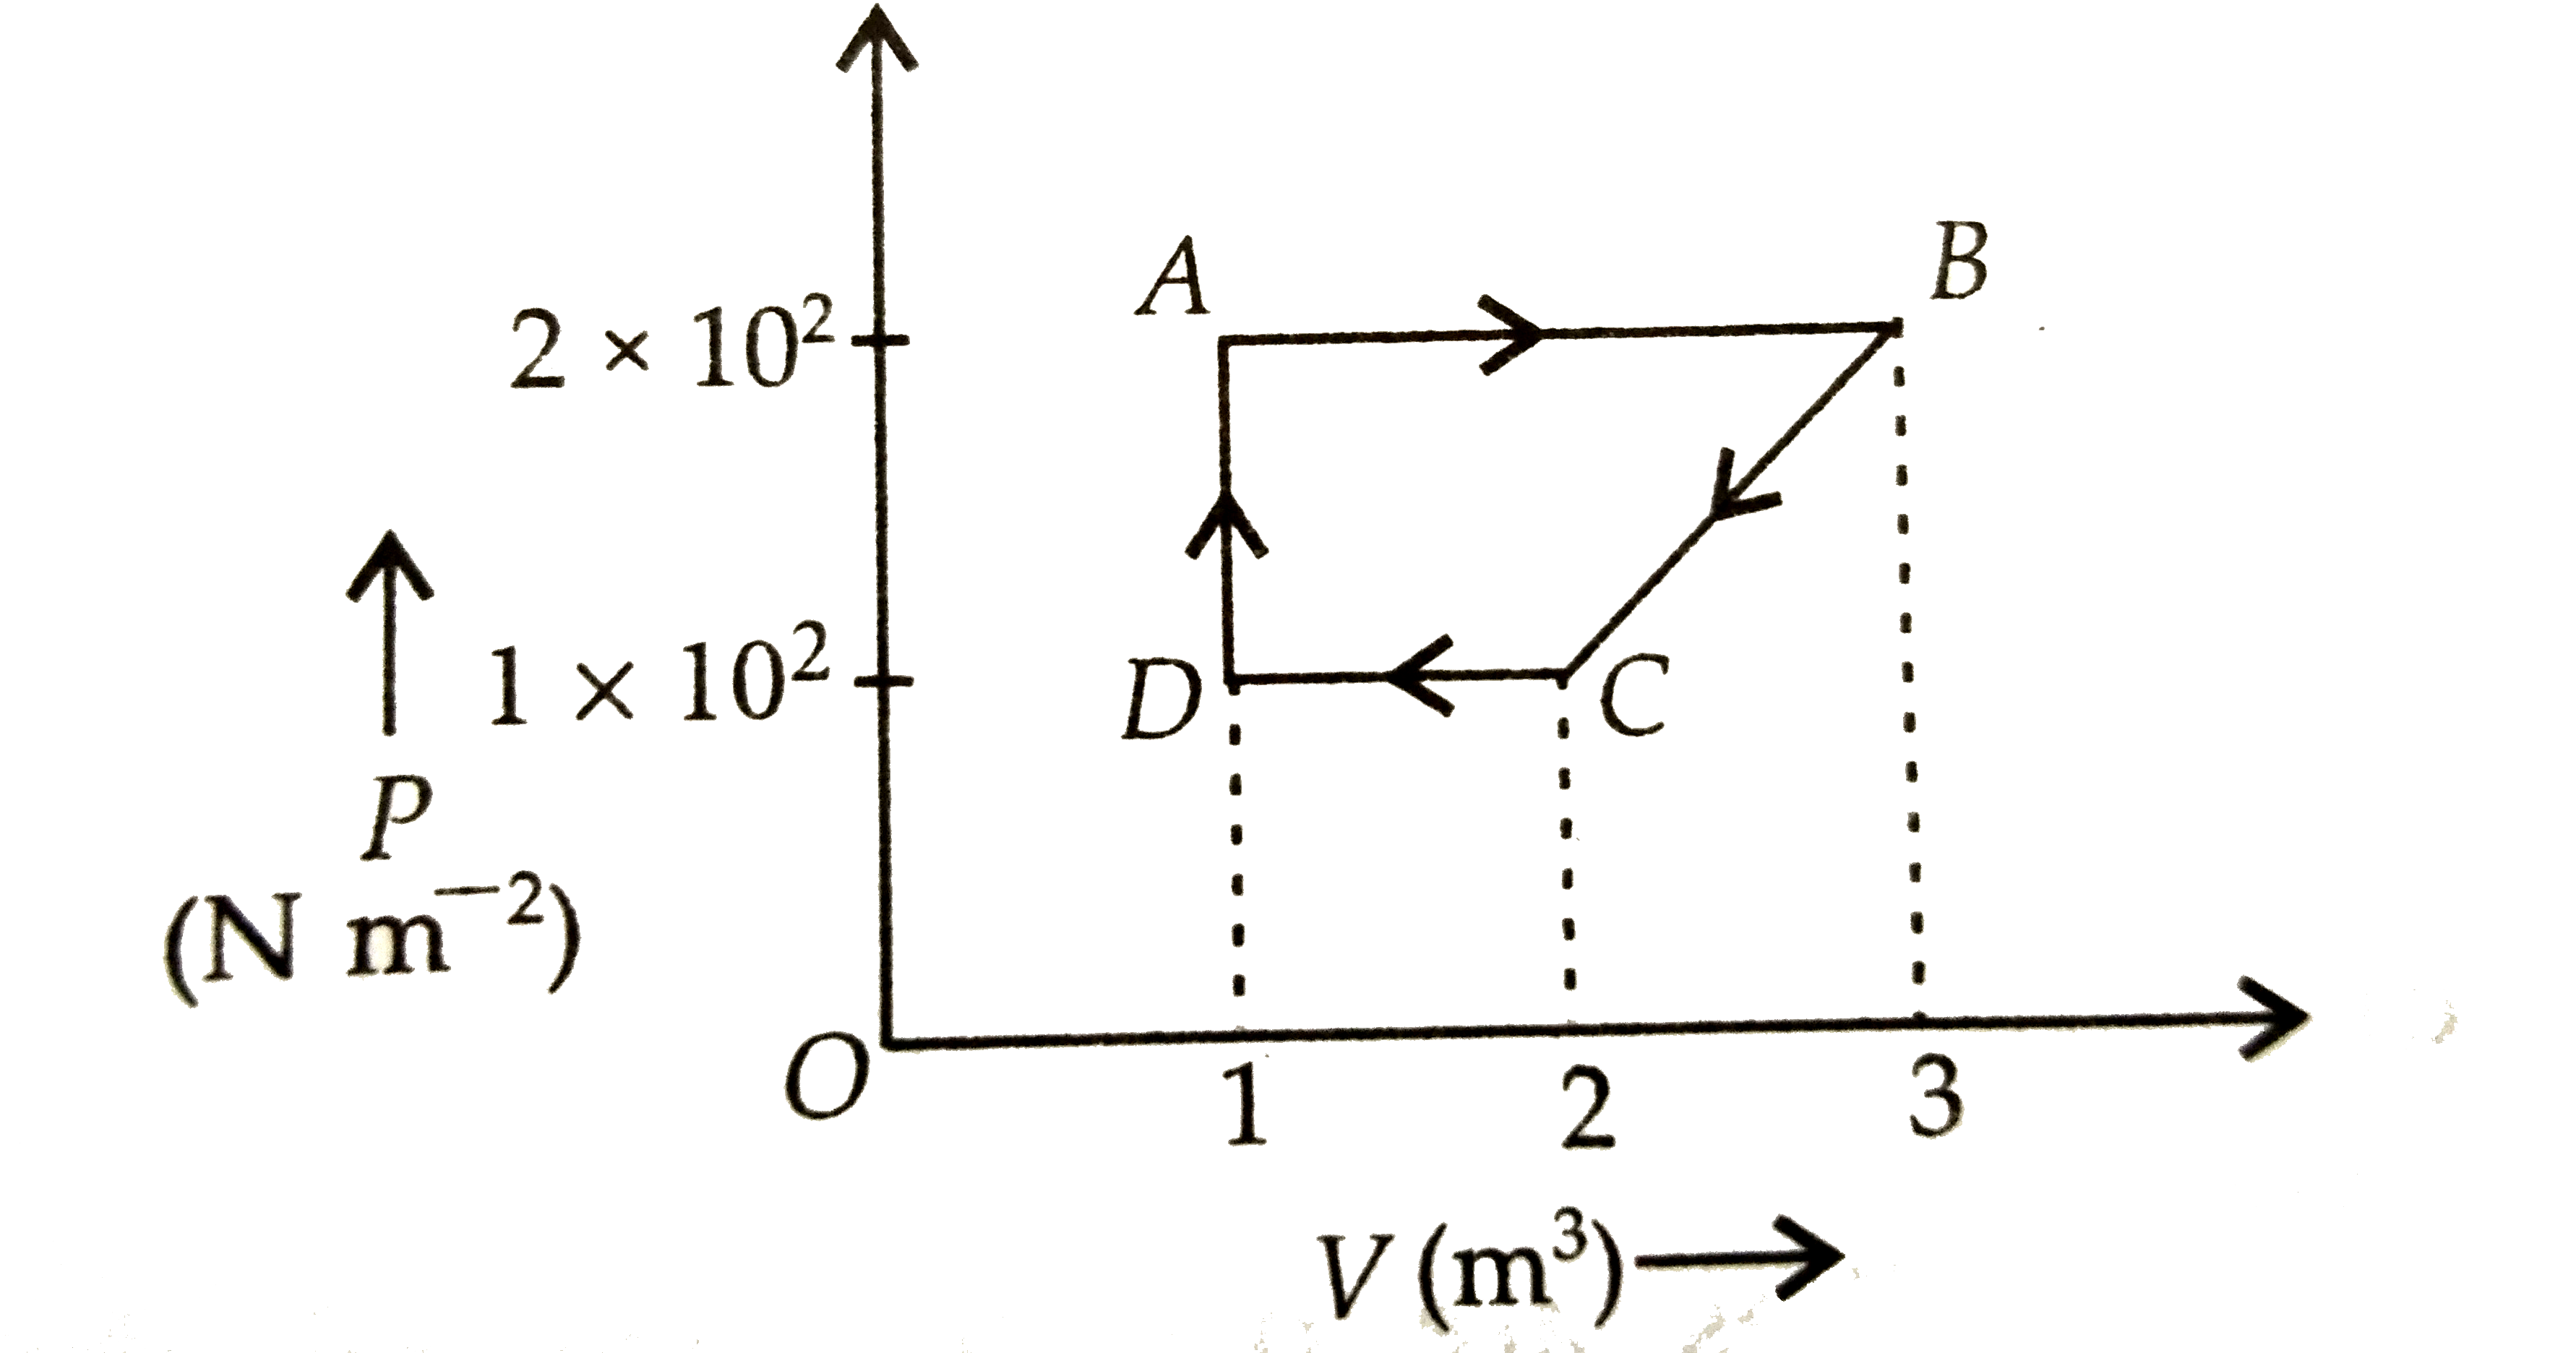 A150JB163JC145JD166J
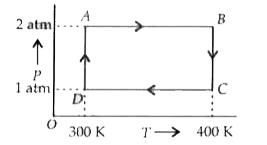
A cyclic process is shown in the figure. Work done during the cyclic process ABCDA is

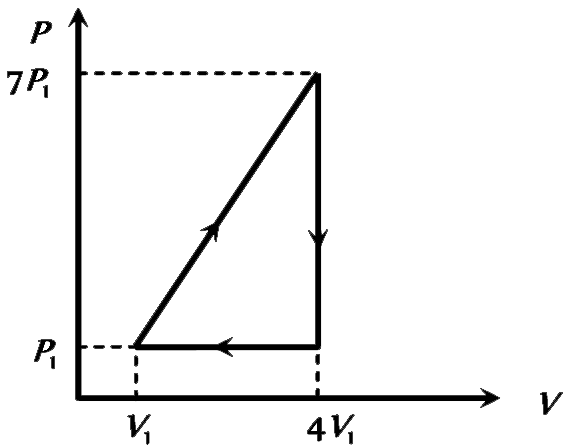
View SolutionIn the cyclic process shown in the figure, the work done by the gas in one cycle is
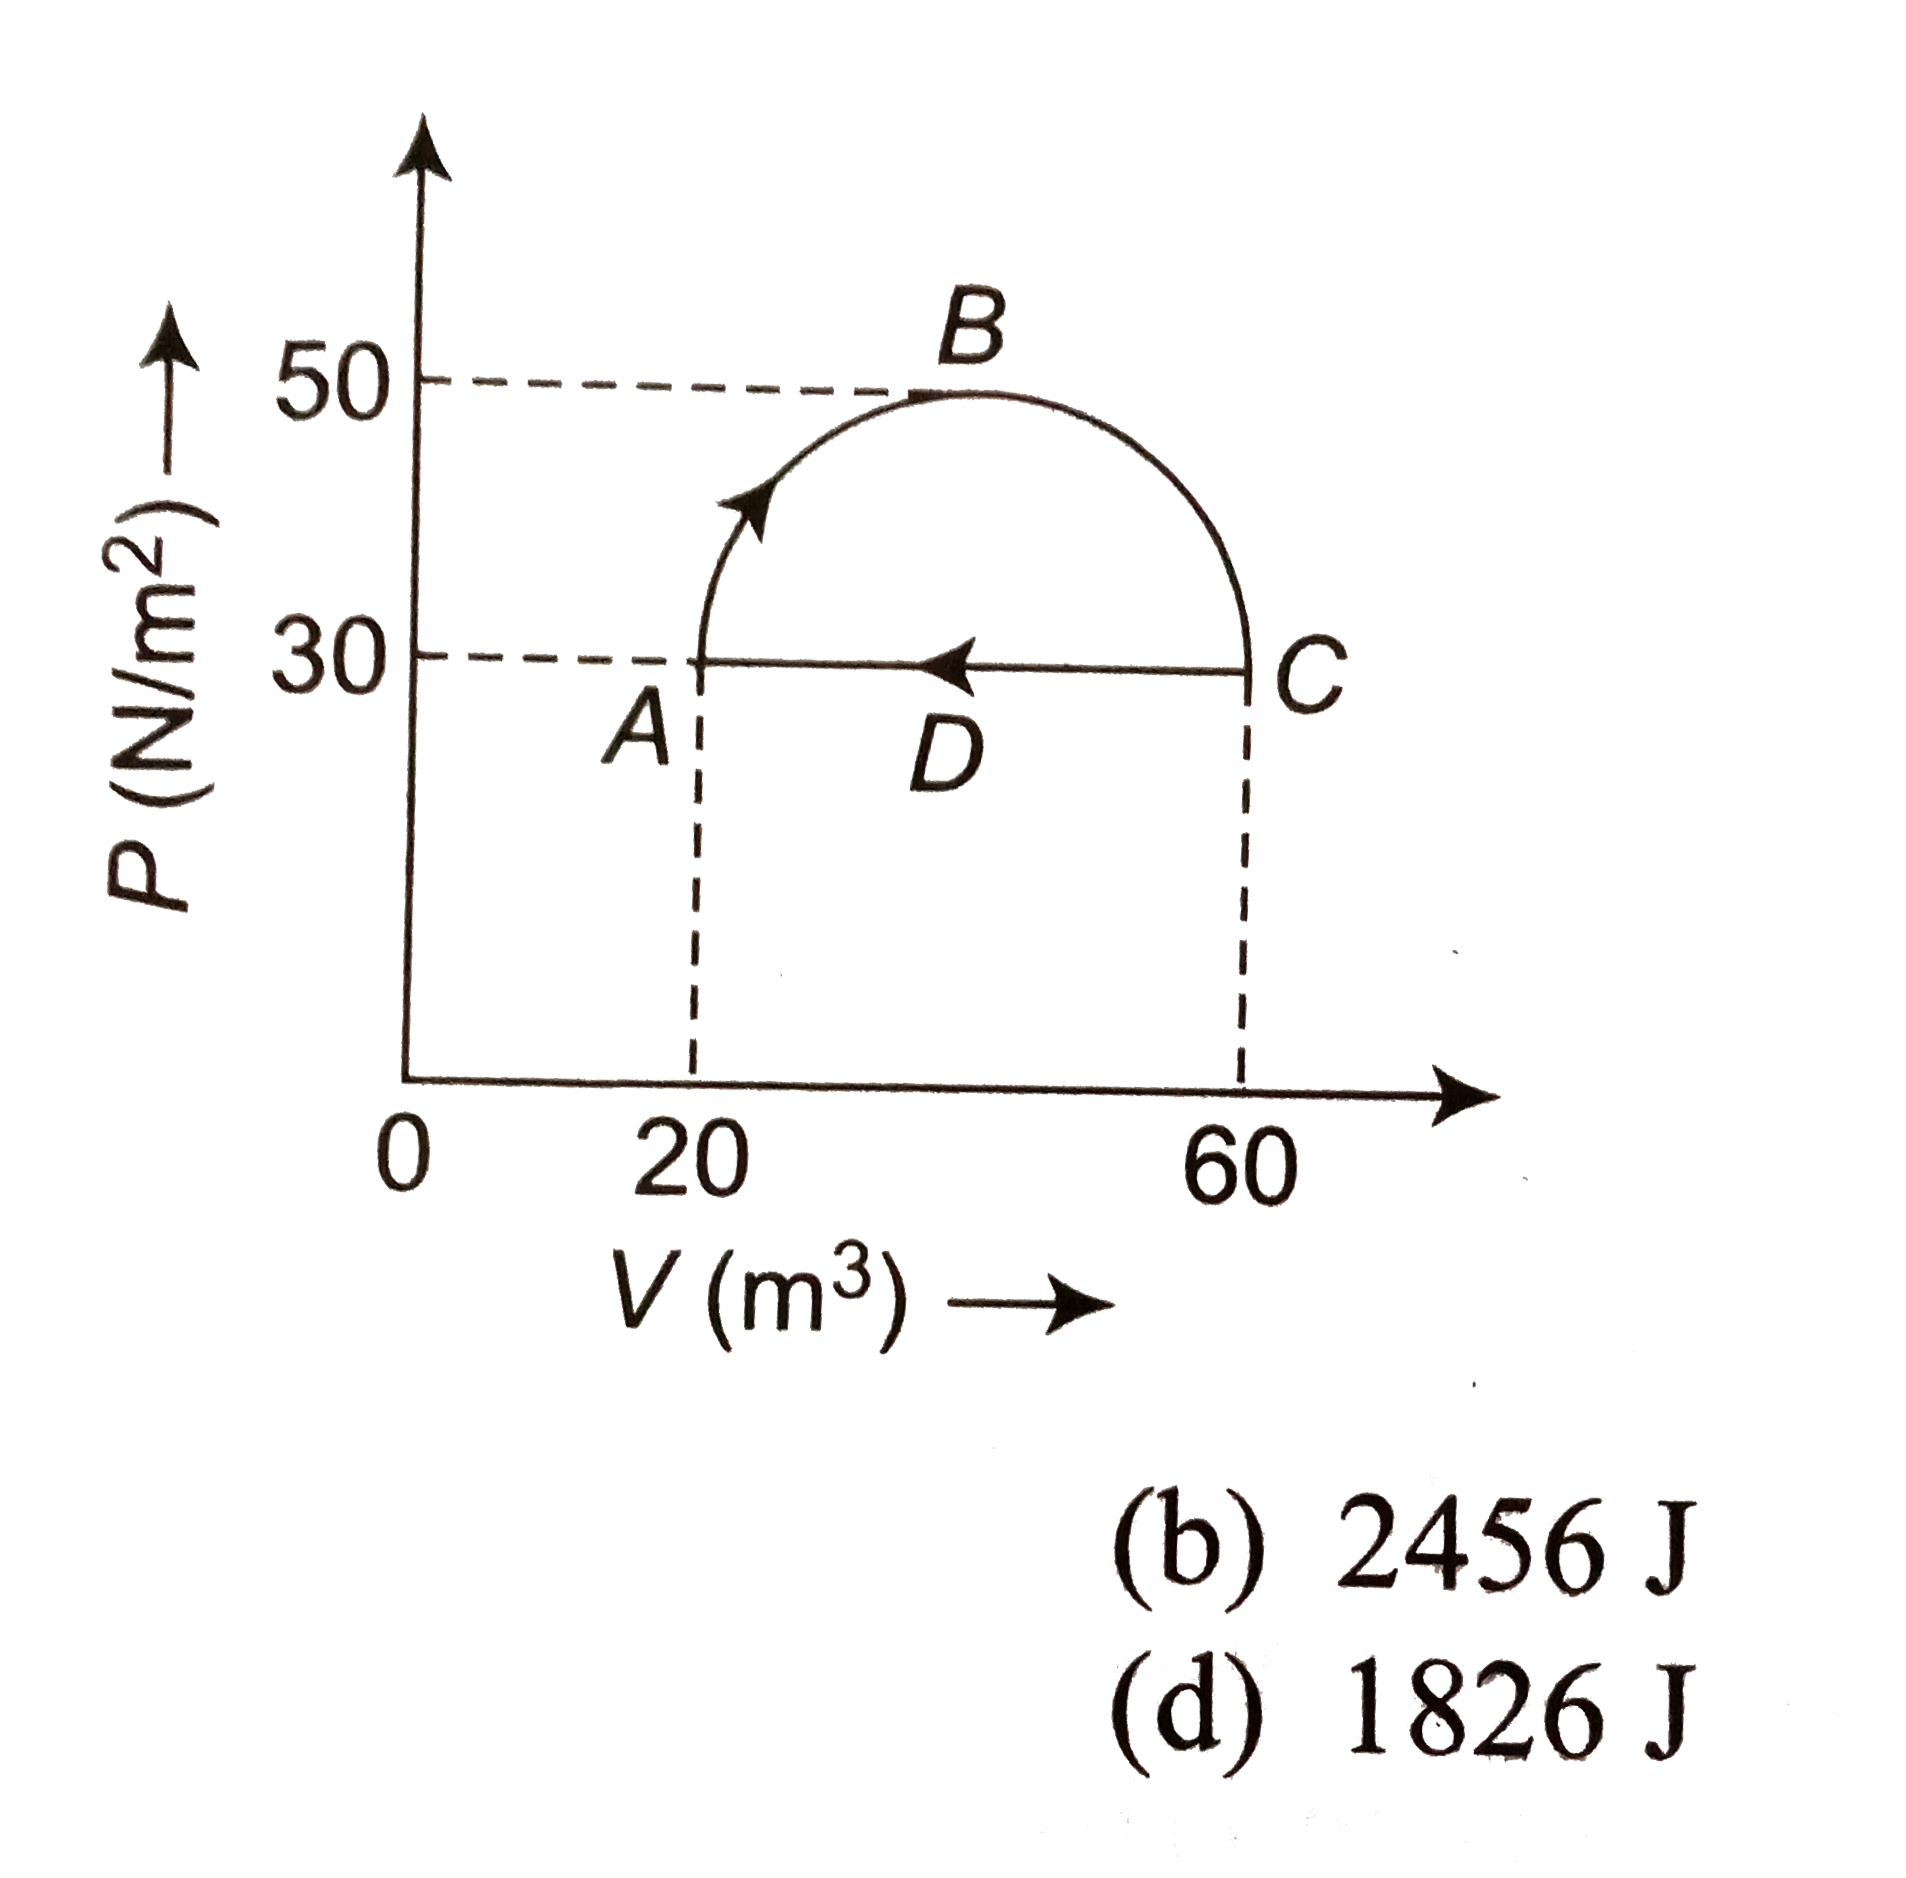
View SolutionA gas undergoes a cyclic process ABCDA as shown in the figure. The part ABC of process is semicircular. The work done by the gas is
View SolutionTwo moles of helium gas undergo a cyclic process as shown in figure. Assuming the gas to be ideal. The net work done by the gas is
View SolutionOne mole of a monatomic ideal gas is taken along the cycle ABCA as shown in the diagram.

The ratio of specific heat in the process CA to the specific heat in the process BC is
View Solution

