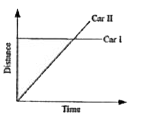
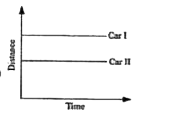
Consider the following statements: Car I is parked near a post office II. Car II is moving along a straight road with uniform speed Which of the following distance?time graphs represents the motion of the respective cars?
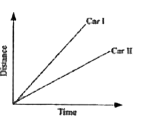
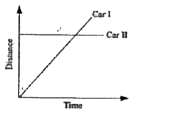
To solve the problem, we need to analyze the motion of the two cars based on the given statements and determine the appropriate distance-time graphs for each car.
1. Understanding Car I's Motion:
- Car I is parked near a post office, which means it is stationary.
- For a stationary object, the distance does not change over time. Therefore, the distance-time graph for Car I will be a horizontal line.
2. Understanding Car II's Motion:
- Car II is moving along a straight road with uniform speed. This means that the distance covered by Car II increases at a constant rate over time.
- The distance-time graph for an object moving at a uniform speed is a straight line that is inclined to the time axis.
3. Analyzing the Graphs:
- For Car I, the graph should be a horizontal line (indicating zero speed).
- For Car II, the graph should be a straight line with a positive slope (indicating constant speed).
4. Selecting the Correct Graphs:
- We need to find a graph that has a horizontal line for Car I and an inclined line for Car II.
- Among the options provided, we look for the graph that meets these criteria.
5. Final Answer:
- After analyzing the options, we find that Option 3 represents the correct distance-time graphs for Car I and Car II, where Car I is represented by a horizontal line and Car II by an inclined line.
Summary:
- Car I (stationary): Horizontal line on the distance-time graph.
- Car II (moving with uniform speed): Inclined line on the distance-time graph.
- The correct option is Option 3.
- Car I is parked near a post office, which means it is stationary.
- For a stationary object, the distance does not change over time. Therefore, the distance-time graph for Car I will be a horizontal line.
- Car II is moving along a straight road with uniform speed. This means that the distance covered by Car II increases at a constant rate over time.
- The distance-time graph for an object moving at a uniform speed is a straight line that is inclined to the time axis.
- For Car I, the graph should be a horizontal line (indicating zero speed).
- For Car II, the graph should be a straight line with a positive slope (indicating constant speed).
- We need to find a graph that has a horizontal line for Car I and an inclined line for Car II.
- Among the options provided, we look for the graph that meets these criteria.
- After analyzing the options, we find that Option 3 represents the correct distance-time graphs for Car I and Car II, where Car I is represented by a horizontal line and Car II by an inclined line.
- Car I (stationary): Horizontal line on the distance-time graph.
- Car II (moving with uniform speed): Inclined line on the distance-time graph.
- The correct option is Option 3.
Topper's Solved these Questions
- MOTIONBOOK - BEIITIANSCHAPTER - MOTIONEXERCISE - IIT JEE WORKSHEET (SINGLE CORRECT ANSWER TYPE-I)
8 Videos
- MOTIONBOOK - BEIITIANSCHAPTER - MOTIONEXERCISE - IIT JEE WORKSHEET (MULTIPLE CORRECT ANSWER TYPE-II)
5 Videos
- MOTIONBOOK - BEIITIANSCHAPTER - MOTIONEXERCISE - SUMMATIVE WORKSHEET
2 Videos
- MEASUREMENTBOOK - BEIITIANSCHAPTER - MEASUREMENTEXERCISE - IIT JEE WORKSHEET (IV INTEGER TYPE)
1 Videos
- SOUNDBOOK - BEIITIANSCHAPTER - SOUNDEXERCISE - IIT JEE Worksheet (V. Matrix Matching)
5 Videos
Similar Questions
Knowledge Check
A car is moving along a straight level road with constant speed. Then
Athe work done on the car is infiniteBthe work done on the car is zeroCthe work done on the car is a measure of the gravitational potential energyDthe work done on the car cannot be foundA car is moving along a straight level road with constant speed. Then
Athe work done on the car is a.measure of.its gravitational P.E.Bthe work one on the car is zero.Cthe work done on the car cannot. be foundDthe work done on the'car is infinite.A car parked on a road side from sometimes , starts moving with a constant speed . Which of the following distance- time graph shows the motion of that car ?
A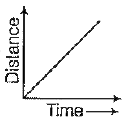 B
B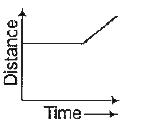 C
C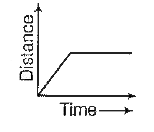 D
D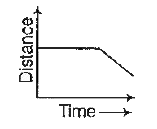
A car parked on a road side from sometime, starts moving with a constant speed. Which of the following distance-time graph shows the motion of that car ?
View SolutionA car is moving along a road with a uniform speed of 20 km/hour. The net force acting on the car is
View SolutionA car starts from erest accelerates uniform by for 4 second and then moves with uniform velocity which of the x-t graph represent th motion of the car:-
View SolutionConsider a car moving on a straight road with a speed of 100m/s. The distance at which car can be stopped is [μk=0.5]
View SolutionA car is moving on a straight road covers one third of the distance with a speed of 20 km/h and the rest with a speed of 60 km/h. The average speed of the car is
View Solution

