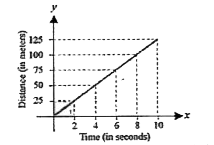
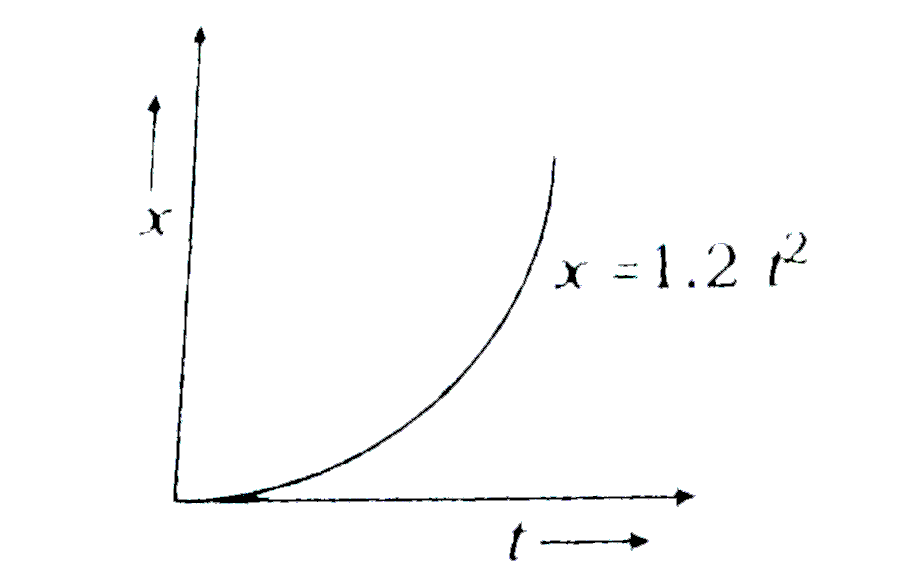
A toy car is moving away from a wall, as shown in the given figure. As time increases, the distance of the car from the wall also increases, as depicted in the graph. The hypothesis that can be derived from the given graph is
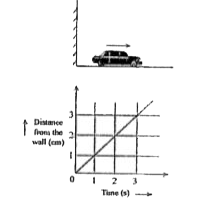
Distance of the car from the wall=Time
Distance of the car from the wall = 2x Time
Distance of the car from the wall =Time2
Distance of the car from the wall=Time3
Step by step video & image solution for A toy car is moving away from a wall, as shown in the given figure. As time increases, the distance of the car from the wall also increases, as depicted in the graph. The hypothesis that can be derived from the given graph is by Physics experts to help you in doubts & scoring excellent marks in Class 7 exams.
Updated on:21/07/2023Topper's Solved these Questions
- MOTIONBOOK - BEIITIANSCHAPTER - MOTIONEXERCISE - IIT JEE WORKSHEET (SINGLE CORRECT ANSWER TYPE-I)
8 Videos
- MOTIONBOOK - BEIITIANSCHAPTER - MOTIONEXERCISE - IIT JEE WORKSHEET (MULTIPLE CORRECT ANSWER TYPE-II)
5 Videos
- MOTIONBOOK - BEIITIANSCHAPTER - MOTIONEXERCISE - SUMMATIVE WORKSHEET
2 Videos
- MEASUREMENTBOOK - BEIITIANSCHAPTER - MEASUREMENTEXERCISE - IIT JEE WORKSHEET (IV INTEGER TYPE)
1 Videos
- SOUNDBOOK - BEIITIANSCHAPTER - SOUNDEXERCISE - IIT JEE Worksheet (V. Matrix Matching)
5 Videos
Similar Questions
Knowledge Check
Block A is moving away from the wall at a speed v and acceleration a.
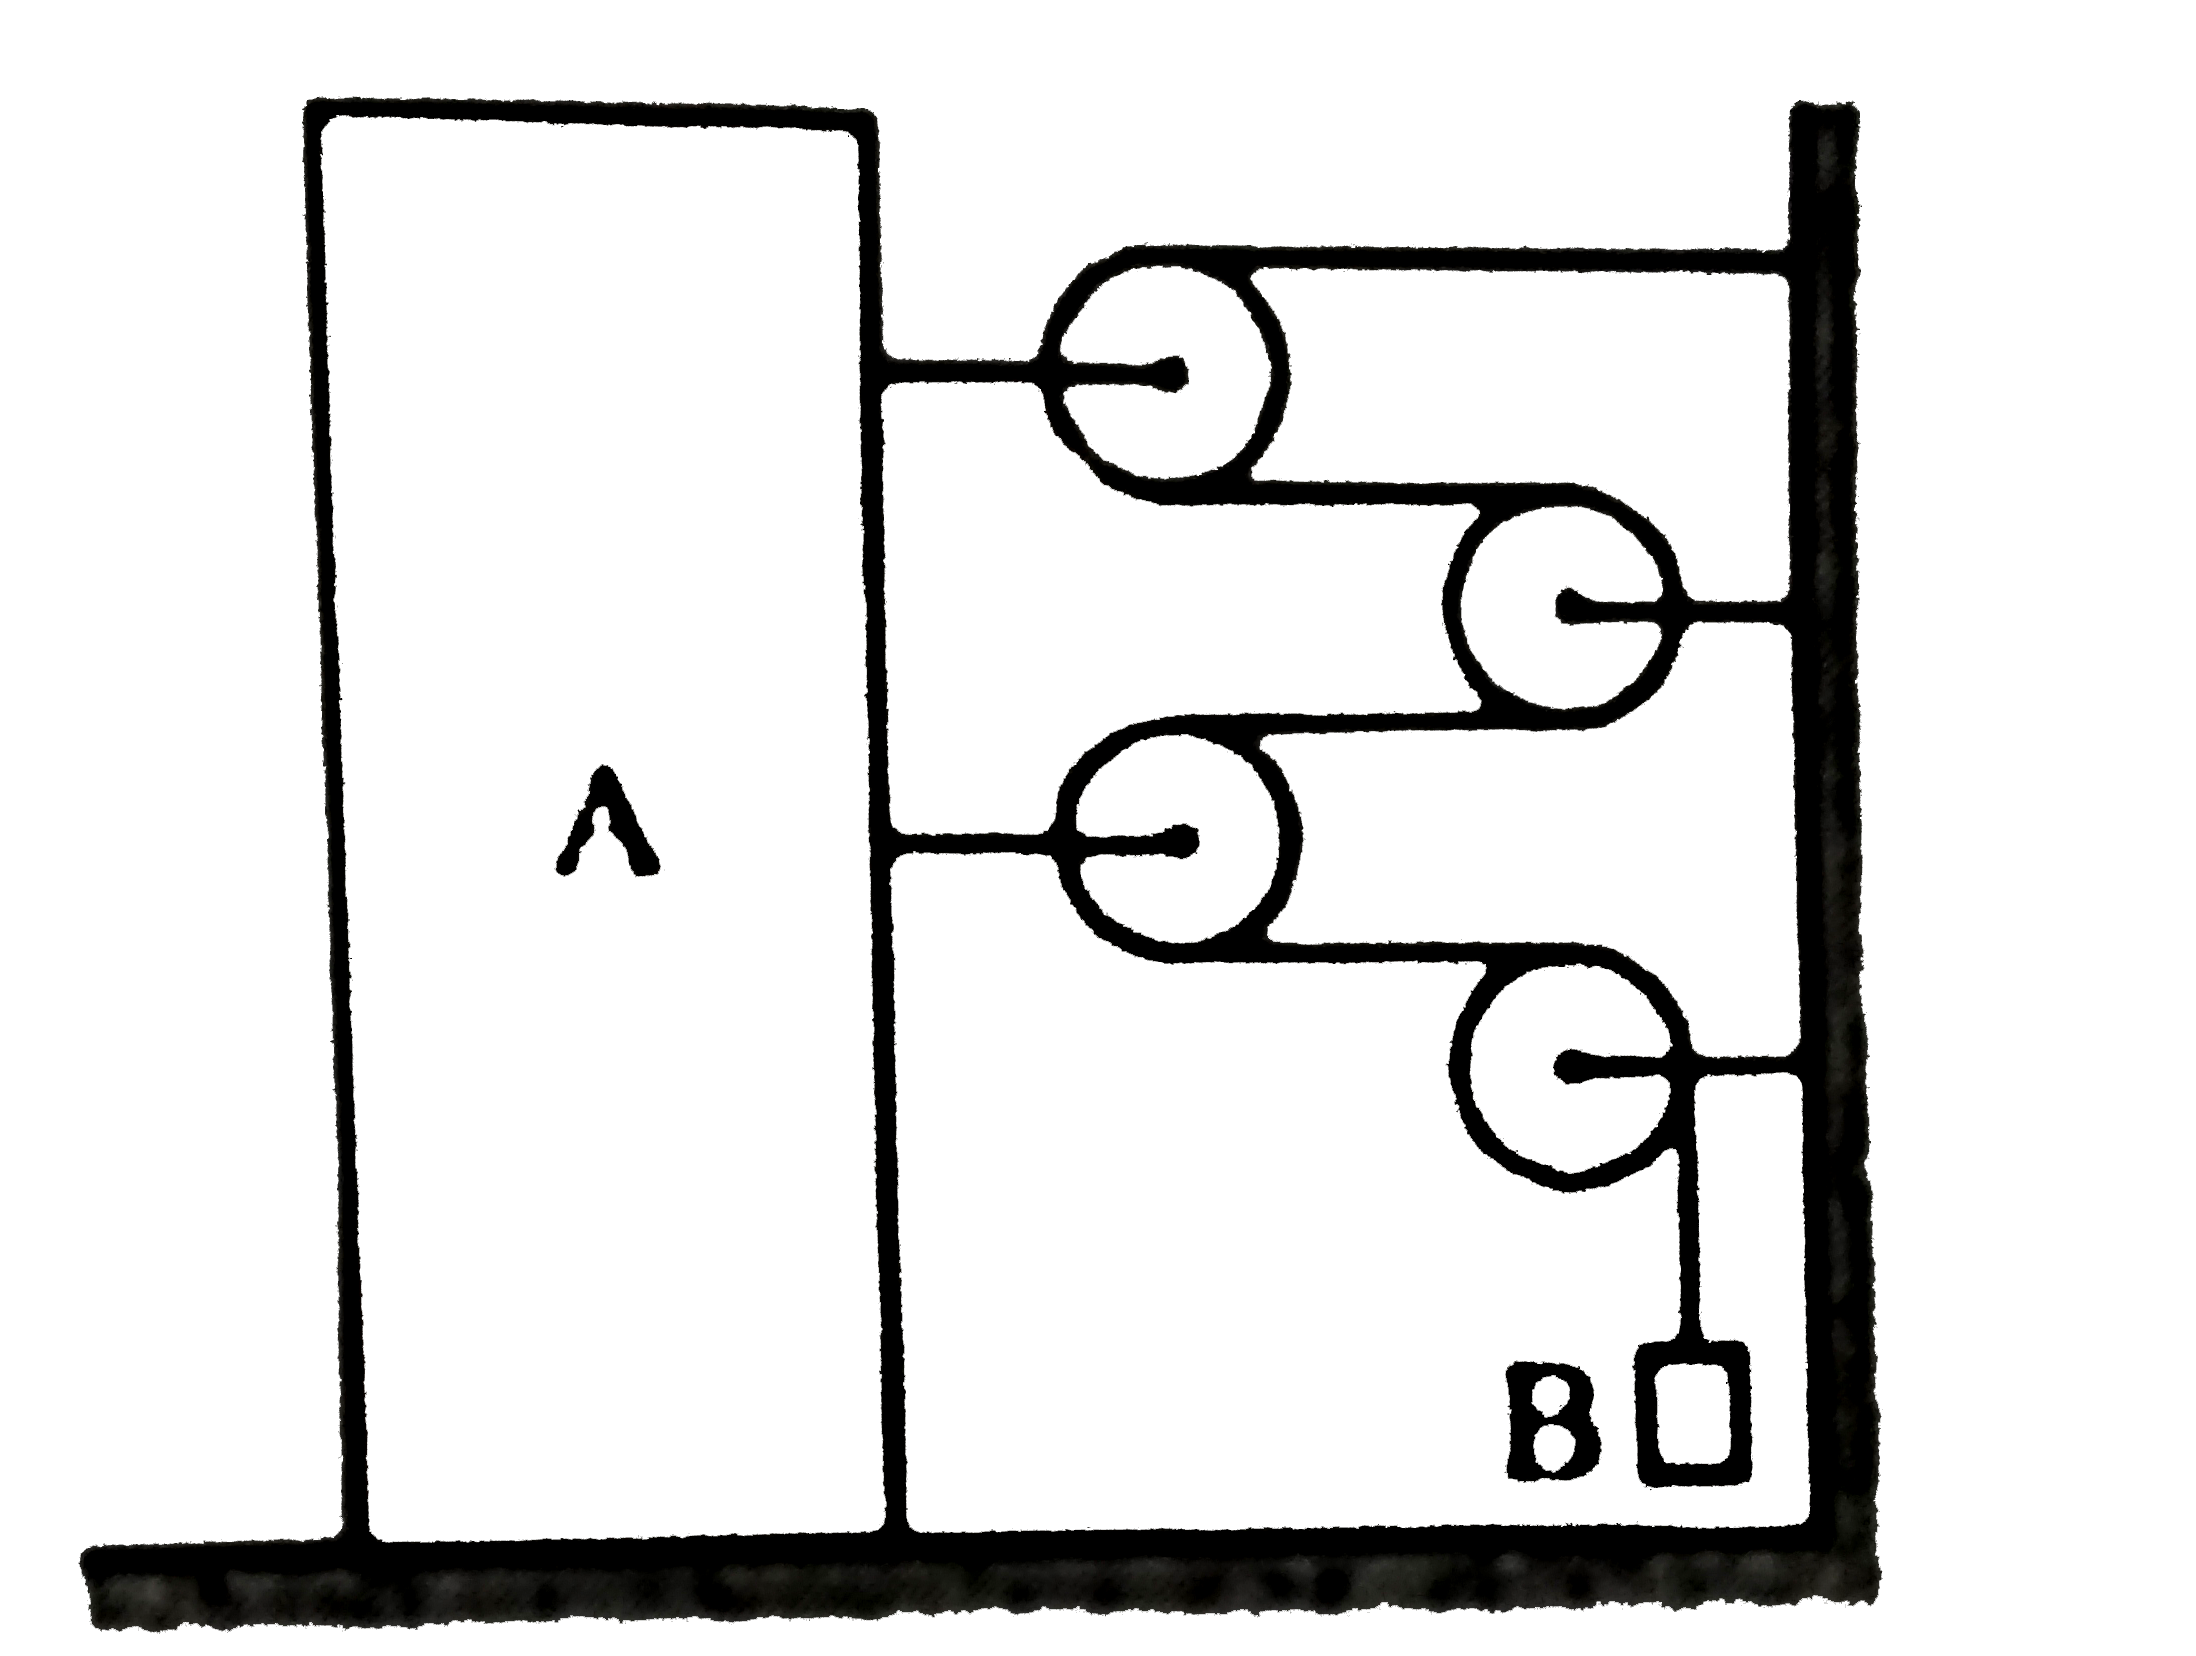 AVelocity of B is v with respect to A.BAcceleration of B is wita respect to A.CAcceleration of B is 4a with respect to A.DAcceleration of B is √17a with respect to A.
In the shown figure the minimum value of F required to move the block A away from the wall is :
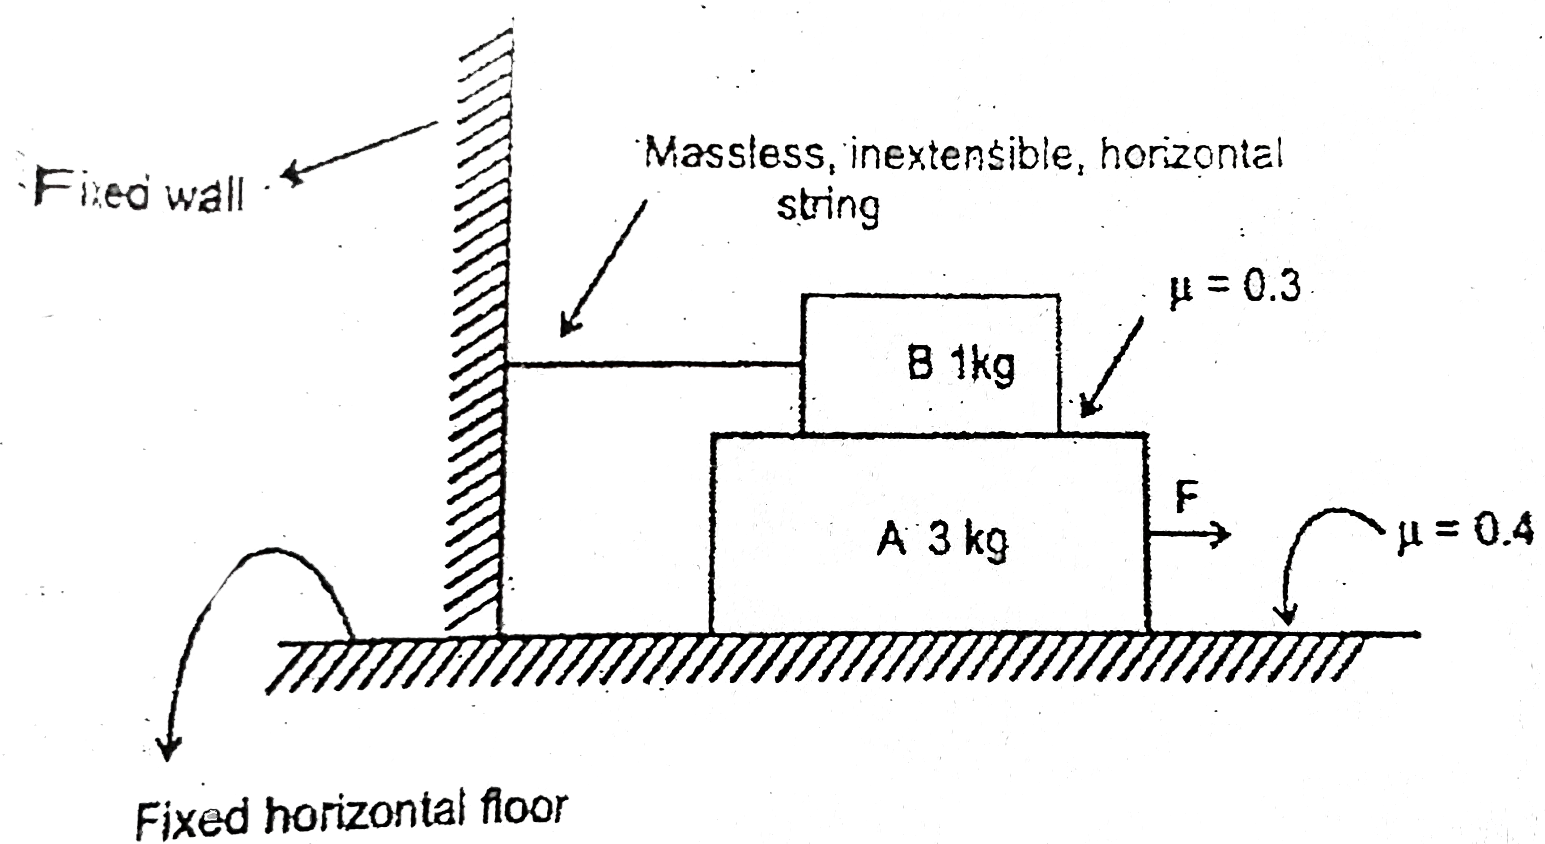 A17g15B19g10C23g10D11g10
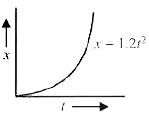
Figure given shows the distance - time graph of the motion of a car. It follows from the graph that the car is
 Aat restBin uniform motionCin non-uniform accelerationDuniformly accelerated
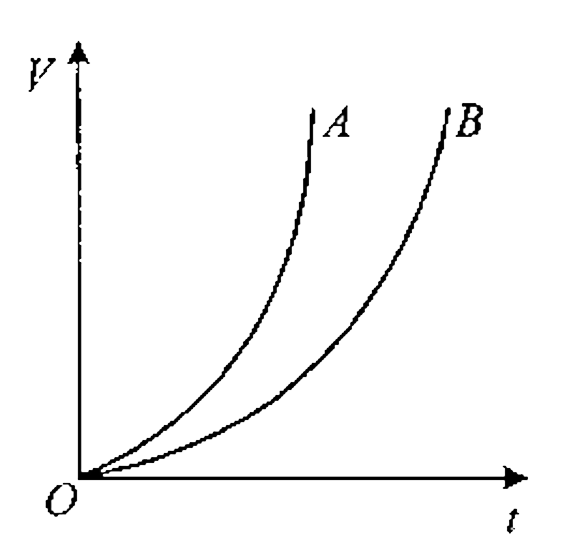
A time-velocity graph of two vehicles A and B starting from rest at the same time is given in the figure-1.107. The statement that can be deduced correctly from the graph is :
View SolutionGiven figure shows the distance-time graph of the motion of a car. It follows from the,| graph that the car is
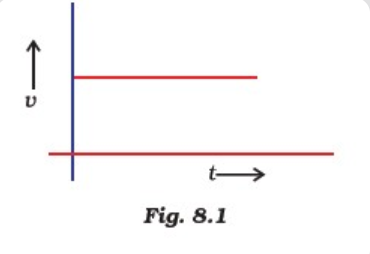
View SolutionFrom the given v-t graph (see figure), it can be inferred that the object is
View SolutionThe velocity-time graph of a car moving along a straight road is shown in figure. The average velocity of the car is first 25 seconds is
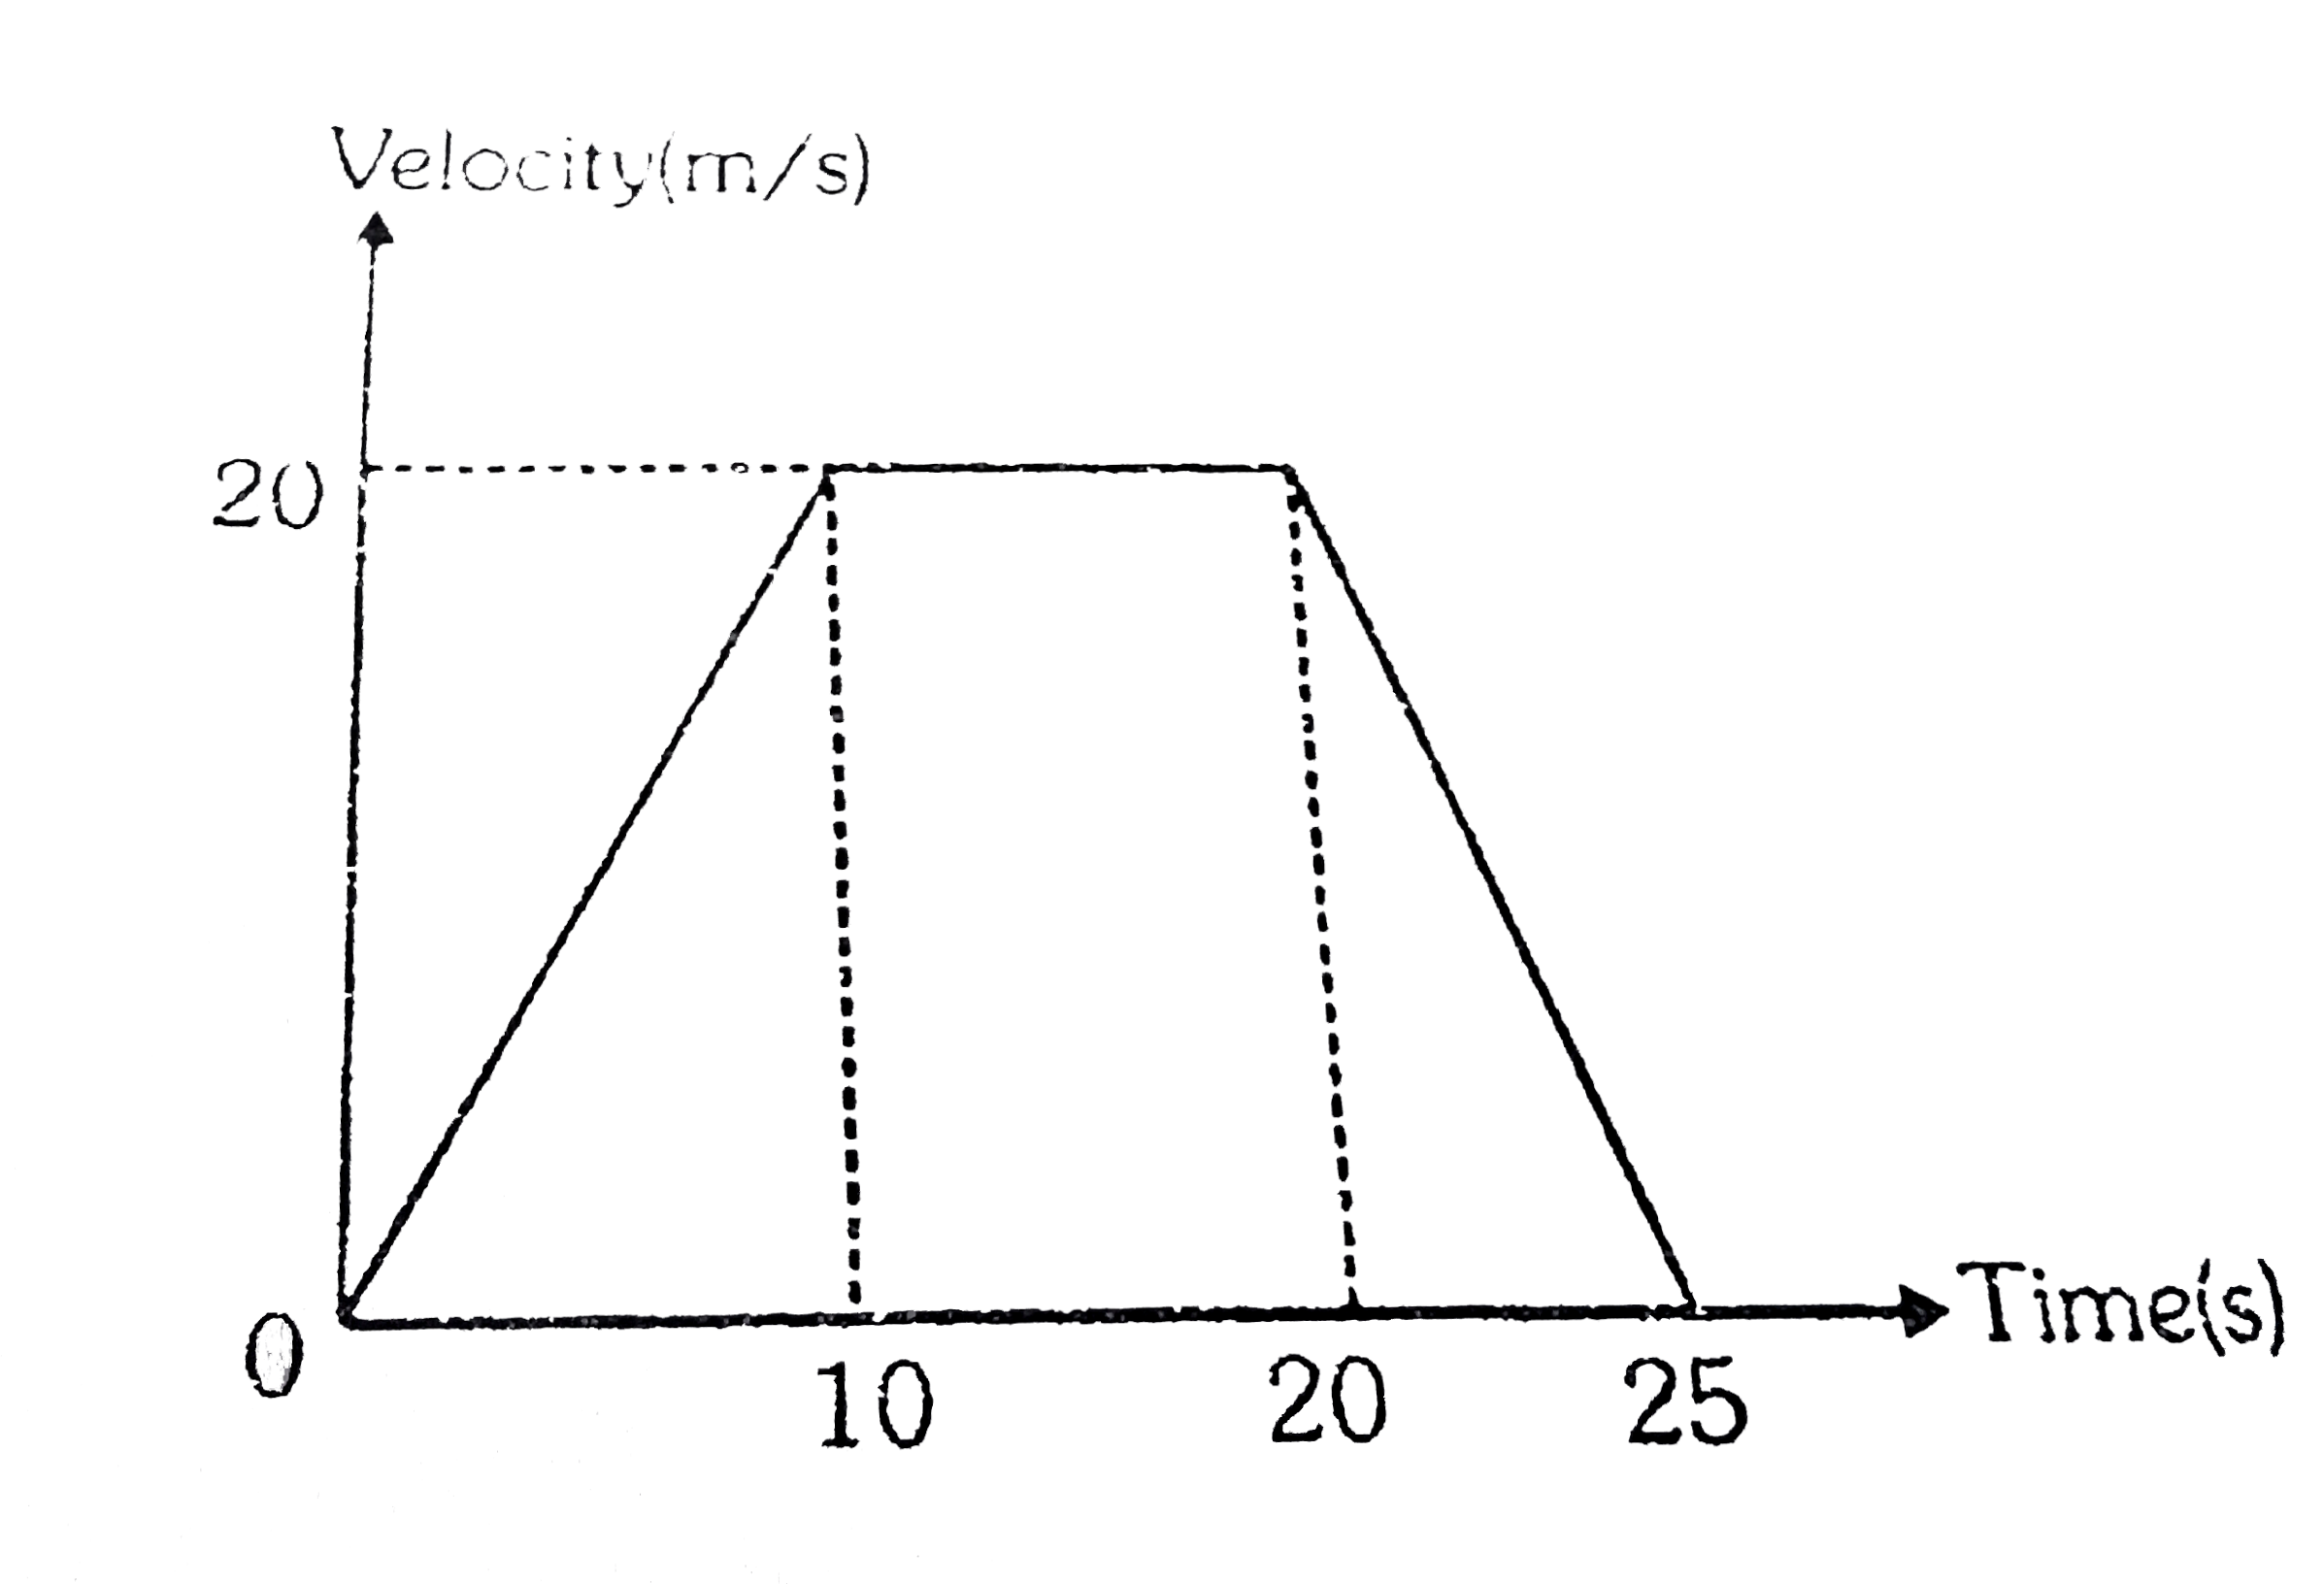
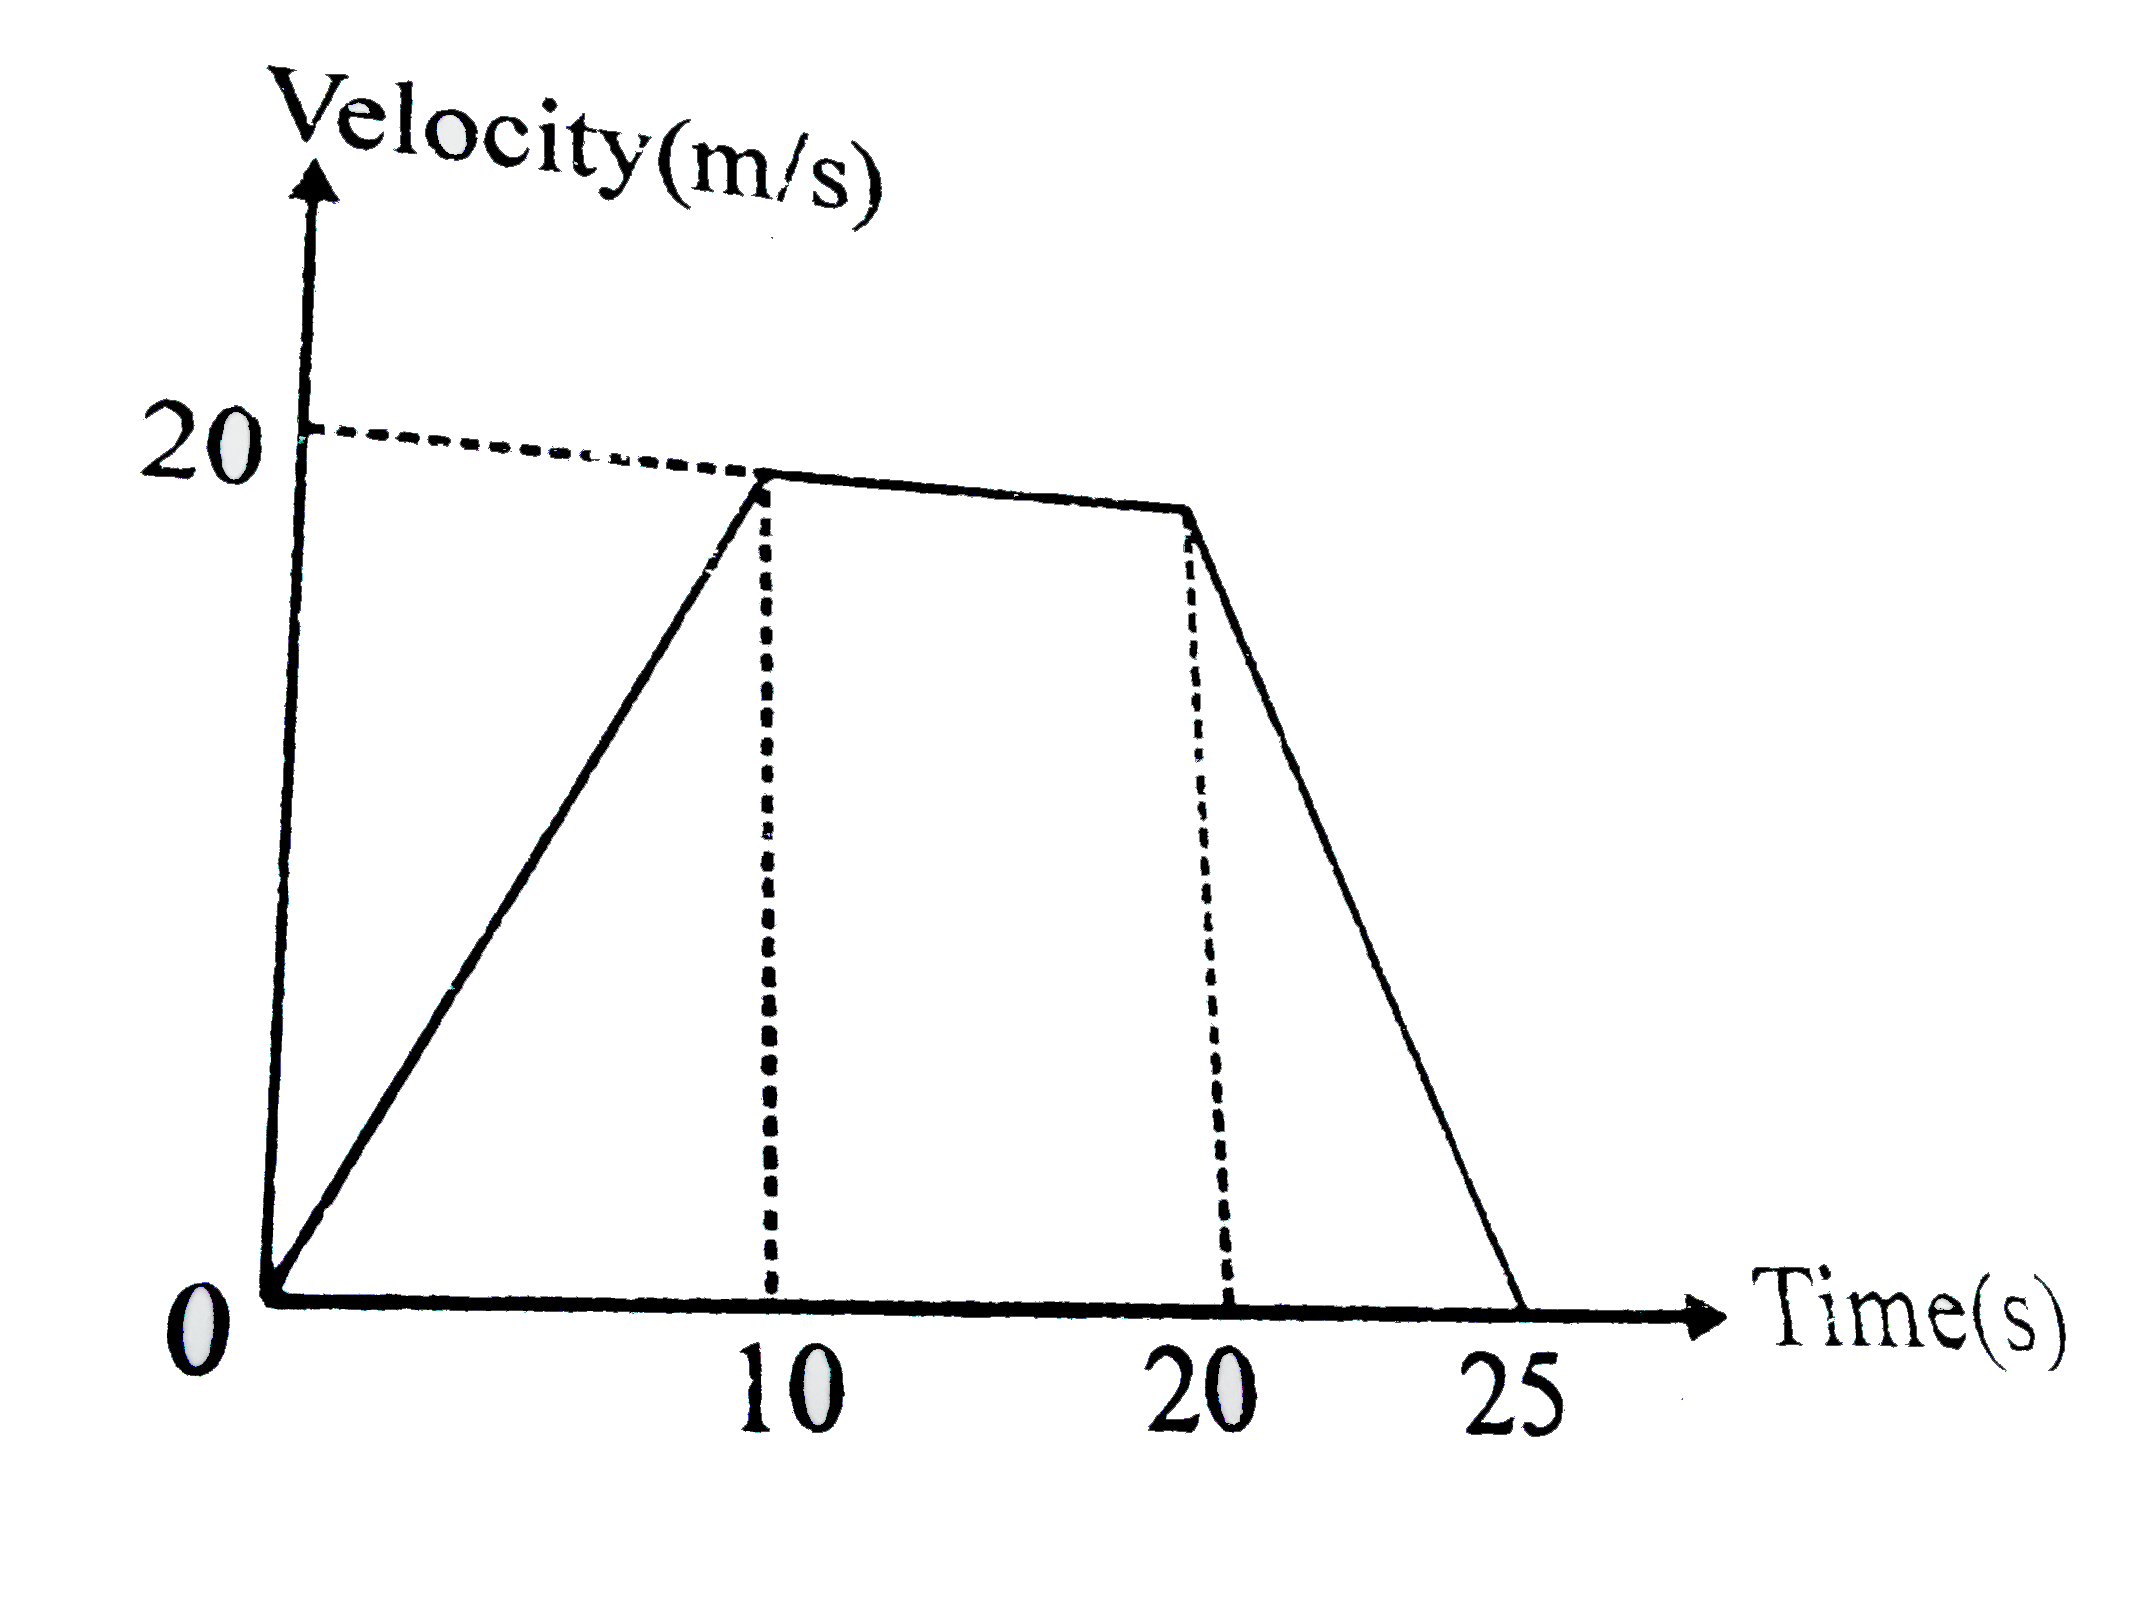
View SolutionThe velocity-time graph of a car moving along a straight road is shown in figure. The average velocity of the car in first 25 seconds is
View Solution

