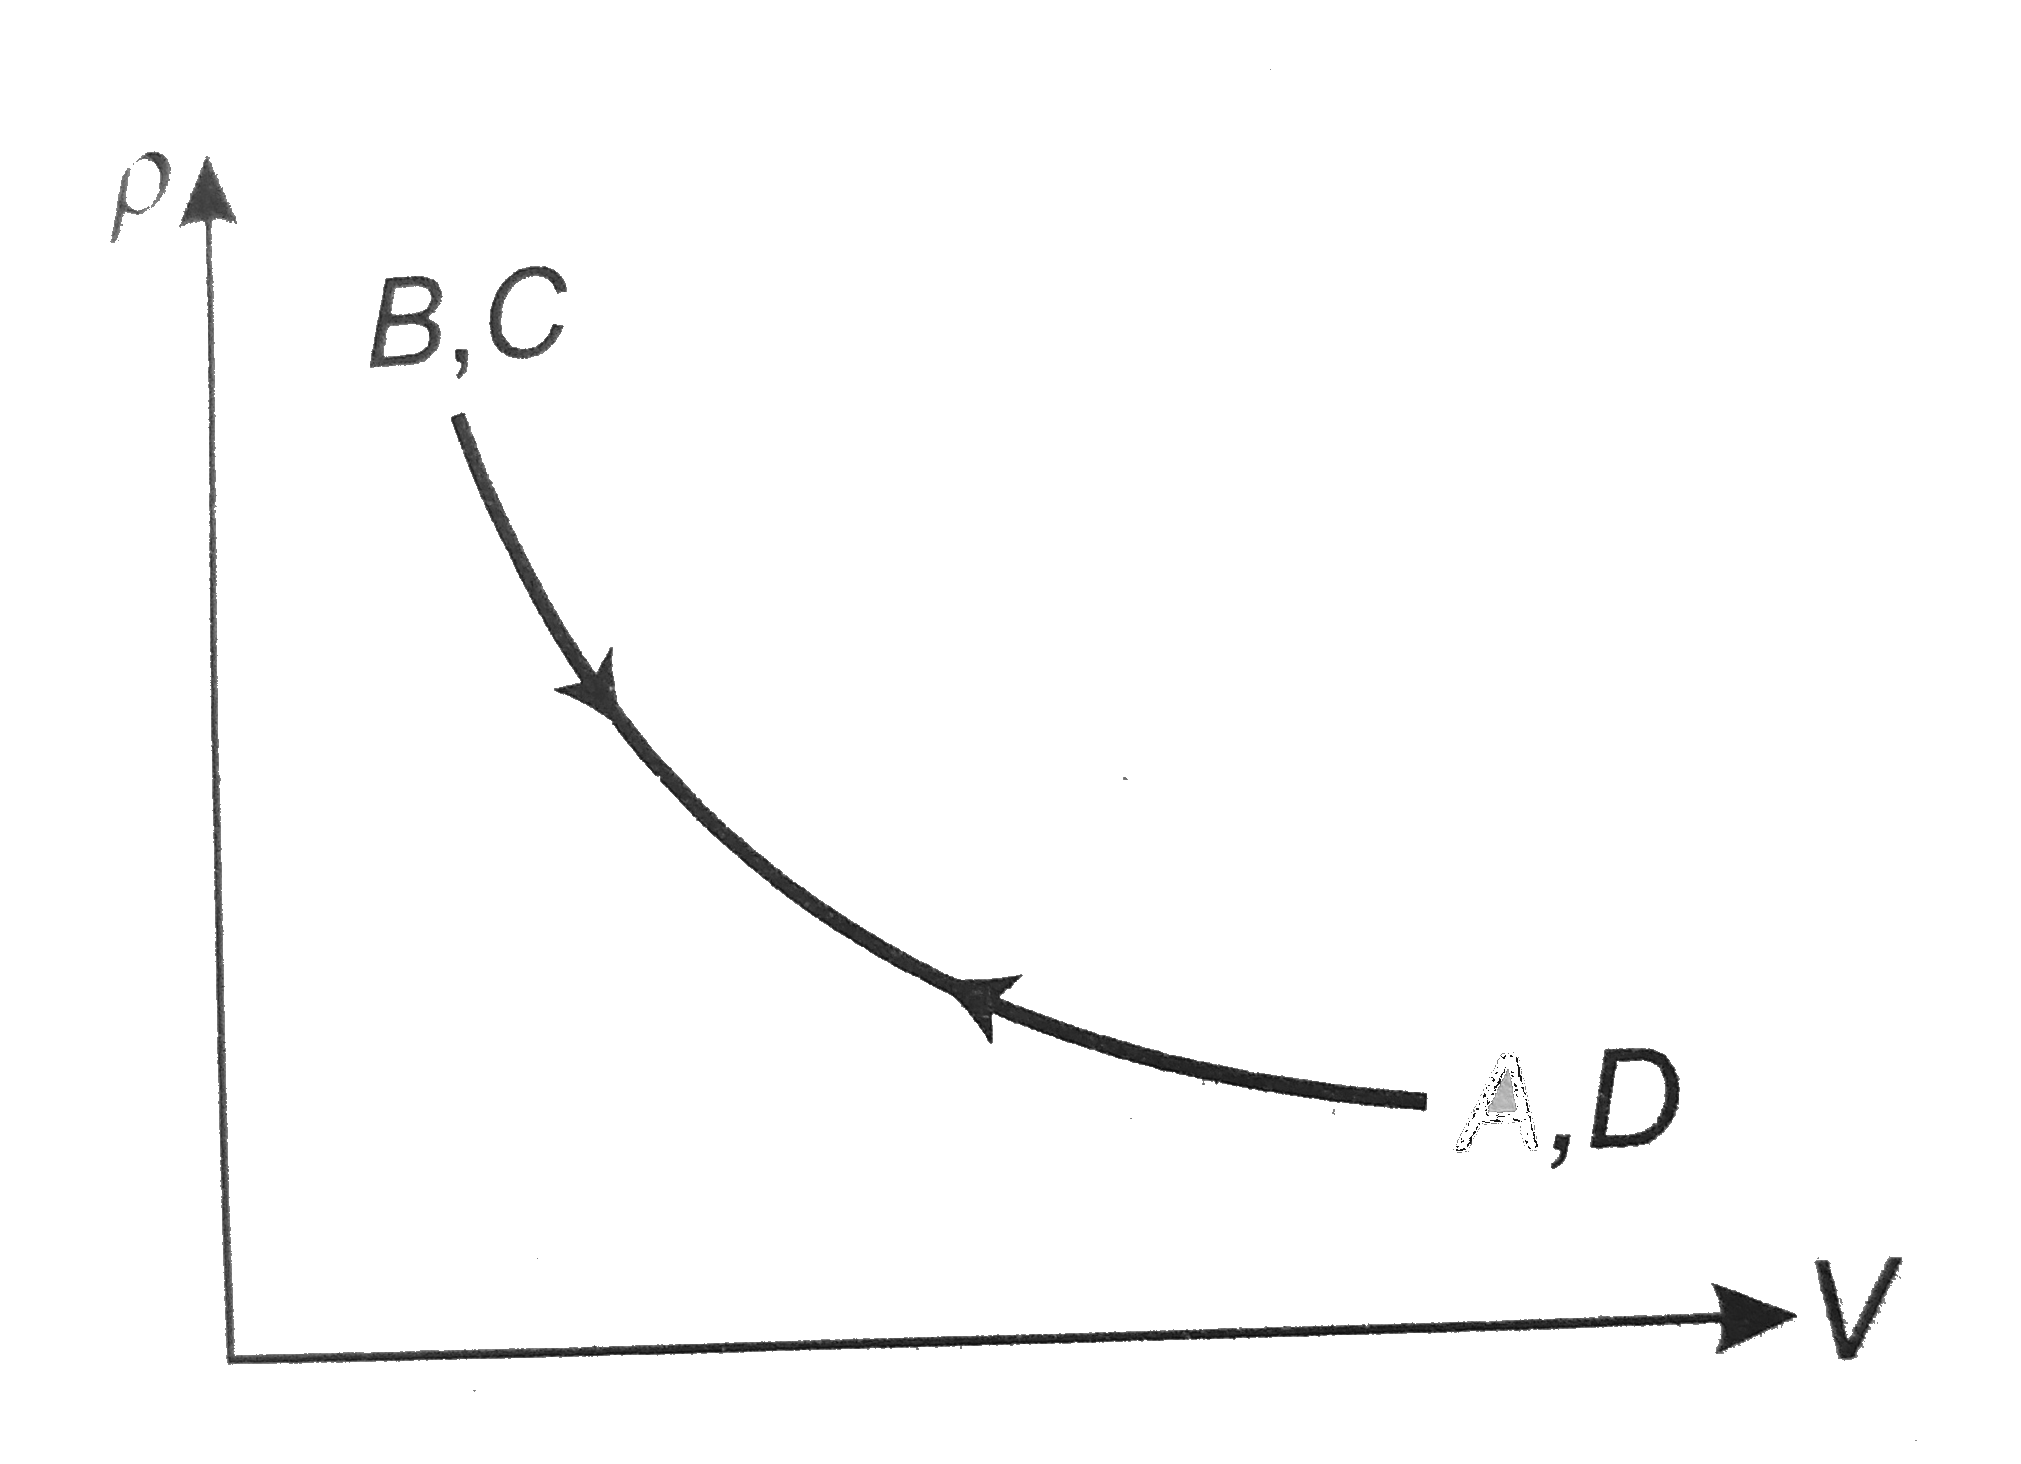
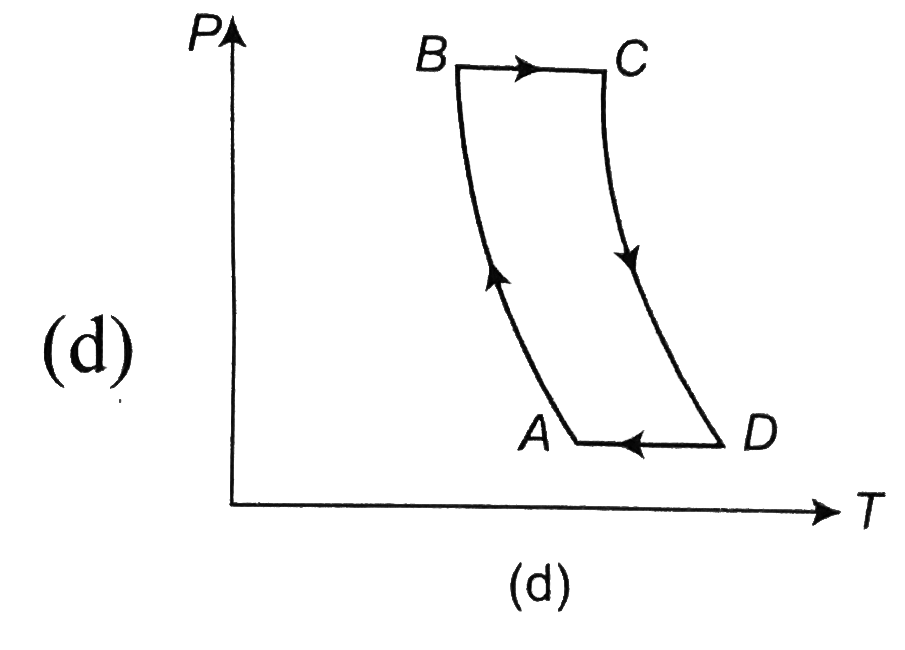
Density vs volume graph is shown in the figure. Find corresponding pressure vs temperature graph
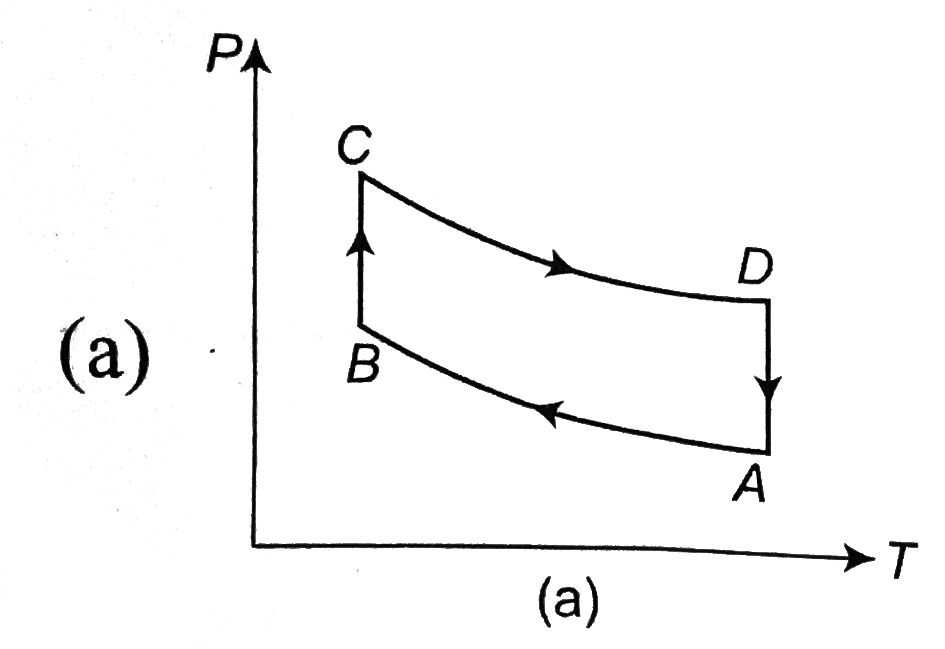
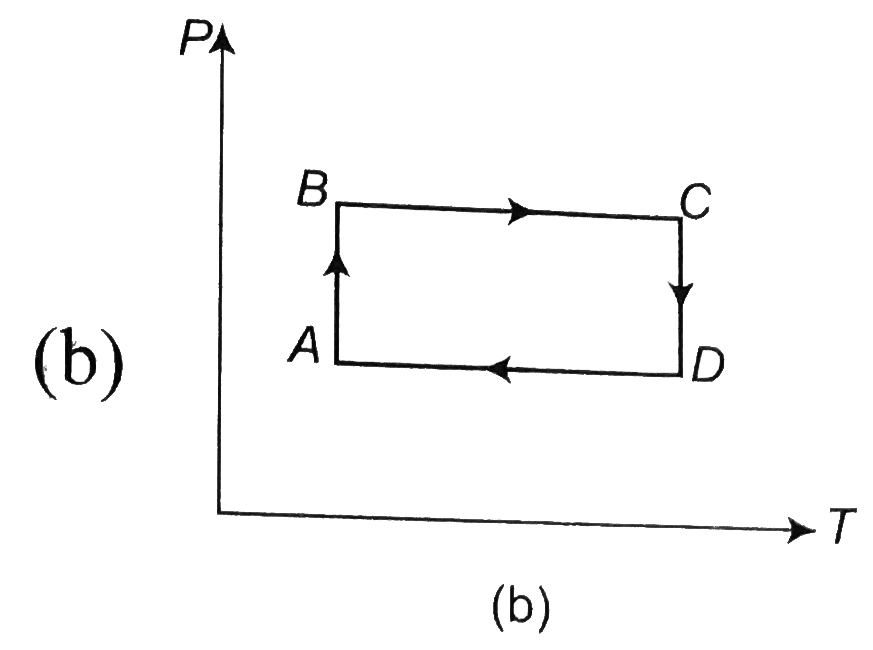
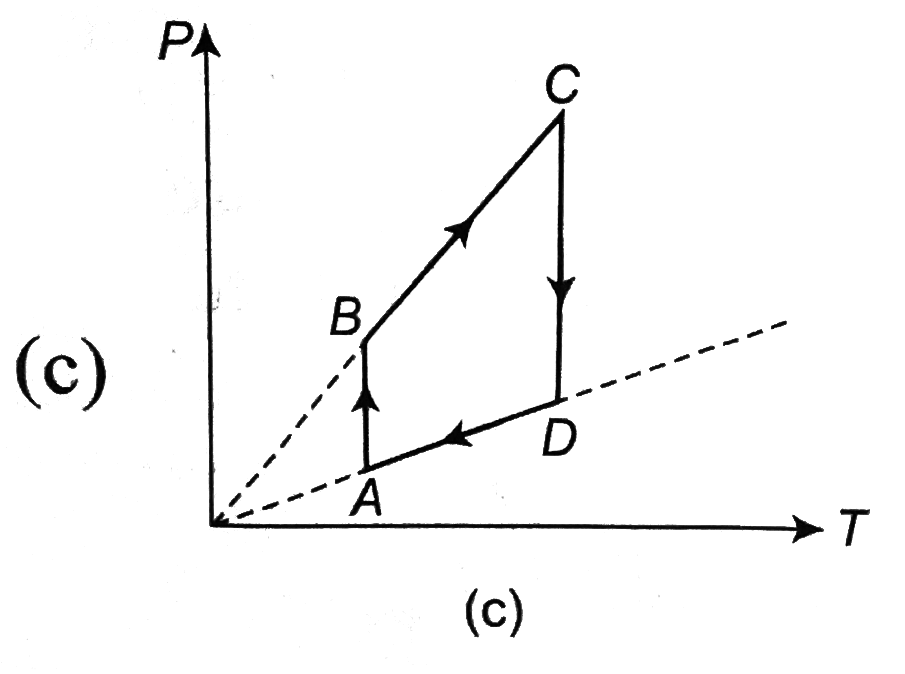
The correct Answer is:C
press∝1V in the preocess AB.
(V decrease, ρ increases)
In isothermal process (T = constant), ρ∝1V
As V decreases, P increases.
so, the ρ increase, V decrease (ρV curve) and P increase for V decrease (P−T curve)
Options (b) and (c) may be correct.
But process B−C is shown by a dot in (ρ−V) curve.
It means BC is a isochoric process.
Process BC in option (c) is a isochoric process because P∝T.
Topper's Solved these Questions
- KINETIC THEORY OF GASES AND THERMODYNAMICSBOOK - A2ZCHAPTER - KINETIC THEORY OF GASES AND THERMODYNAMICSEXERCISE - First Law Of Thermodynamics , Internal Energy And Work Done
55 Videos
- KINETIC THEORY OF GASES AND THERMODYNAMICSBOOK - A2ZCHAPTER - KINETIC THEORY OF GASES AND THERMODYNAMICSEXERCISE - Application Of First Law Of Thermodynamics In Different Situations
25 Videos
- KINETIC THEORY OF GASES AND THERMODYNAMICSBOOK - A2ZCHAPTER - KINETIC THEORY OF GASES AND THERMODYNAMICSEXERCISE - Chapter Test
29 Videos
- GRAVITATIONBOOK - A2ZCHAPTER - GRAVITATIONEXERCISE - Chapter Test
29 Videos
- MOCK TESTBOOK - A2ZCHAPTER - MOCK TESTEXERCISE - Motion With Constant Acceleration
15 Videos
Similar Questions
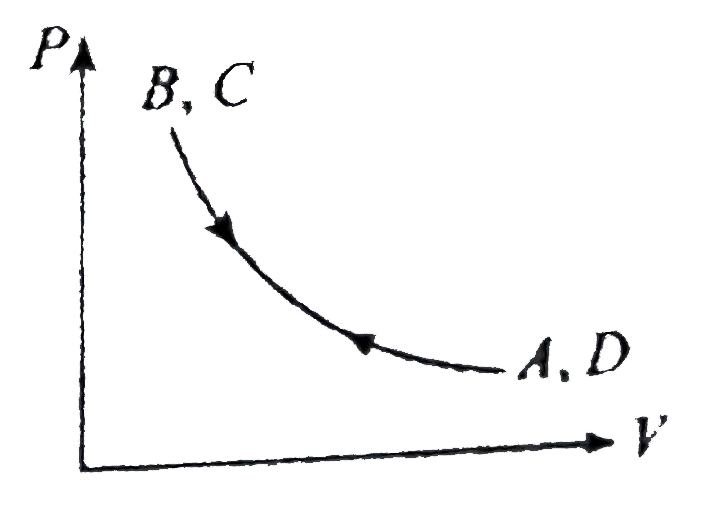
Pressure vs volume graph is shown in the figure . Find corresponding pressure vs temperature graph :
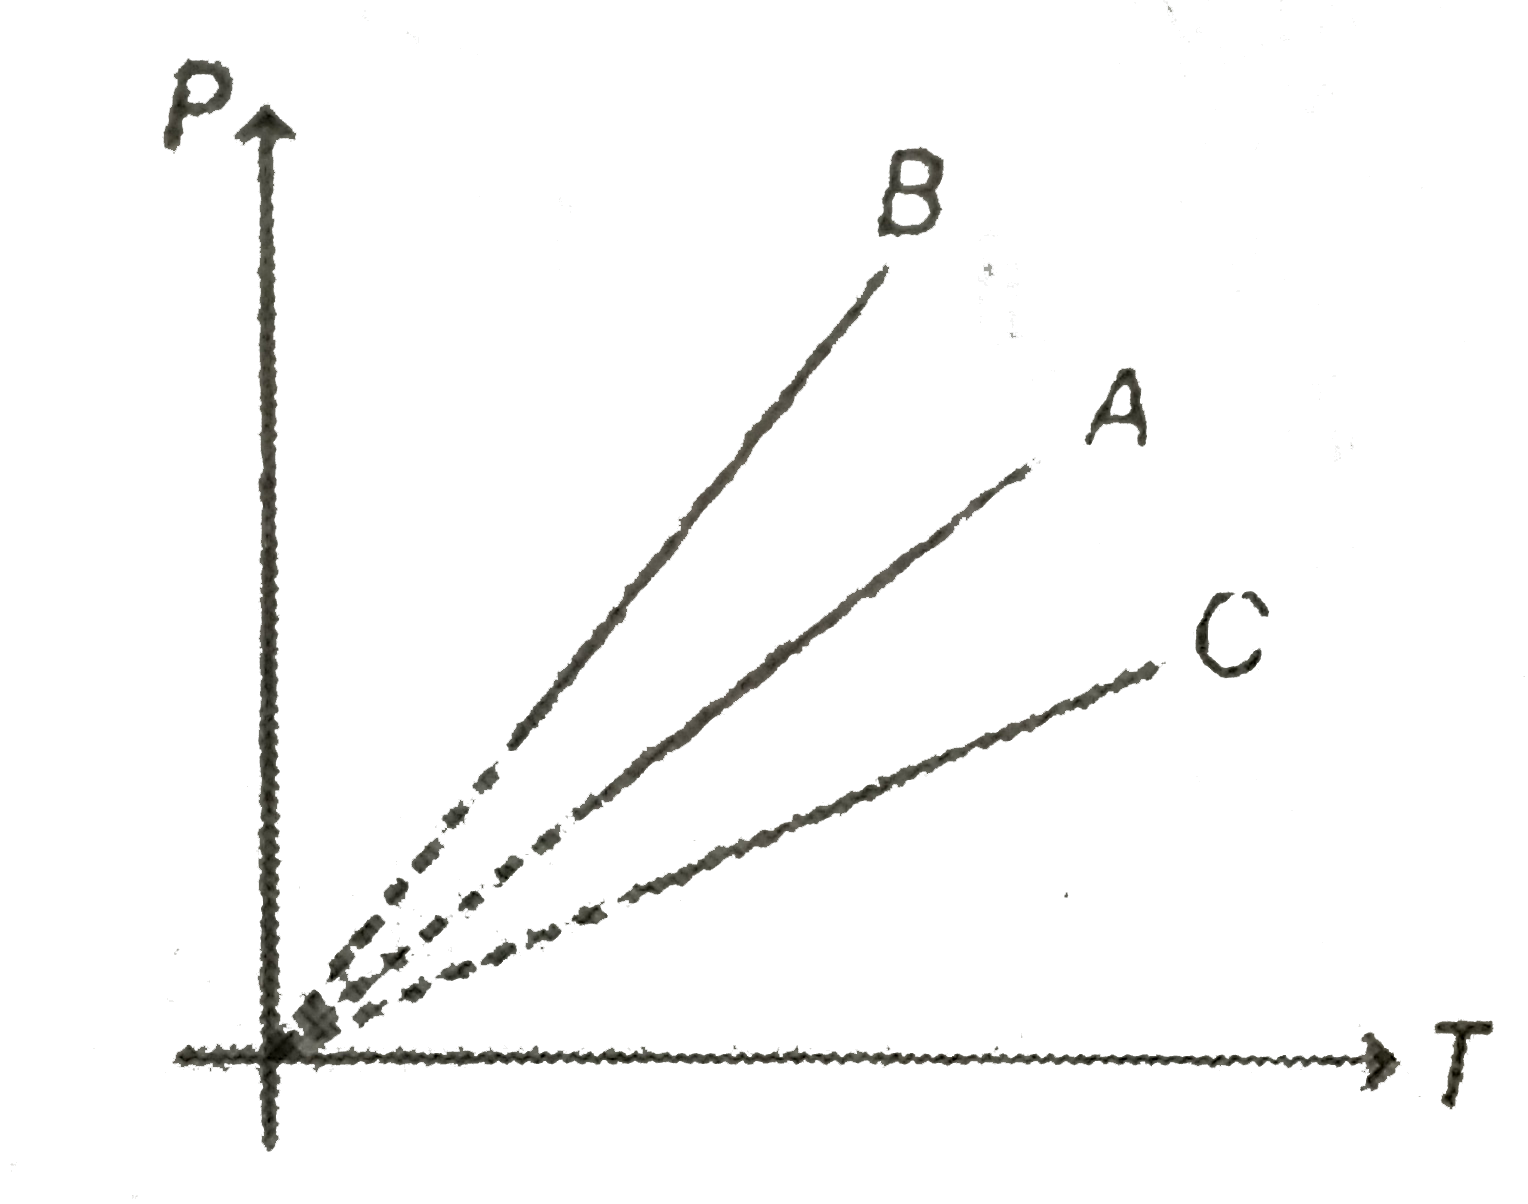
View SolutionPressure versus temperature graph of an ideal gas at constant volume V is shown by the straight line A. Now mass of the gas is doubled and the volume is halved, then the corresponding pressure versus temperature graph will be shown by the line
View Solution
Knowledge Check
Pressure versus temperature graph of an ideal gas at constant volume V is shown by the straight line A. Now mass of the has is doubled and the volume is halved, then the corresponding pressure versus temperature graph will be shown by the line
 AABBCCDNone of these
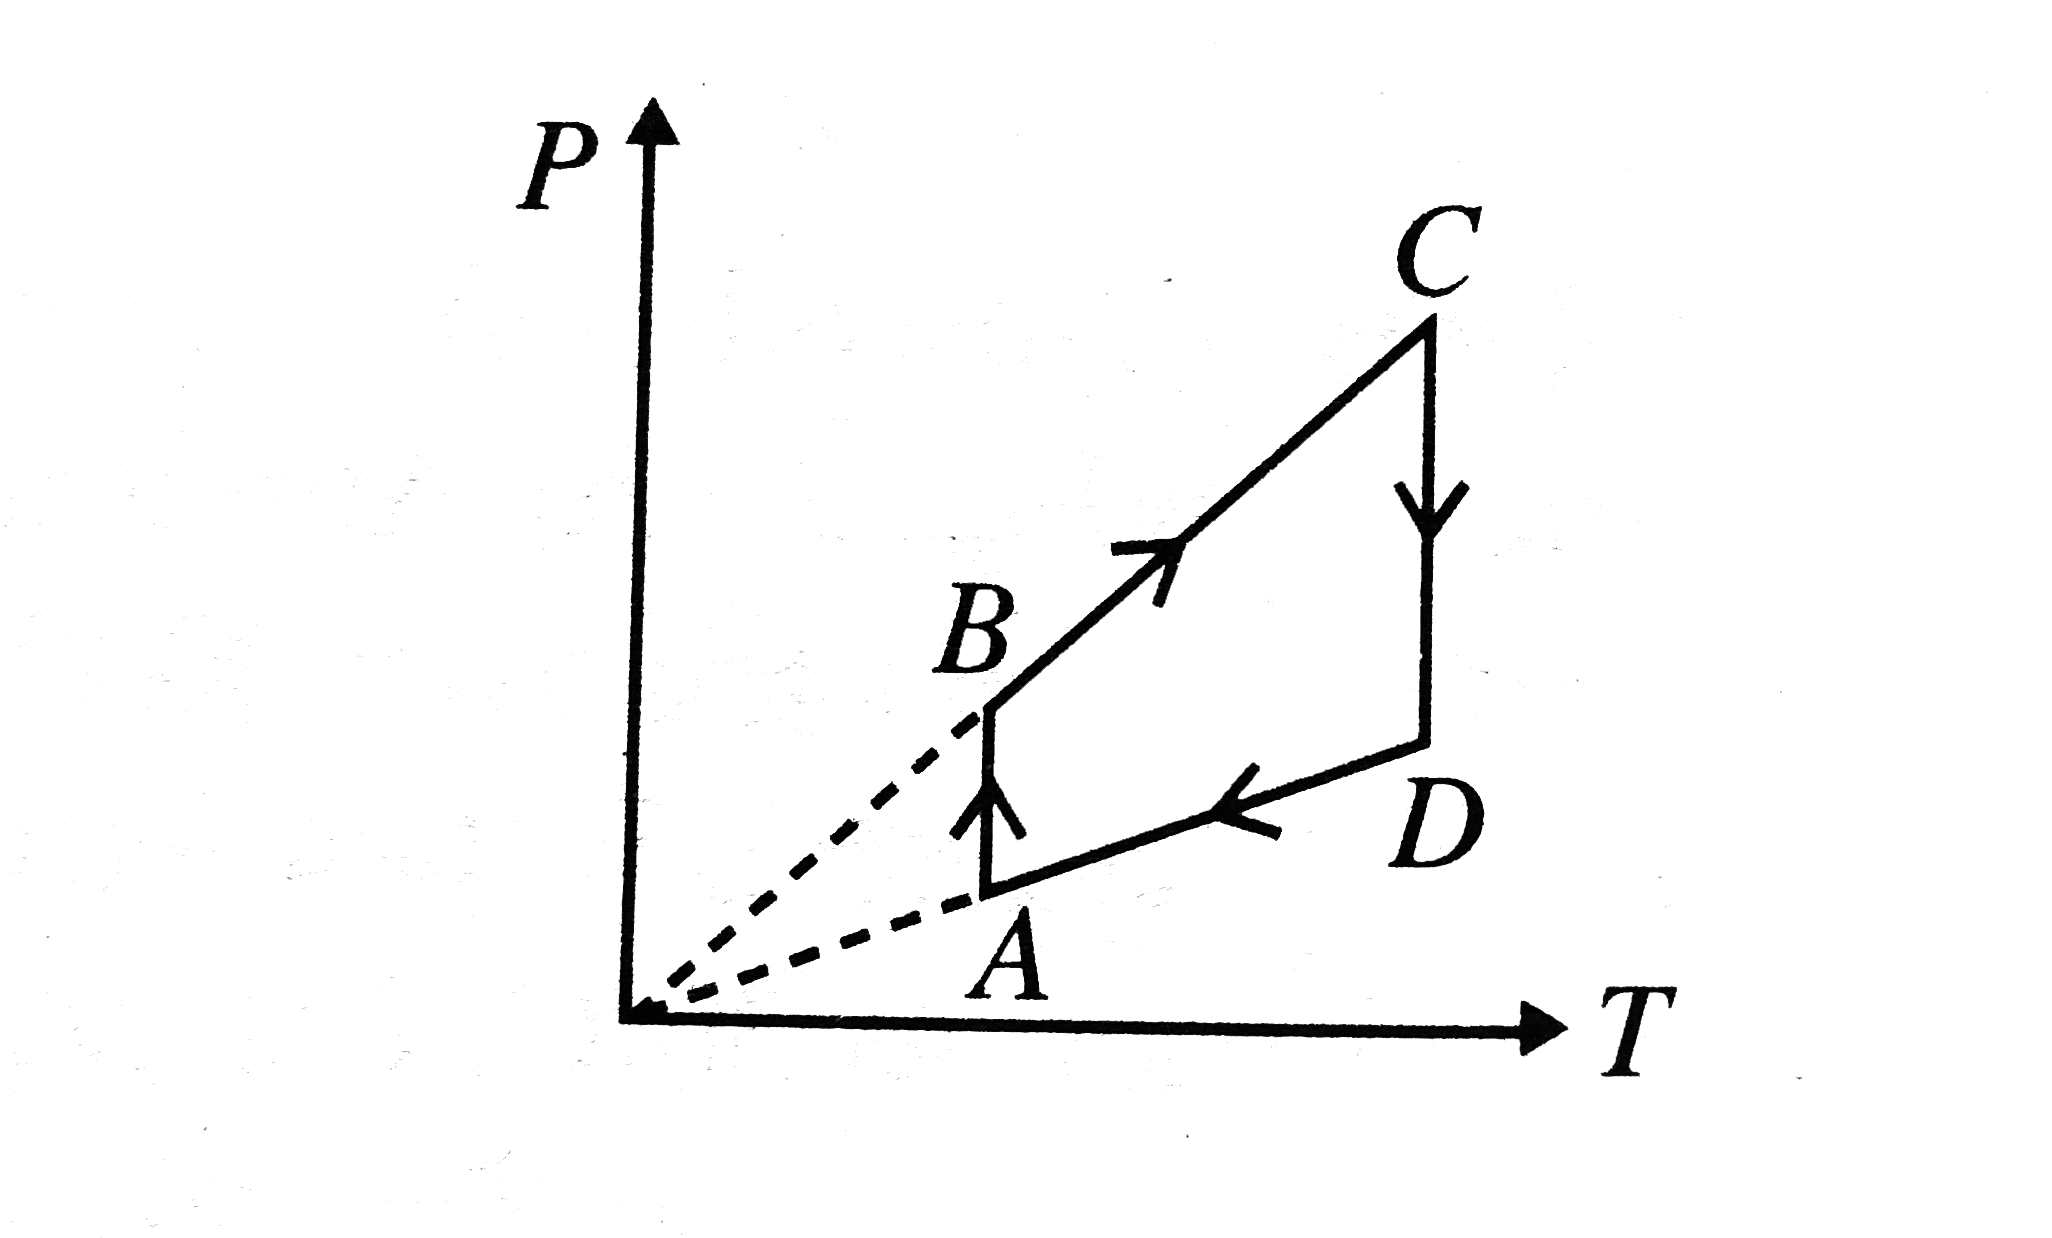
Pressure versus temperature graph of an ideal gas as shown in Fig.
Corresponding density (ρ) versus volume (V) graph will be
 A
A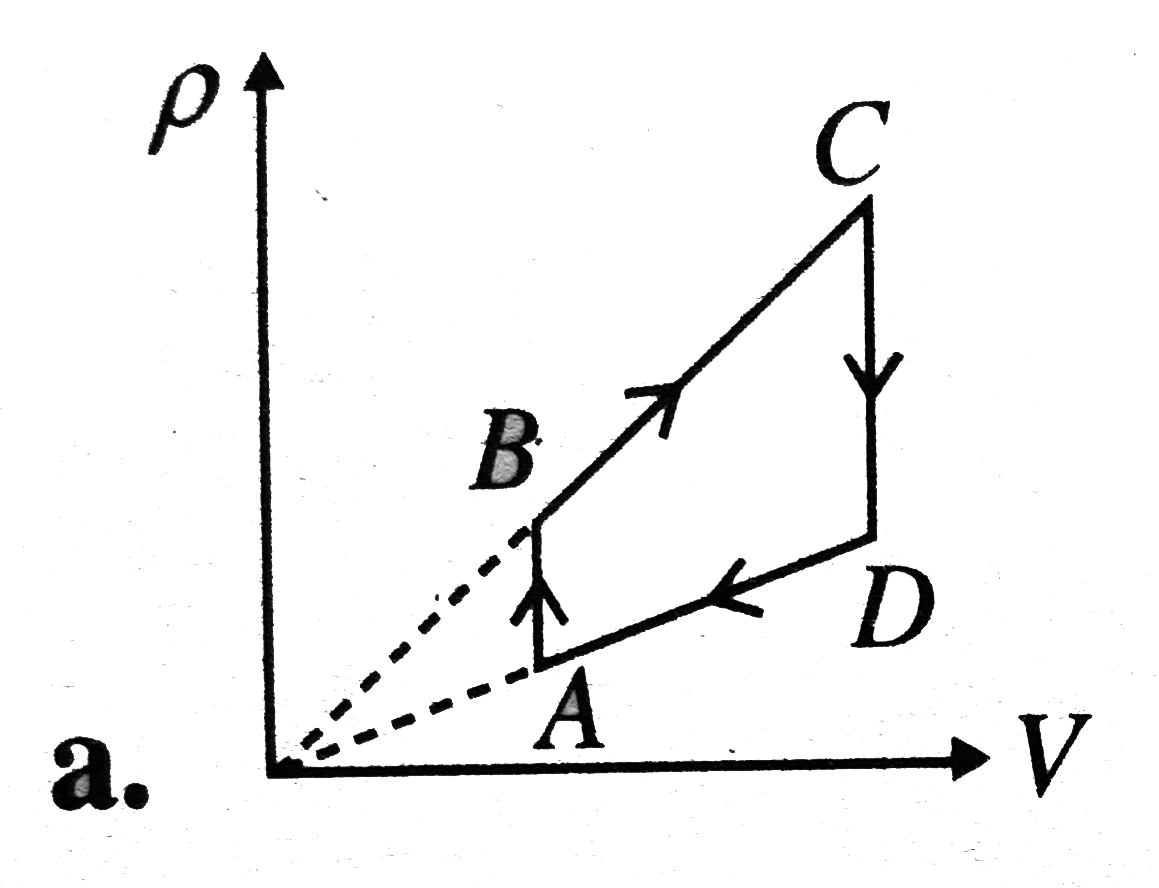 B
B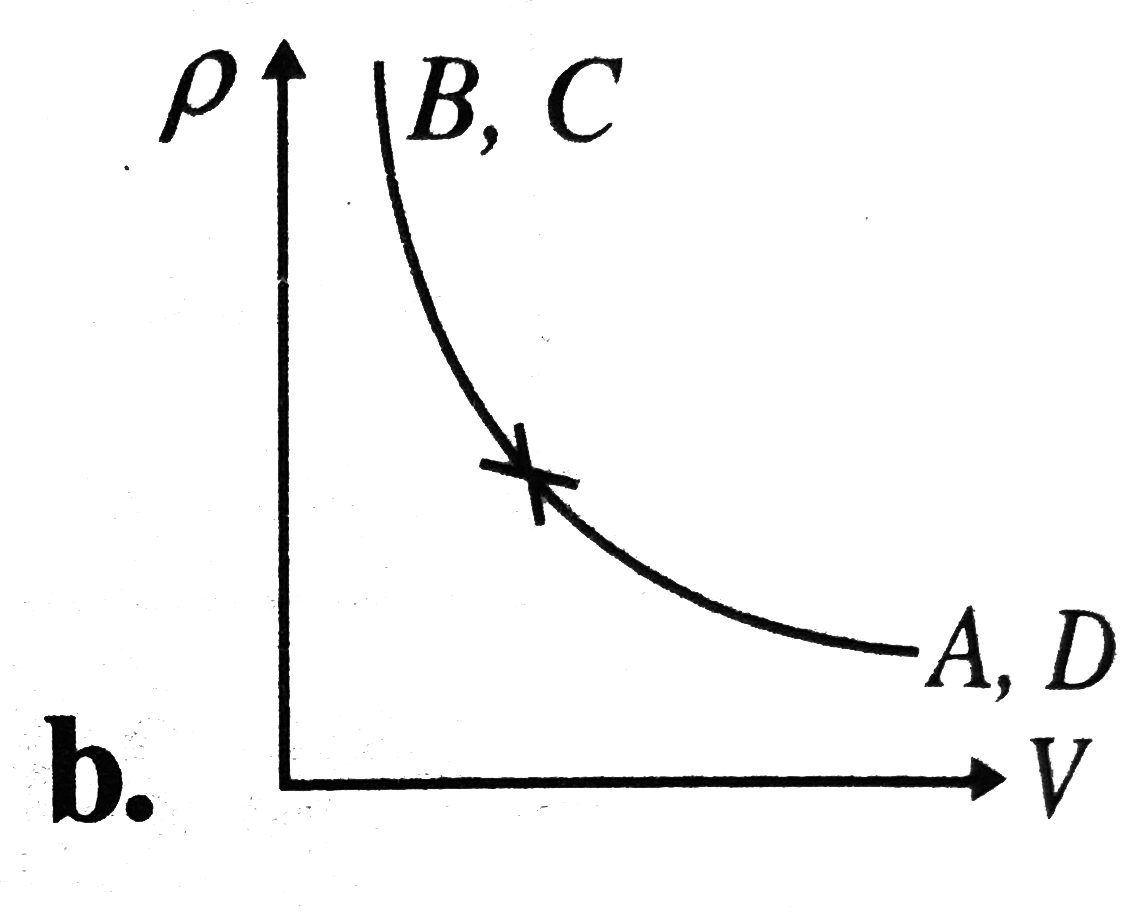 C
C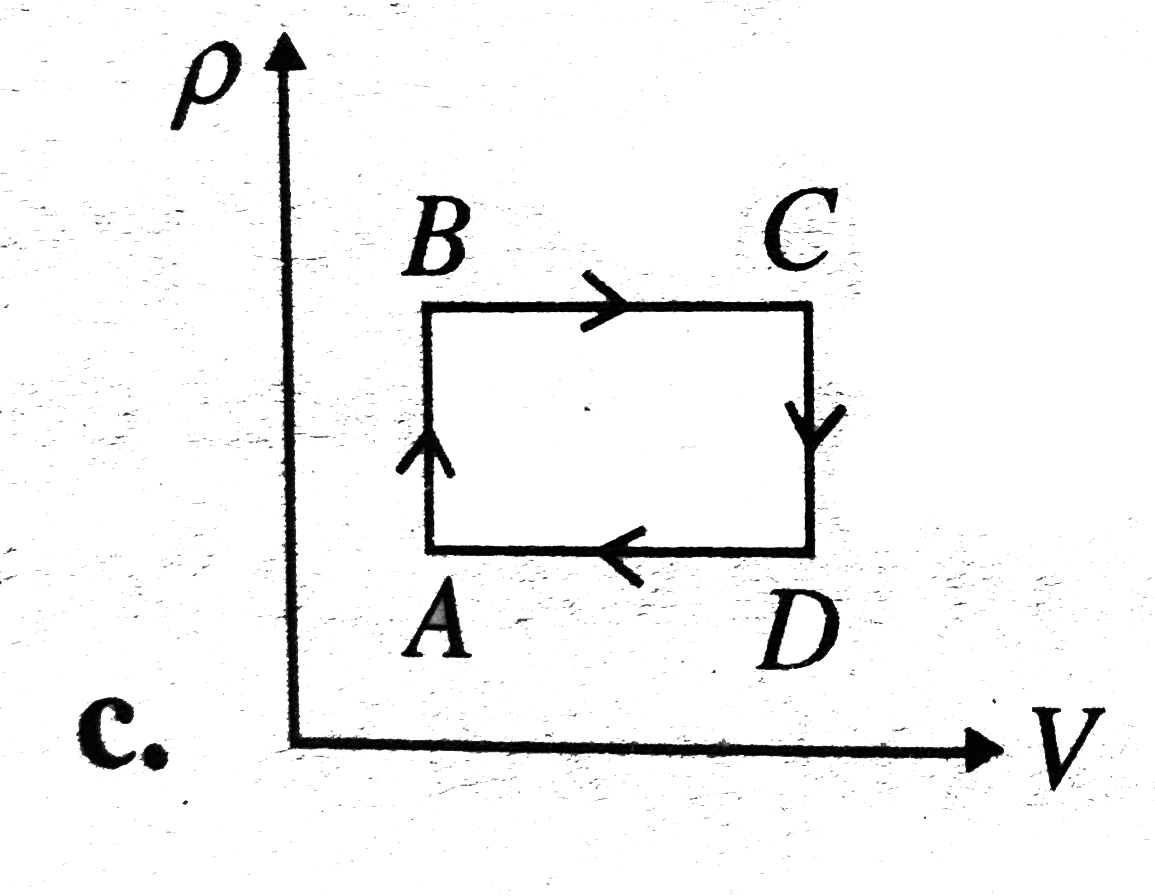 D
D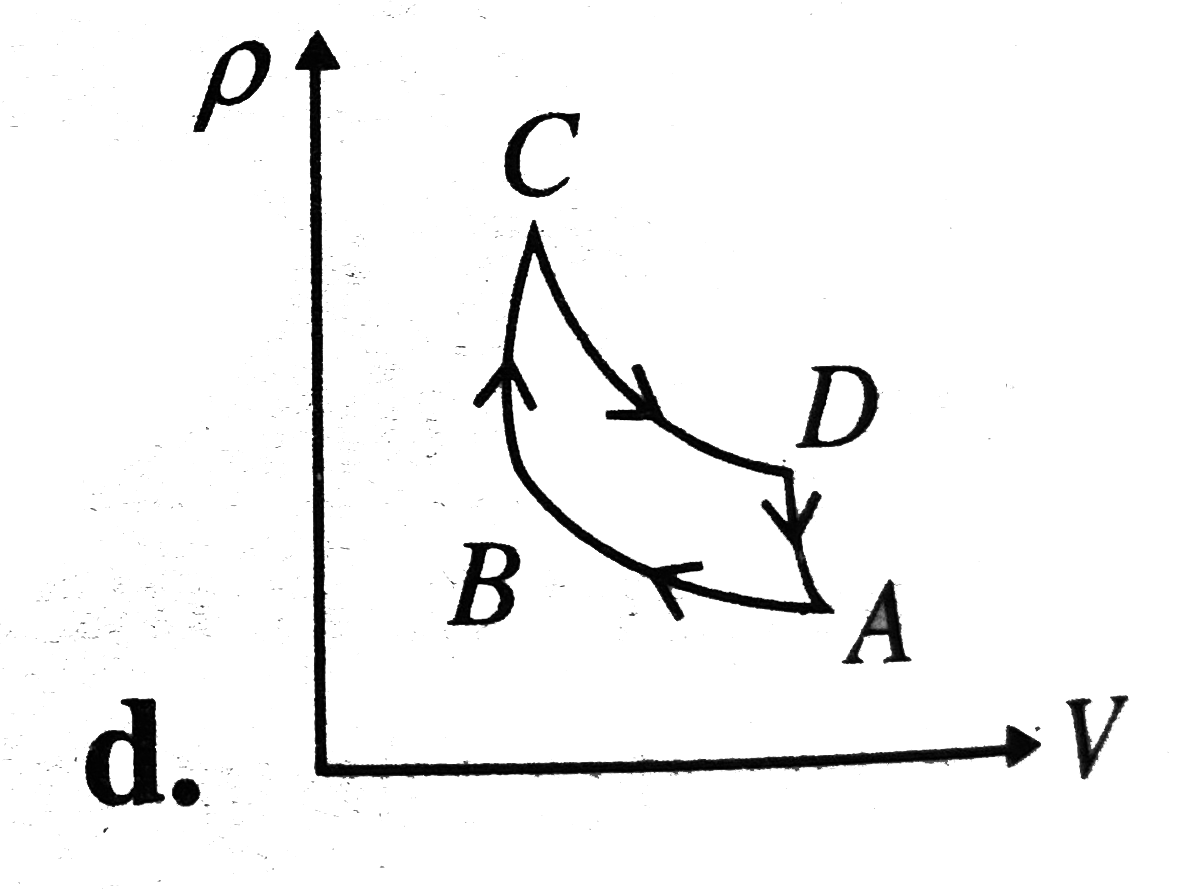
The graph of displacement vs time for a particle moving along a straight line is as shown. The best option for the corresponding velocity - time graph will be:
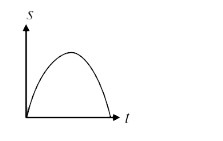 A
A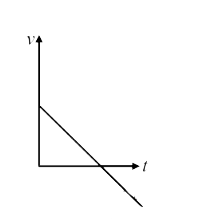 B
B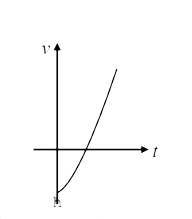 C
C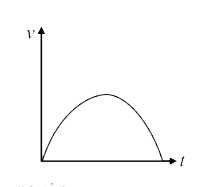 D
D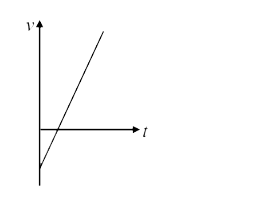
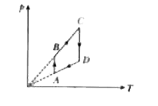
Pressure temperature (p-1) graph of n moles of an ideal gas is shown in the figure. Among the following four graphs, which are the corresponding pressure volume (p-V) and density pressure (p-p) graphs?
View SolutionPressure versus temperature graph of an ideal gas as shown in Fig.
Corresponding density (ρ) versus volume (V) graph will be

View SolutionPressure versus temperature graph of an ideal gas as shown in Fig.
Corresponding density (ρ) versus volume (V) graph will be

View Solution
Using the graph shown in the figure for stopping potential vs. the incident frequency of photons, calculate Planck.s constant.
View SolutionThe graph of displacement vs time for a particle moving along a straight line is as shown. The best option for the corresponding velocity - time graph will be:

View Solution
