In which of these diagrams, the density of an ideal gas remains constant?
The correct Answer is:D
To determine in which diagram the density of an ideal gas remains constant, we can analyze the relationships between pressure (P), volume (V), temperature (T), and density (ρ) using the ideal gas law and the derived relationships.
1. Understanding the Ideal Gas Law:
The ideal gas law is given by the equation:
PV=nRT
where n is the number of moles, R is the universal gas constant, and T is the temperature in Kelvin.
2. Expressing Density:
The density (ρ) of the gas can be expressed in terms of mass (m) and volume (V):
ρ=mV
From the ideal gas law, we can express the number of moles n as:
n=mM
where M is the molar mass. Substituting this into the ideal gas law gives:
PV=mMRT
Rearranging this, we can express density as:
ρ=PMRT
3. Analyzing Each Diagram:
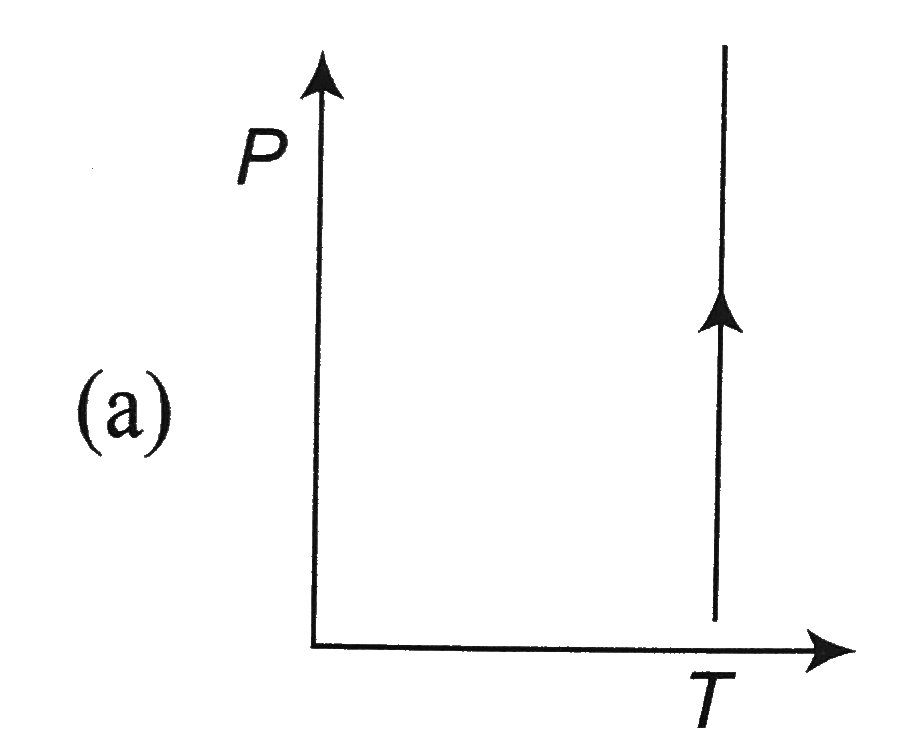
- Diagram 1: Constant temperature (T) with increasing pressure (P).
- Since T is constant, as P increases, ρ will also increase. Thus, density is not constant.
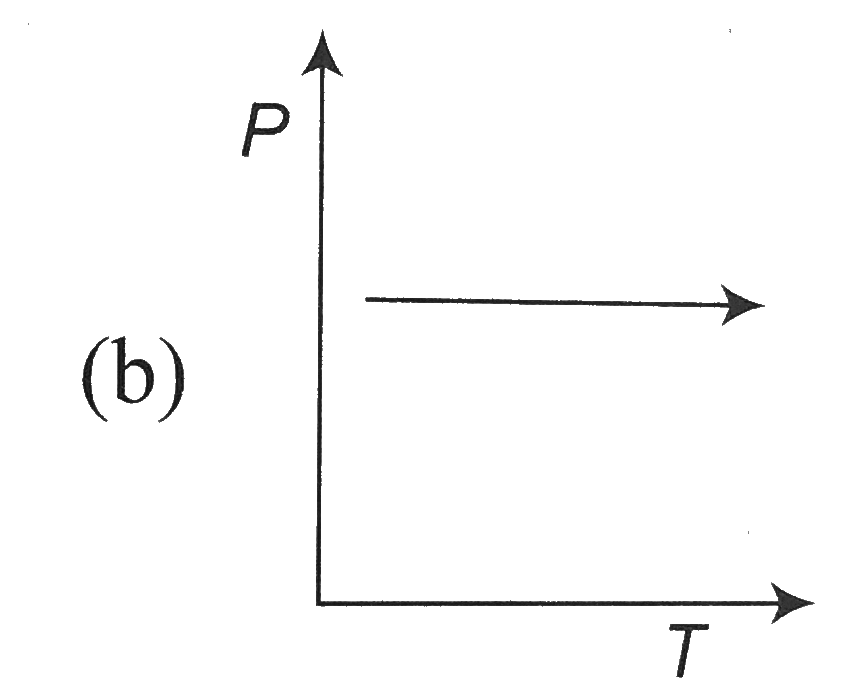
- Diagram 2: Constant pressure (P) with increasing temperature (T).
- As T increases, ρ will decrease. Thus, density is not constant.
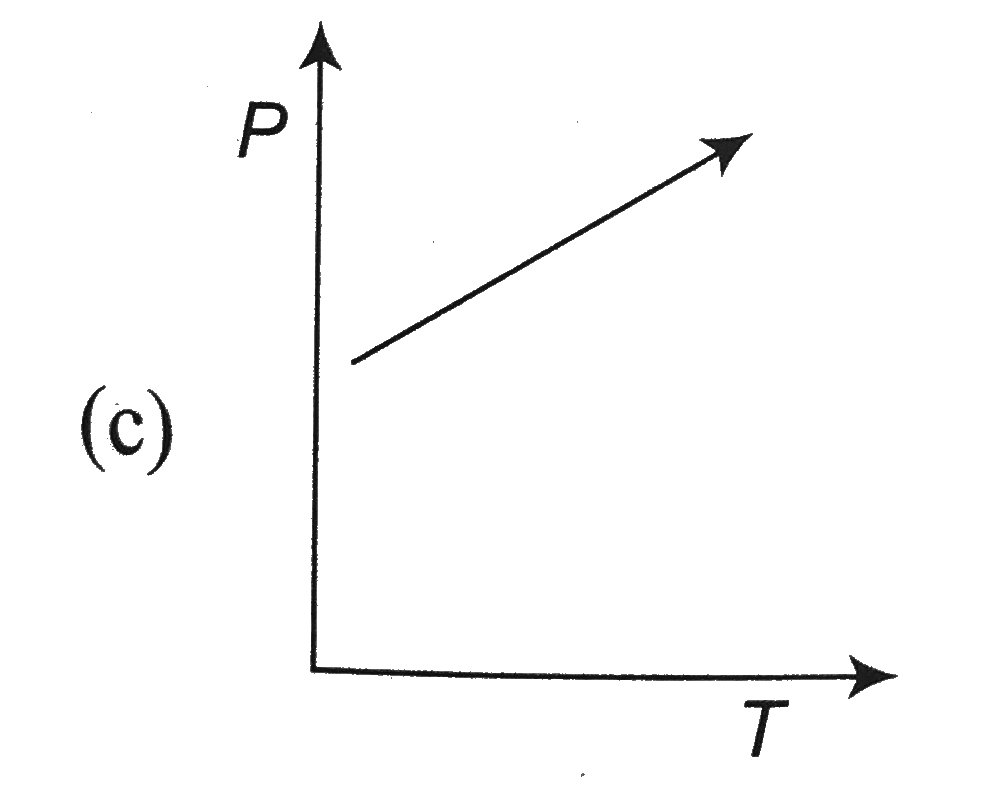
- Diagram 3: Both pressure (P) and temperature (T) are increasing.
- Here, the relationship is more complex. However, if both P and T increase proportionally, the density can vary. Thus, density is not constant.
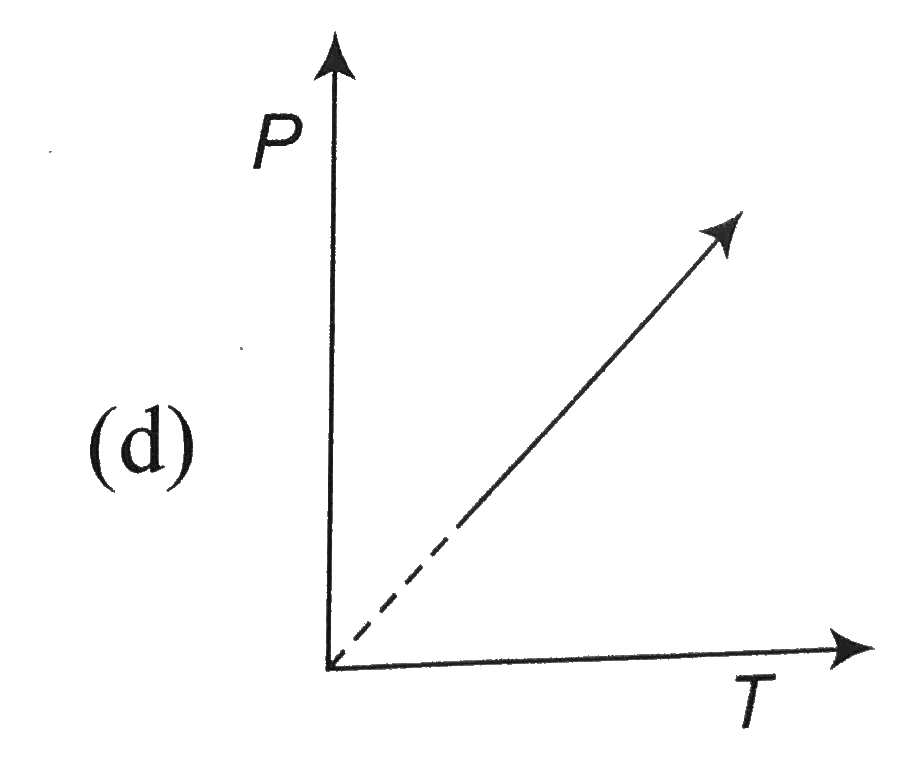
- Diagram 4: Pressure (P) is directly proportional to temperature (T) with no intercept.
- In this case, if P increases, T also increases proportionally, keeping the ratio PT constant. Therefore, the density ρ remains constant.
4. Conclusion:
The density of the ideal gas remains constant in Diagram 4.
Final Answer:
The density of the ideal gas remains constant in Diagram 4.
The ideal gas law is given by the equation:
PV=nRT
where n is the number of moles, R is the universal gas constant, and T is the temperature in Kelvin.
The density (ρ) of the gas can be expressed in terms of mass (m) and volume (V):
ρ=mV
From the ideal gas law, we can express the number of moles n as:
n=mM
where M is the molar mass. Substituting this into the ideal gas law gives:
PV=mMRT
Rearranging this, we can express density as:
ρ=PMRT
- Diagram 1: Constant temperature (T) with increasing pressure (P).
- Since T is constant, as P increases, ρ will also increase. Thus, density is not constant.
- Diagram 2: Constant pressure (P) with increasing temperature (T).
- As T increases, ρ will decrease. Thus, density is not constant.
- Diagram 3: Both pressure (P) and temperature (T) are increasing.
- Here, the relationship is more complex. However, if both P and T increase proportionally, the density can vary. Thus, density is not constant.
- Diagram 4: Pressure (P) is directly proportional to temperature (T) with no intercept.
- In this case, if P increases, T also increases proportionally, keeping the ratio PT constant. Therefore, the density ρ remains constant.
The density of the ideal gas remains constant in Diagram 4.
The density of the ideal gas remains constant in Diagram 4.
Topper's Solved these Questions
- KINETIC THEORY OF GASES AND THERMODYNAMICSBOOK - A2ZCHAPTER - KINETIC THEORY OF GASES AND THERMODYNAMICSEXERCISE - First Law Of Thermodynamics , Internal Energy And Work Done
55 Videos
- KINETIC THEORY OF GASES AND THERMODYNAMICSBOOK - A2ZCHAPTER - KINETIC THEORY OF GASES AND THERMODYNAMICSEXERCISE - Application Of First Law Of Thermodynamics In Different Situations
25 Videos
- KINETIC THEORY OF GASES AND THERMODYNAMICSBOOK - A2ZCHAPTER - KINETIC THEORY OF GASES AND THERMODYNAMICSEXERCISE - Chapter Test
29 Videos
- GRAVITATIONBOOK - A2ZCHAPTER - GRAVITATIONEXERCISE - Chapter Test
29 Videos
- MOCK TESTBOOK - A2ZCHAPTER - MOCK TESTEXERCISE - Motion With Constant Acceleration
15 Videos
Similar Questions
Knowledge Check
In which of these diagrams, the density of an ideal gas remains constant?
A B
B C
C D
D
At a constant pressure, of the following graphs that one which represents the variation of the density of an ideal gas with the absolute temperature T, is
A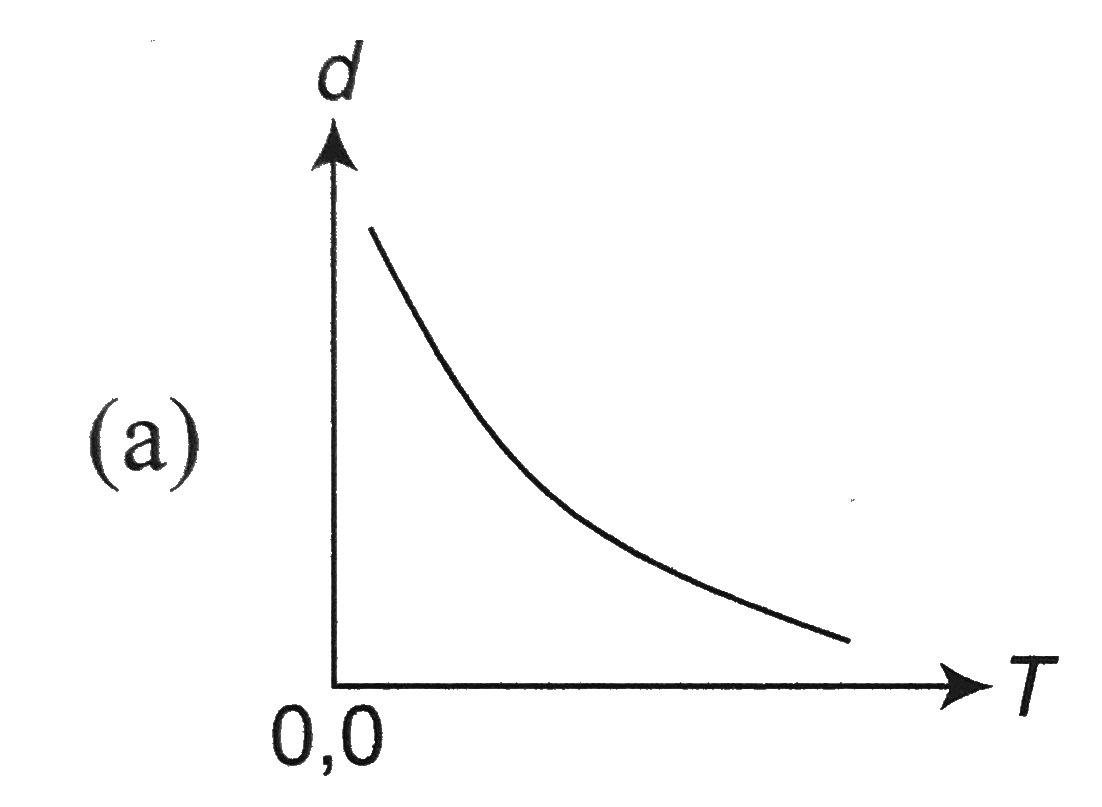 B
B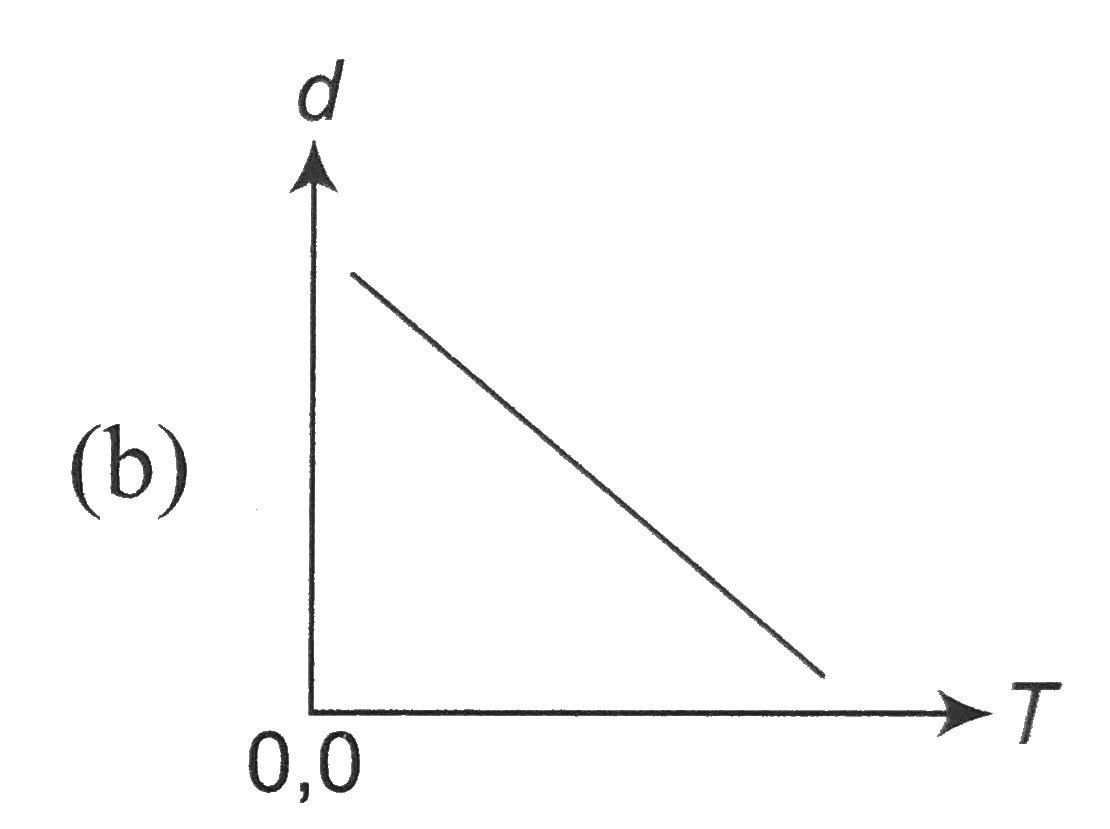 C
C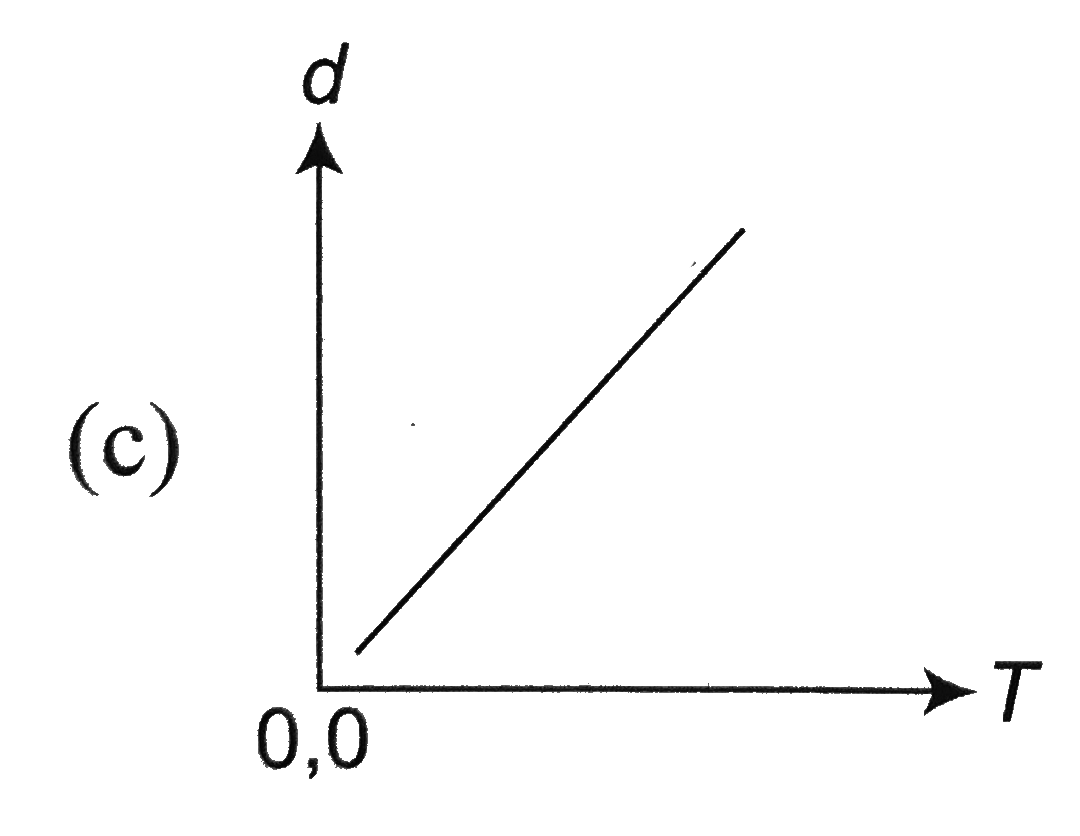 D
D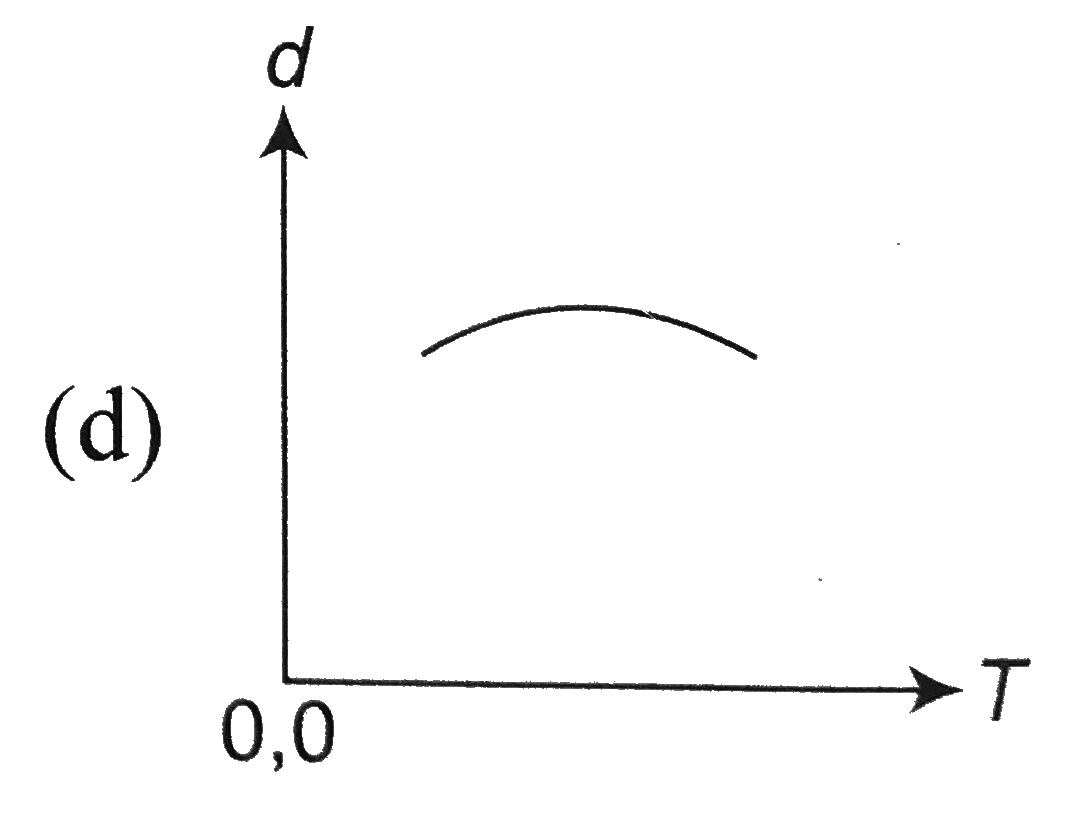
At a given temperature, the density of an ideal gas is proportional to
Ap2BpC√pD1/p
In a process the density of a gas remains constant. If the temperature is doubled, then the change in the pressure will be :-
View SolutionWhich of the following diagrams, Fig. depicts ideal gas behaviour ?
View SolutionAt constant pressure what would be the percentage decrease in the density of an ideal gas for a 10% increase in the temperature.
View SolutionStatement-1.During isothermal expansion of an ideal gas, there is no change in the internal energy.
Statement -2.During isothermal expansion of an ideal gas , as temperature remains constant, no heat enters or leaves the system.
View SolutionThe bulk modulus of an ideal gas at constant temperature
View Solution
