Draw a curve showing density or pressure variations with respect to distance for a disturbance produced by sound. Mark the position of compression and rarefaction on this curve. Also define wavelengths and time period using this curve.
Step by step video & image solution for Draw a curve showing density or pressure variations with respect to distance for a disturbance produced by sound. Mark the position of compression and rarefaction on this curve. Also define wavelengths and time period using this curve. by Physics experts to help you in doubts & scoring excellent marks in Class 9 exams.
Topper's Solved these Questions
- BOOK - PRADEEPCHAPTER - SOUNDEXERCISE - Mock Test (Sec - B)12videos
SOUND
- BOOK - PRADEEPCHAPTER - SOUNDEXERCISE - Model Test (sec - A)24videos
SOUND
- BOOK - PRADEEPCHAPTER - SOUNDEXERCISE - (Assessment) Multiple choice20videos
SOUND
- BOOK - PRADEEPCHAPTER - MOTIONEXERCISE - Mock test24videos
MOTION
- BOOK - PRADEEPCHAPTER - WORK AND ENERGYEXERCISE - III Quiz Testing10videos
WORK AND ENERGY
Similar Questions
Knowledge Check
- Question 1 - Select One
The curve showing the variation of adorpton with pressure at constant temperature is called :
Aan isosthermBadsorpton isothermCabsorption isothermDall of these - Question 2 - Select One
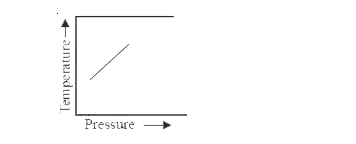
The curve showing the variation of pressure with temperature for a given amount of adsoption is called
 Aadsorption isobarBadsorption isothermCadsorption isotereDadsorption isochore
 - Question 3 - Select One
The curve showing the variation of pressure with temperature for a given amount of adsorption is called
Aadsorption isobarBadsorption isothermCadsorption isostereDadsorption isochore.
A source is producing 1500 sound waves in 3 seconds. If the distance covered by a compression and an adjacent rarefaction be 68 cm, find: (a) frequency, (b) wavelength, and (c) velocity, of the sound wave.
View SolutionFollowing curve shows the variation of intesity of gravitational field (→I) with distance from the centre of solid sphere(r) :
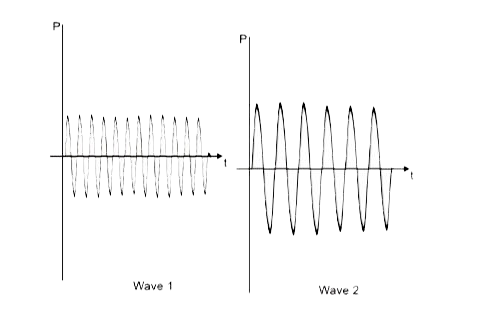
View SolutionThe figure below shows pressure variation in two different sound waves in air with time at a given position. Both the figures are drawn to the same scale.

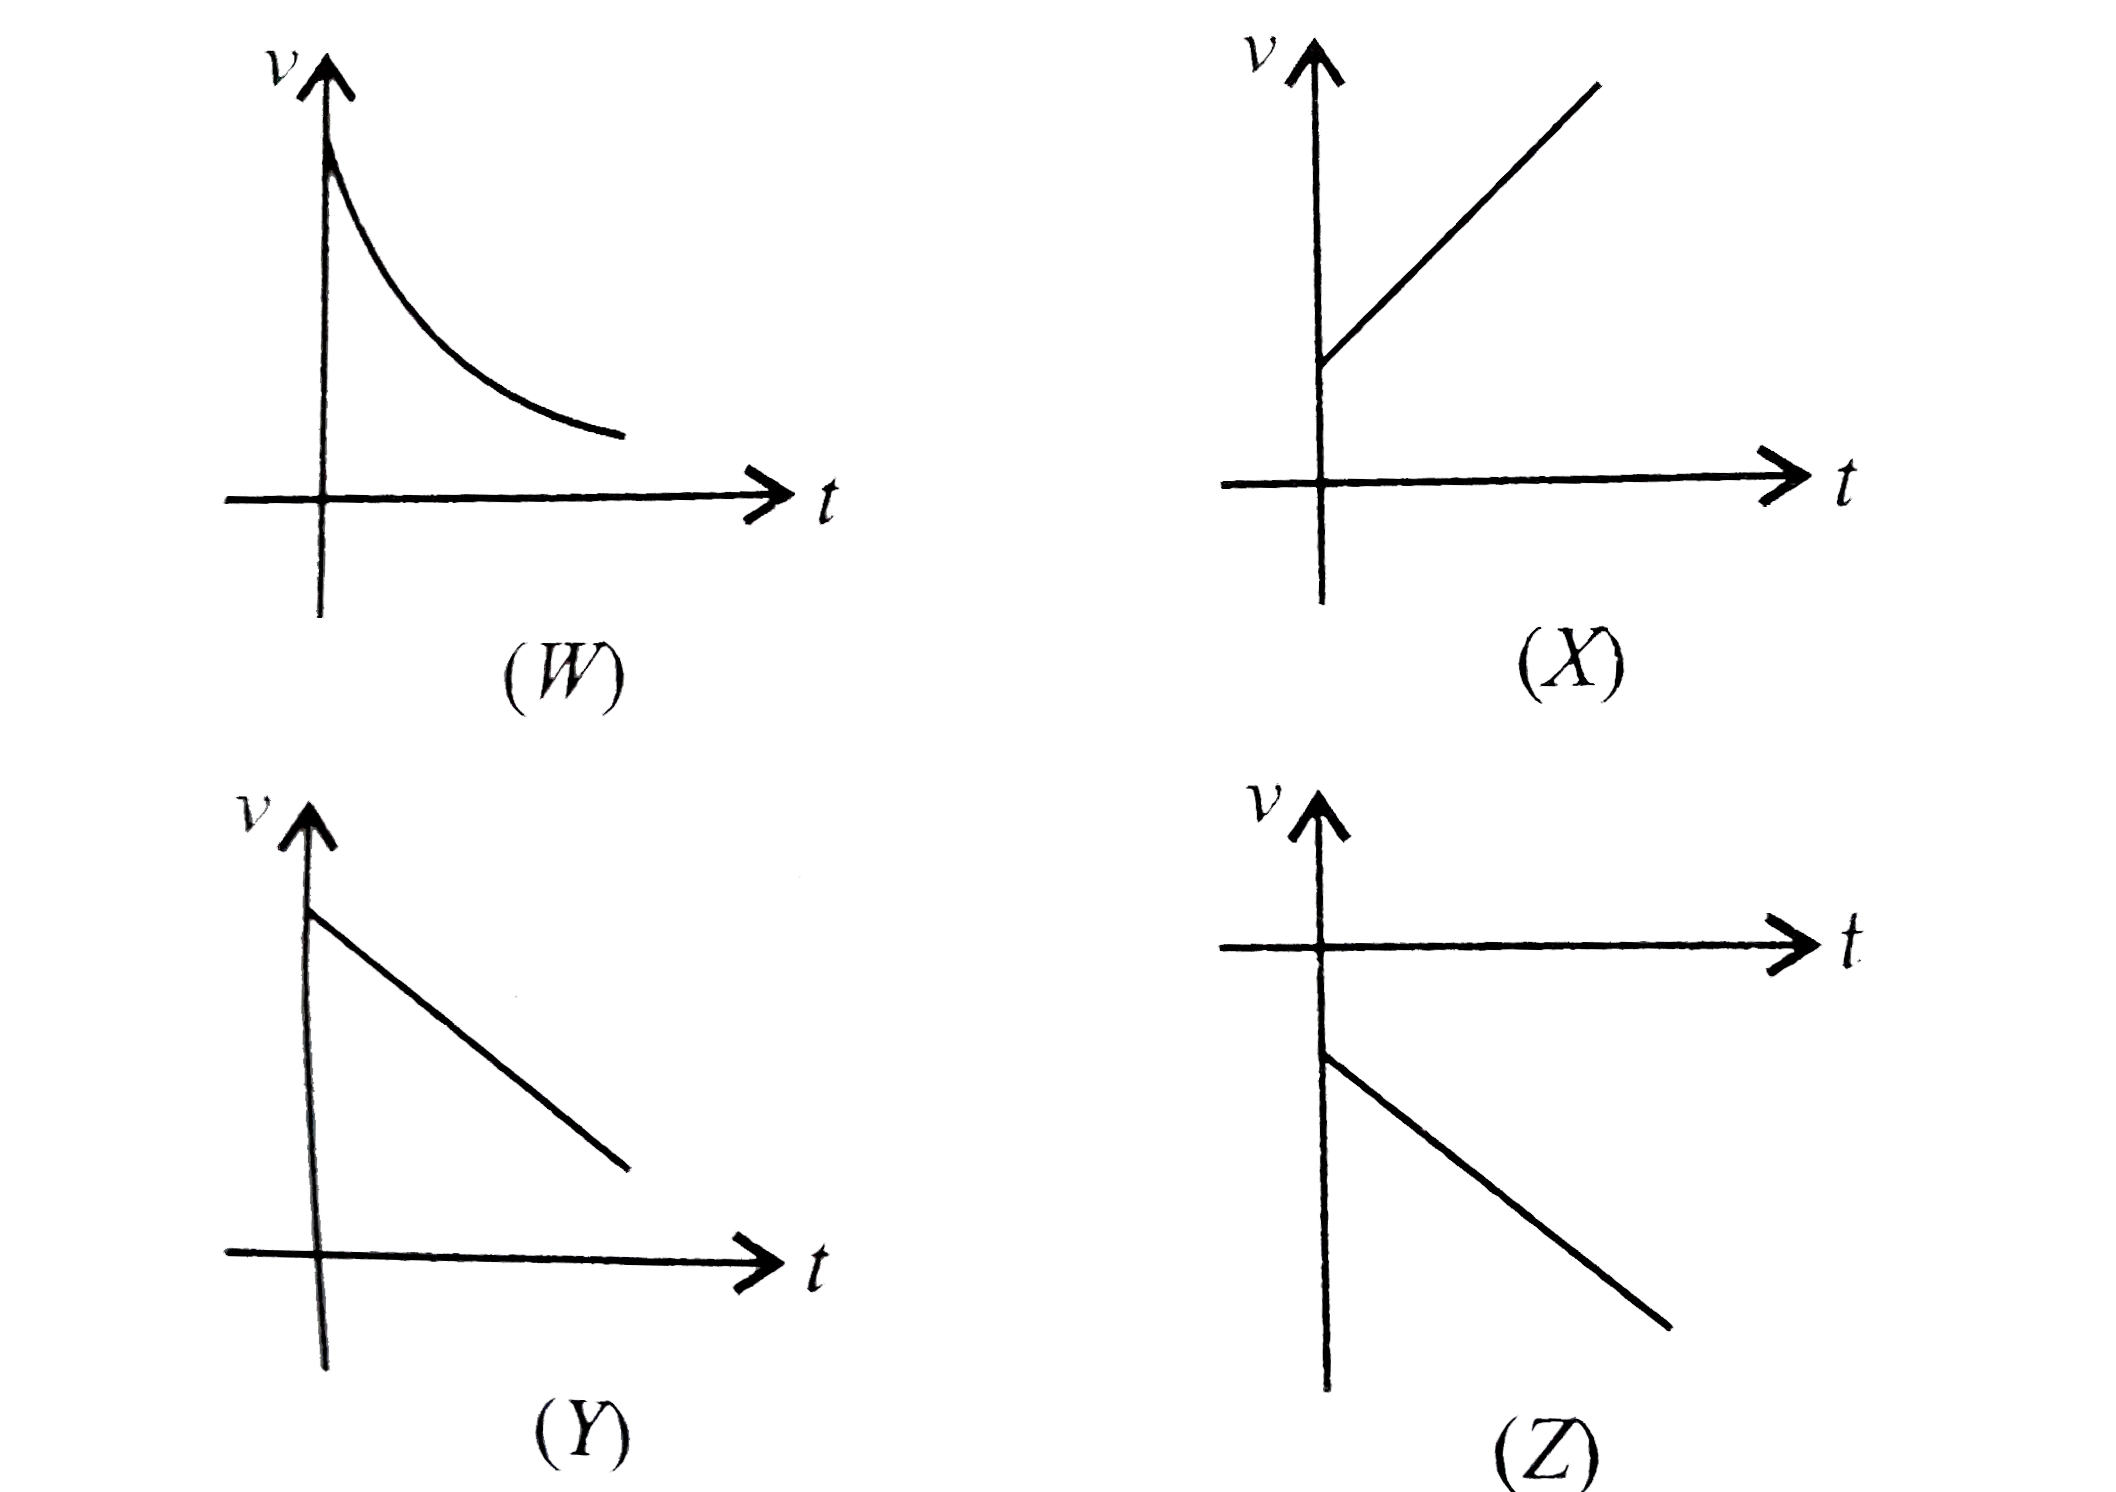
Which of the following statement is true ?View SolutionGiven below are four curves describing variation of velocity with time of a particle. Which one of these describe the motion of a particle initially in positive direction with constant negative acceleration?
 View Solution
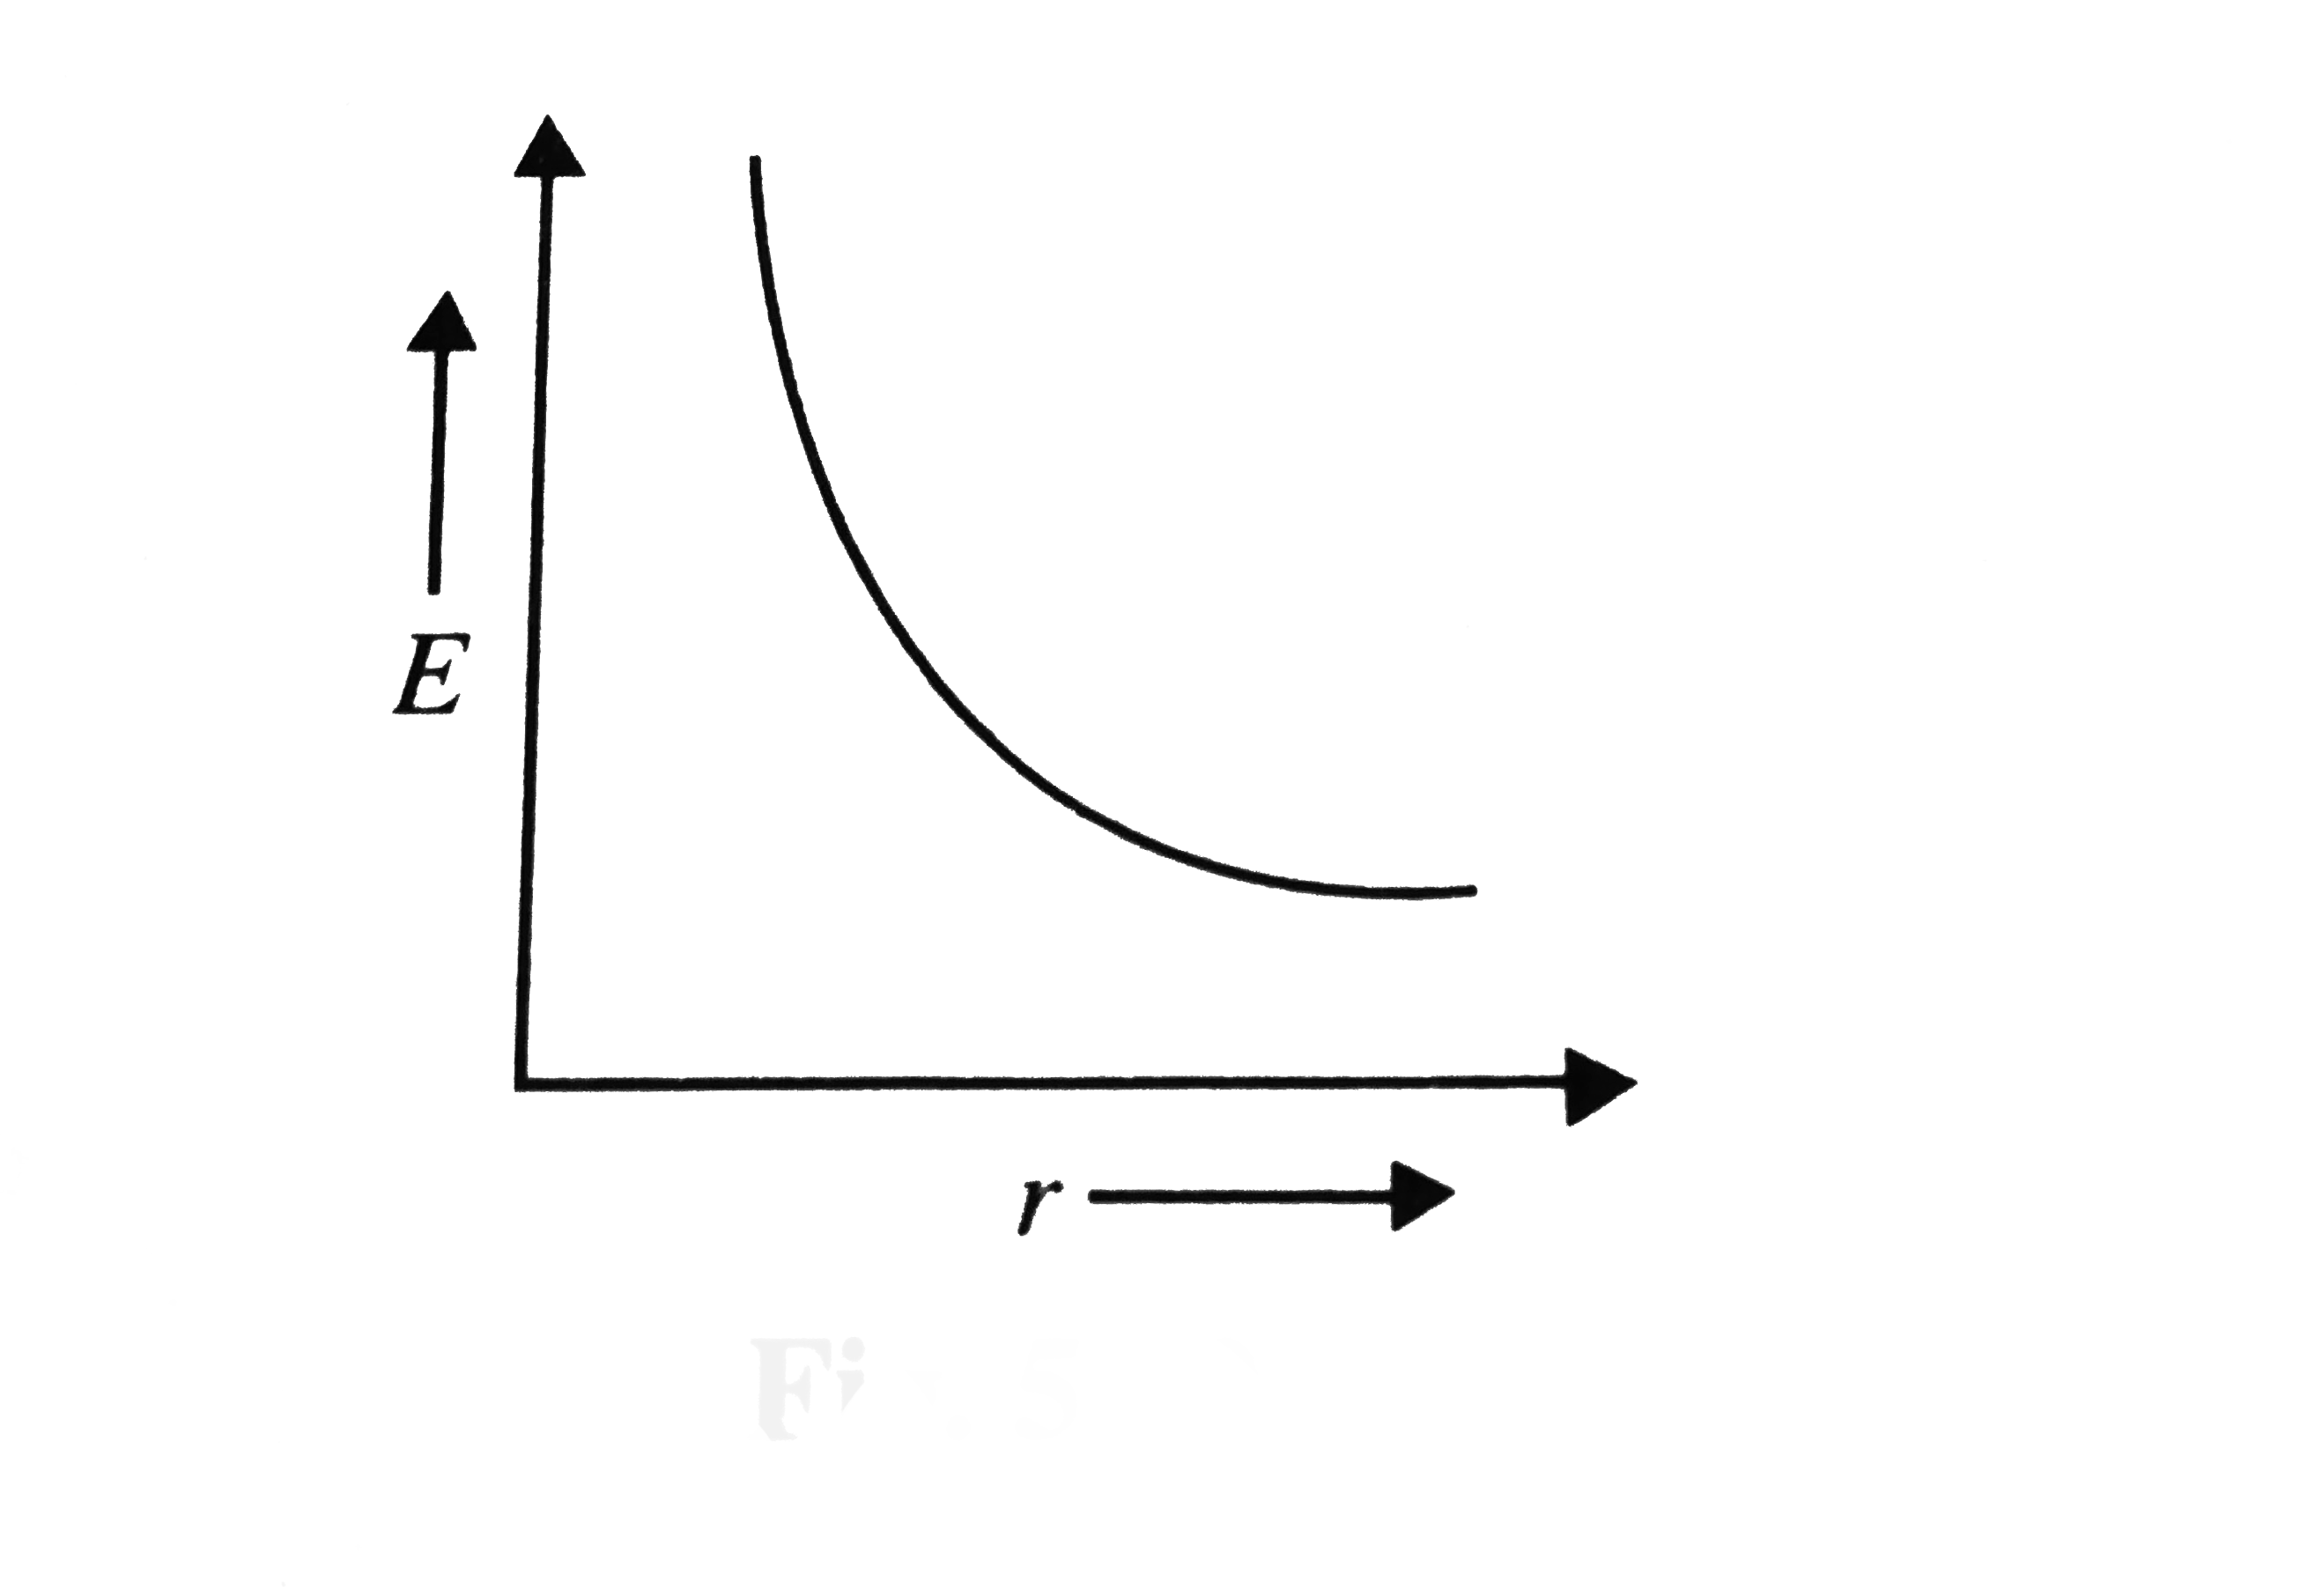
Energy density E (energy per unit volume ) of the medium ar a distance r from a sound source varies acording to the curve shown in figure. Which of the following are possible?
 View Solution

