Following curve shows the variation of intesity of gravitational field (→I) with distance from the centre of solid sphere(r) :
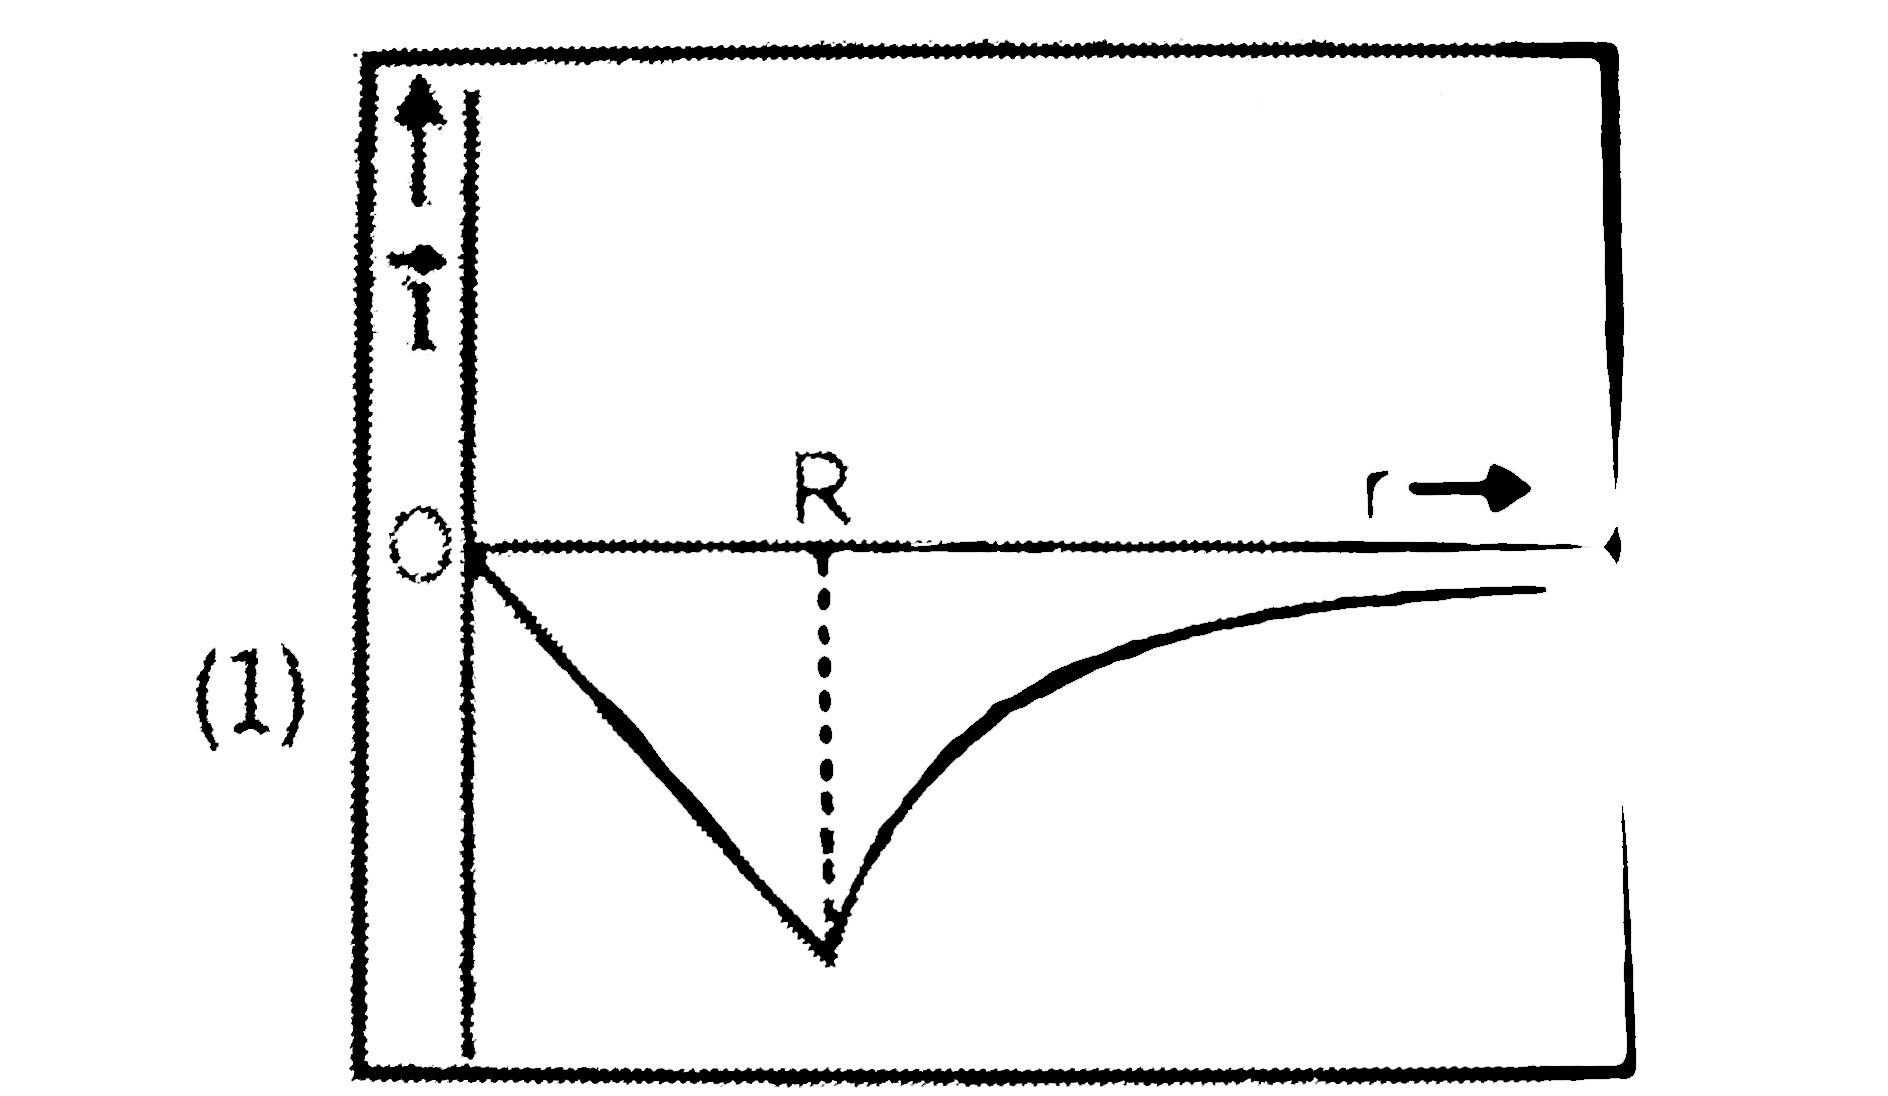
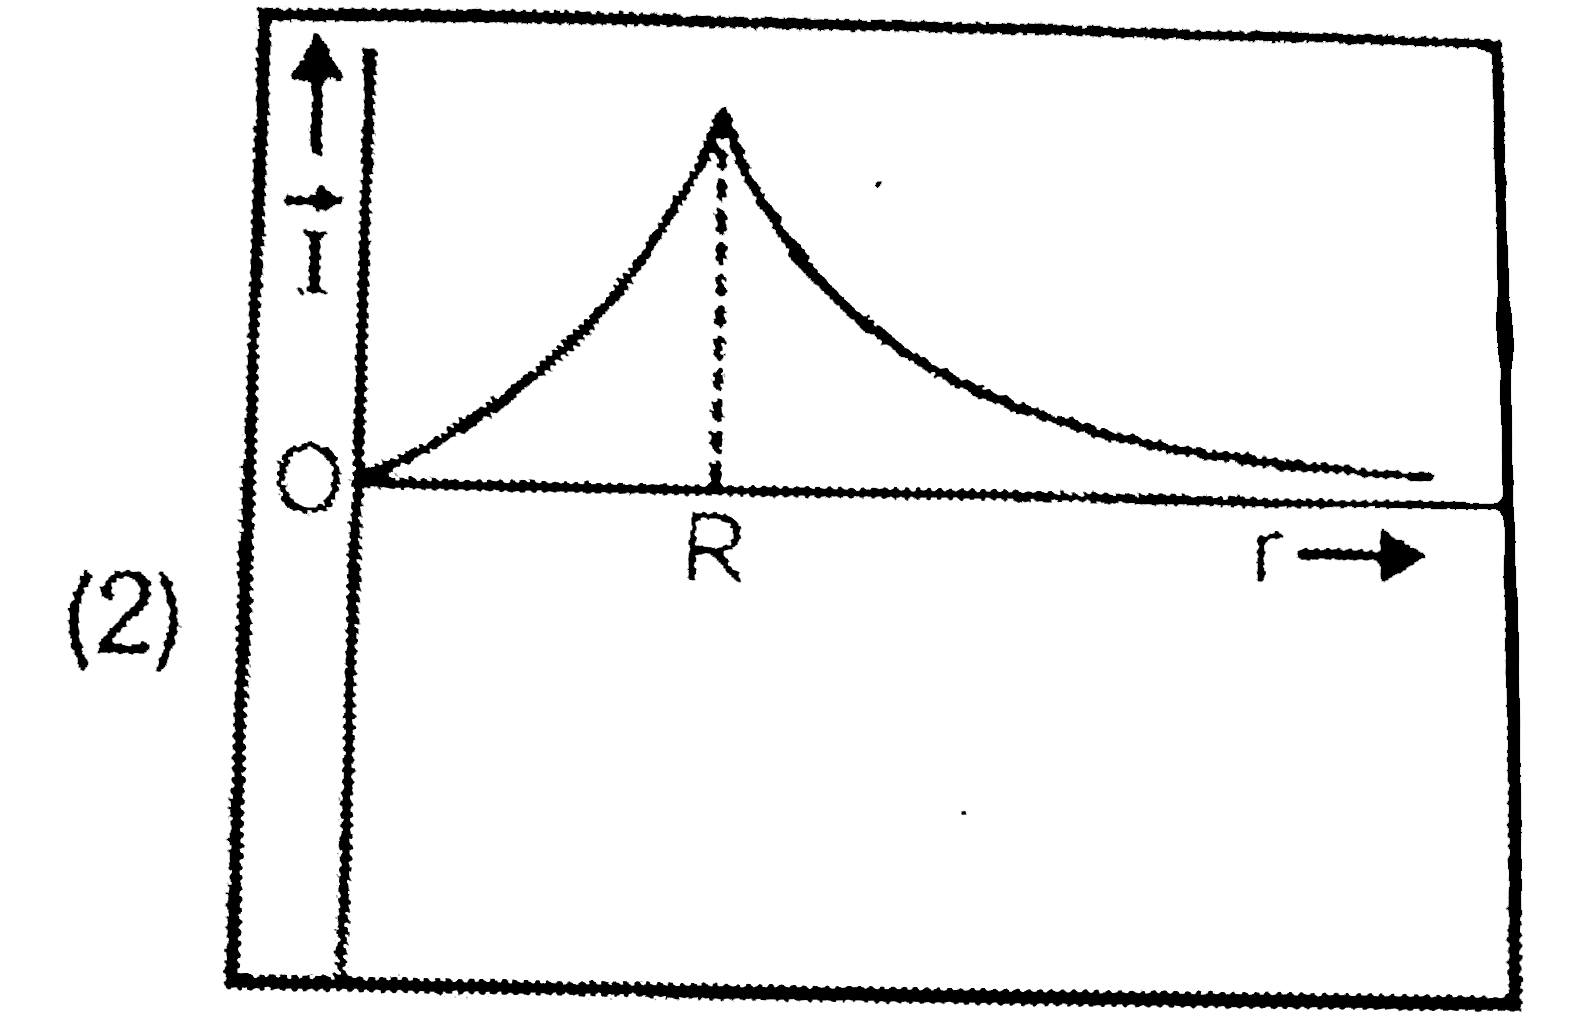
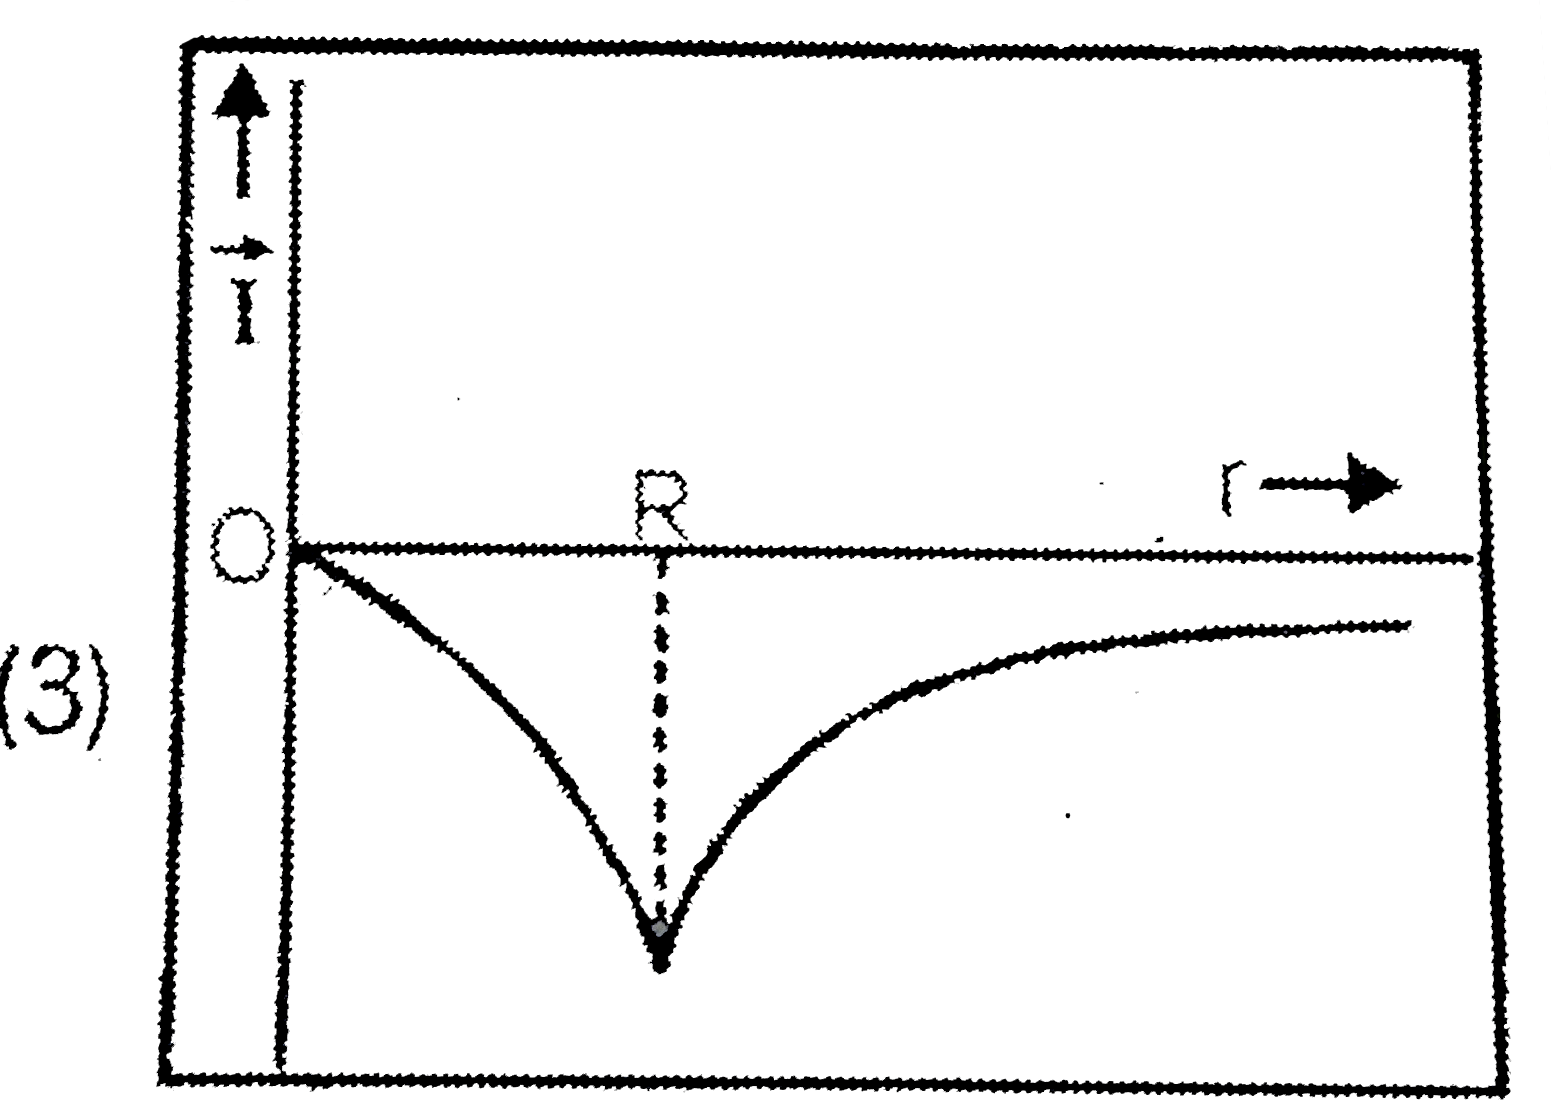
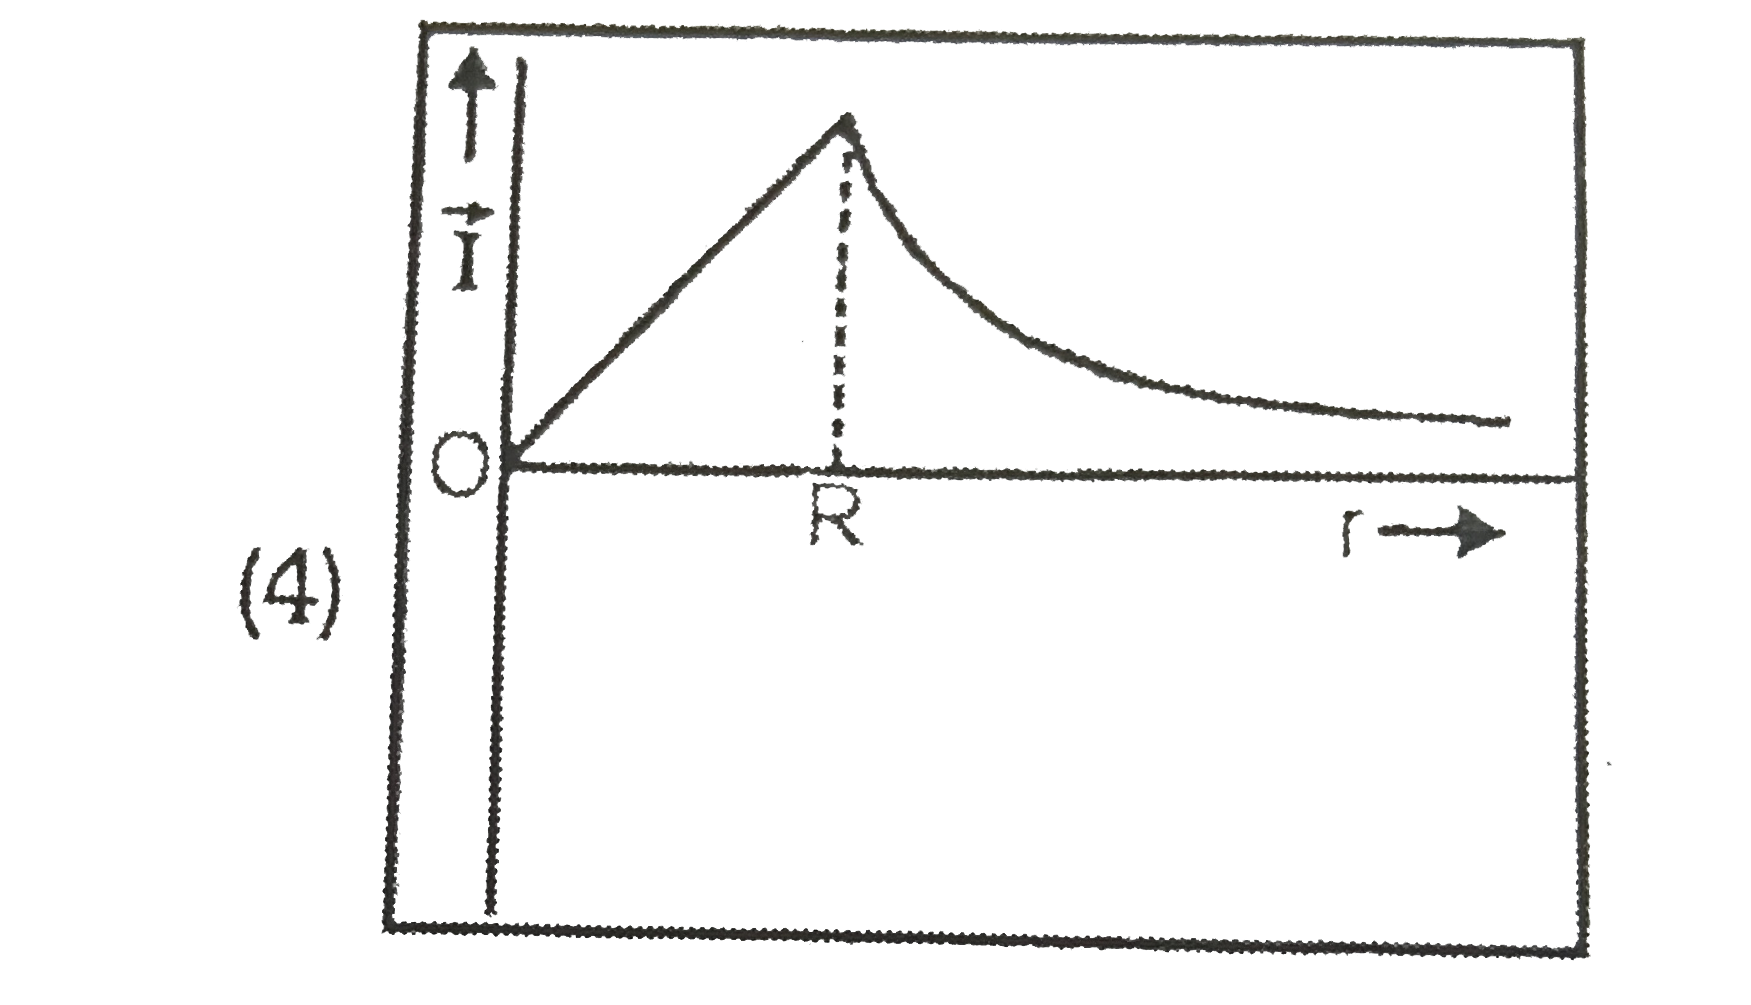
The correct Answer is:A
Topper's Solved these Questions
- GRAVITATIONBOOK - ALLENCHAPTER - GRAVITATIONEXERCISE - EXERCISE 2
26 Videos
- GRAVITATIONBOOK - ALLENCHAPTER - GRAVITATIONEXERCISE - EXERCISE 3
11 Videos
- GRAVITATIONBOOK - ALLENCHAPTER - GRAVITATIONEXERCISE - BOX-4
14 Videos
- GEOMETRICAL OPTICSBOOK - ALLENCHAPTER - GEOMETRICAL OPTICSEXERCISE - subjective
14 Videos
- KINEMATICS-2DBOOK - ALLENCHAPTER - KINEMATICS-2DEXERCISE - Exercise (O-2)
48 Videos
Similar Questions
The diagram showing the variation of gravitational potential of earth with distance from the centre of earth is
View SolutionA hollow charged sphere of radius R has a constant surface charge density o. Of the following graphs the one, which shows the variation of the electric field strength E with distance X from the centre of the sphere is (A) E I=R x (B) E 1
View Solution
Knowledge Check
The diagram showing the variation of gravitational potential of earth with distance from the centre of earth is
A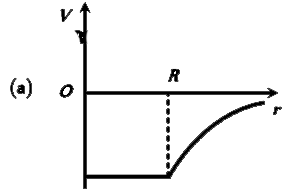 B
B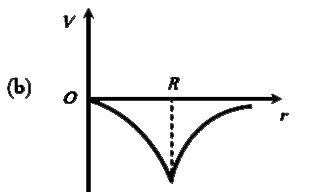 C
C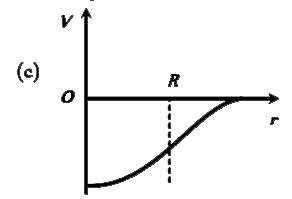 D
D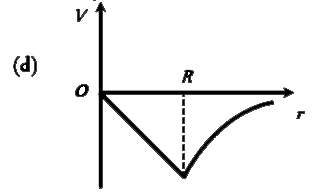
The diagram showing the variation of gravitational potential of earth with distance from the centre of earth is
A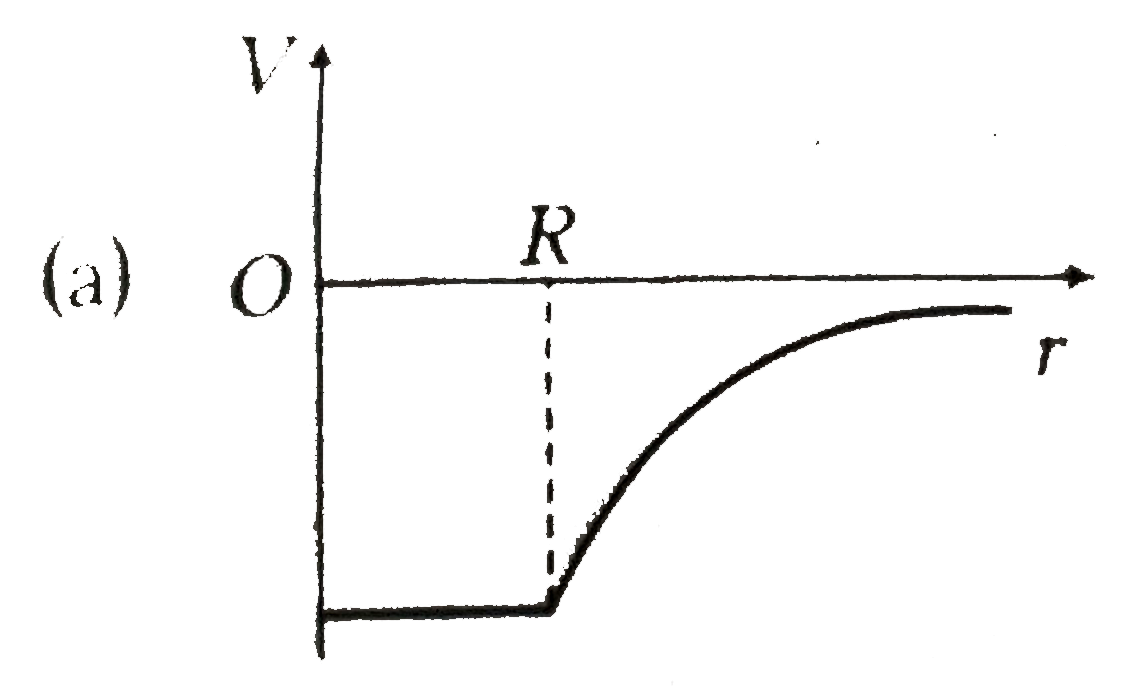 B
B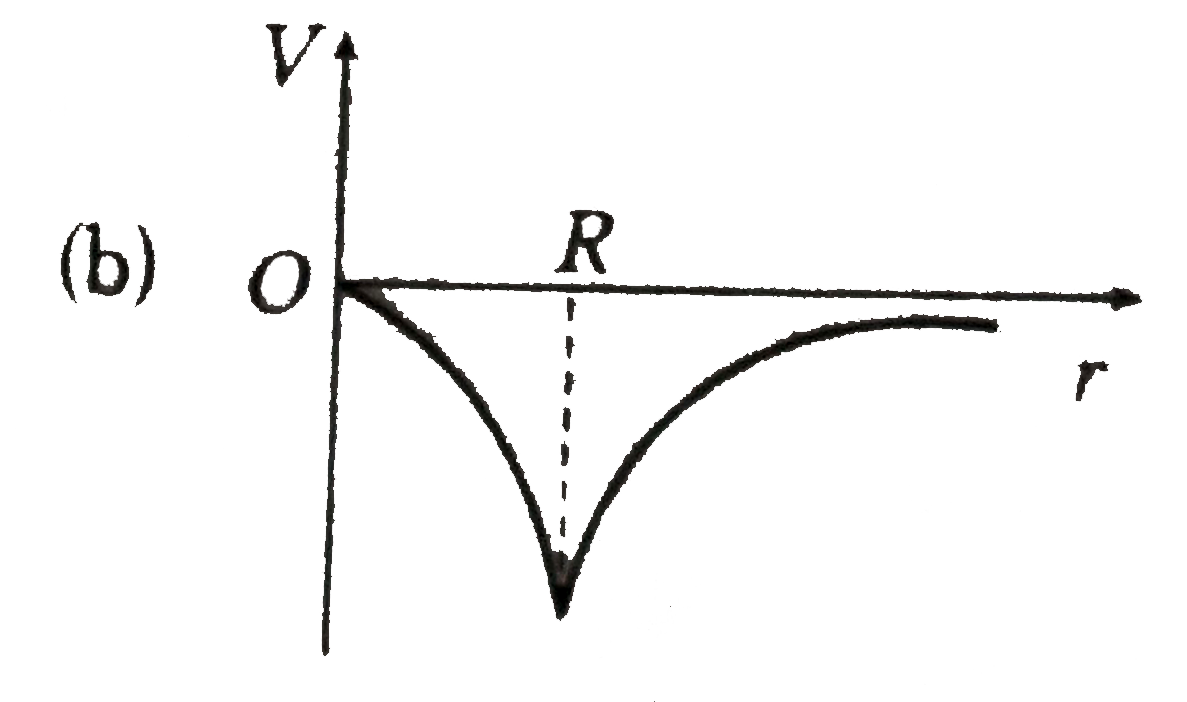 C
C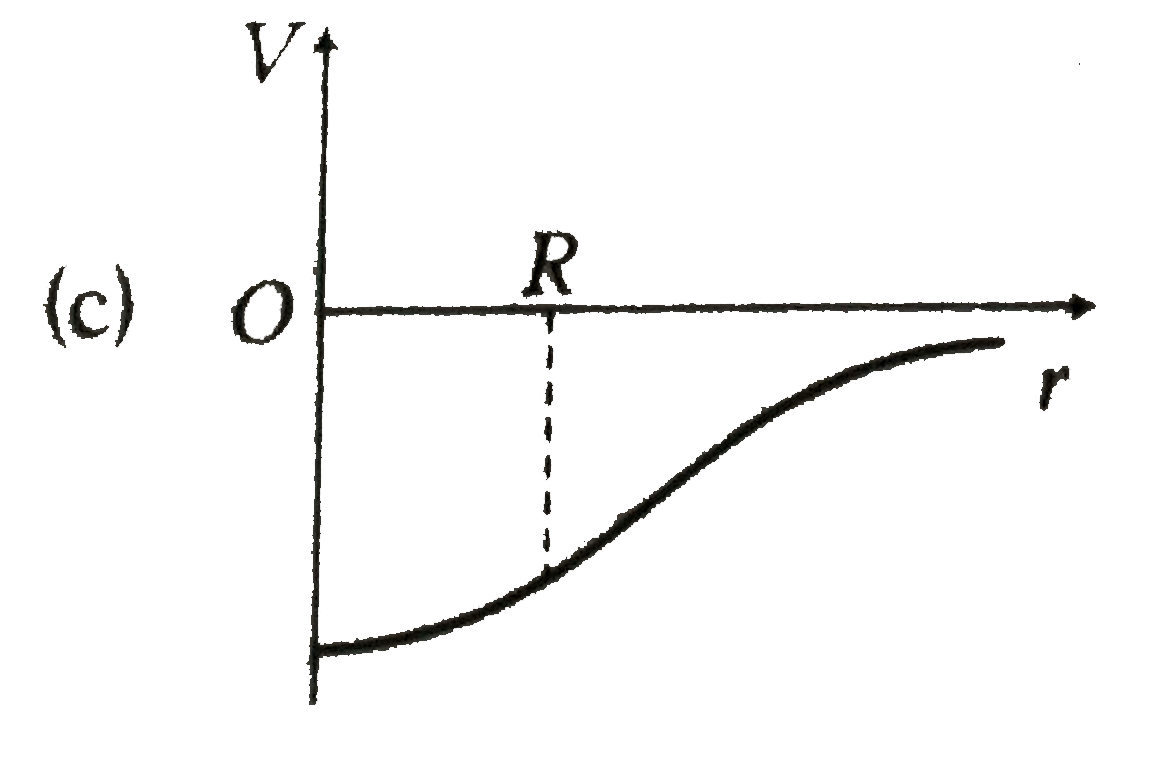 D
D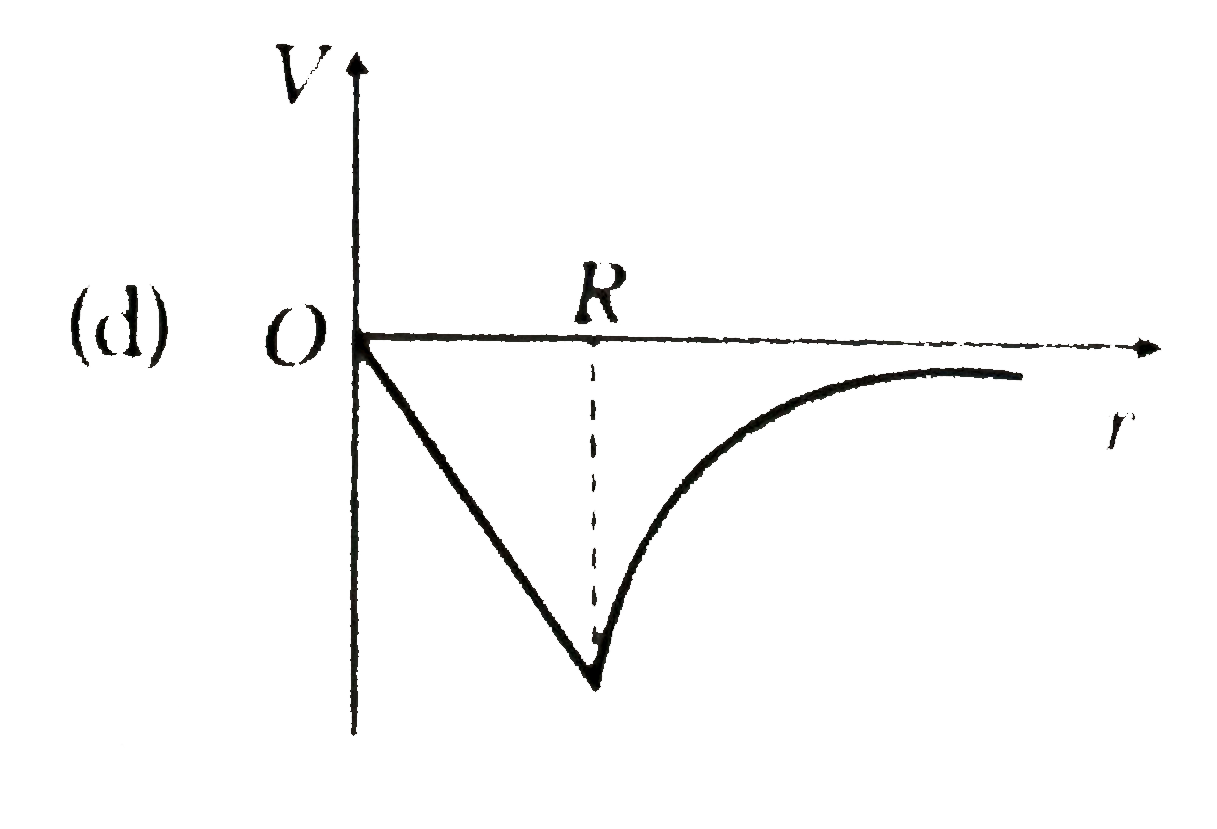
An isolated non-conducting solid sphere of radius R is given an electric charge. The charge is uniformly distributed in the volume of sphere. The graph which shows the correct variation of magnitude of electric field with distance from the centre of the sphere is
A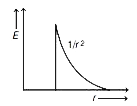 B
B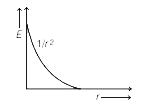 C
C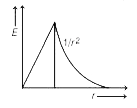 D
D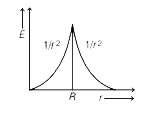
An isolated solid metal sphere of radius R is given an electric charge. The variation of the intensity of the electric field with the distance r from the centre of the sphere is best shown by
View SolutionAn isolated solid metal sphere of radius R is given an electric charge. The variation of the intensity of the electric field with the distance r from the centre of the sphere is best shown by
View SolutionAn isolated non-conducting solid sphere of radius R is given an electric charge. The charge is uniformly distributed in the volume of sphere. The graph which shows the correct variation of magnitude of electric field with distance from the centre of the sphere is
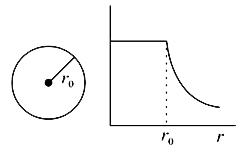
View SolutionThe given graph shows variation (with distance r from centre) of:
View SolutionThe given graph shows variation (with distance r from centre) of:
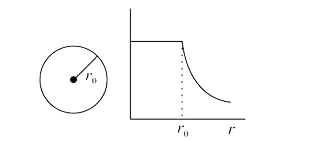
View Solution
