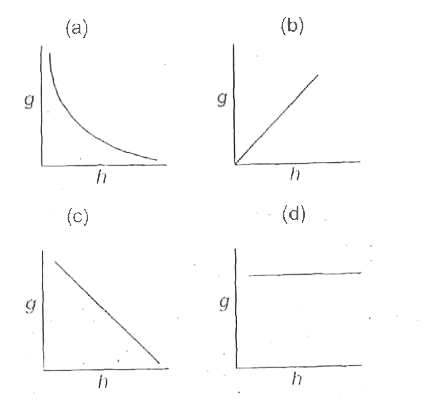
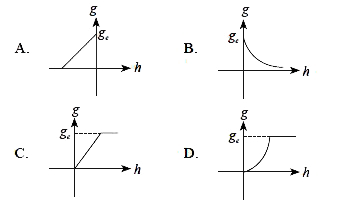
Draw graphs showing the variation of acceleration due to gravity with (i) height above the earth's surface.
Step by step video solution for Draw graphs showing the variation of acceleration due to gravity with (i) height above the earth's surface. by Physics experts to help you in doubts & scoring excellent marks in Class 11 exams.
Topper's Solved these Questions
Similar Questions
Draw graphs showing the variation of accleeration due to gravity with (a) height above the Earth's surface, (b) depth below the Earth's surface.
View SolutionDraw graphs showing the variation of accleeration due to gravity with (a) height above the Earth's surface, (b) depth below the Earth's surface.
View Solution
Knowledge Check
- Question 1 - Select One
Which of the following graphs shows the variation of acceleration due to gravity g with depth h from the surface of the earth ?
 A(a)B(b)C(c )D(d)
 - Question 2 - Select One
The value of acceleration due to gravity at the surface of earth
Ais maximum at the polesBis maximum at the equatorCremains constant everywhere on the surface of the earthDis maximum at the international time line - Question 3 - Select One
Acceleration due to gravity is ‘ g ’ on the surface of the earth. The value of acceleration due to gravity at a height of 32 km above earth’s surface is (Radius of the earth = 6400 km )
A0.9gB0.99gC0.8gD1.01g
Draw graphs showing the variation of acceleration due to gravity with depth below the earth's surface.
View SolutionDraw graphs showing the variation of acceleration due to gravity with depth below the earth's surface.
View SolutionWhich of the following graphs shows an approximate variation of acceleration due to gravity g with height h above the Earth's surface?
 View Solution
Does the concentration of the earth's mass near its centre change the variation of g (acceleration due to gravity) with height from its surface?
View SolutionLet g be the acceleration due to gravity on the earth's surface.
 View Solution

