Draw graphs to show the dependence of acceleration on force for a constant mass.
To solve the question of drawing graphs to show the dependence of acceleration on force for a constant mass, we will follow these steps:
1. Understand the Relationship:
According to Newton's second law of motion, the relationship between force (F), mass (m), and acceleration (a) is given by the equation:
F=m⋅a
Here, we are considering mass (m) to be constant.
2. Rearrange the Equation:
We can rearrange the equation to express acceleration in terms of force:
a=Fm
This shows that acceleration (a) is directly proportional to force (F) when mass is constant.
3. Choose Values:
To plot the graph, we need to choose some values for acceleration and calculate the corresponding force. Let's assume a constant mass m. For simplicity, we can take m=1 kg.
- If a=0, then F=0⋅m=0
- If a=1, then F=1⋅m=1
- If a=2, then F=2⋅m=2
- If a=3, then F=3⋅m=3
4. Create a Table:
Now, we can create a table of values:
| Acceleration (a) | Force (F) |
|-------------------|-----------|
| 0 | 0 |
| 1 | 1 |
| 2 | 2 |
| 3 | 3 |
5. Draw the Graph:
- On a graph, label the x-axis as "Acceleration (a)" and the y-axis as "Force (F)".
- Plot the points from the table:
- (0, 0)
- (1, 1)
- (2, 2)
- (3, 3)
- Connect the points with a straight line. Since the relationship is linear, the graph will be a straight line passing through the origin (0,0).
6. Final Graph:
The final graph will show a straight line that starts from the origin (0,0) and rises to the right, indicating that as force increases, acceleration also increases linearly for a constant mass.
According to Newton's second law of motion, the relationship between force (F), mass (m), and acceleration (a) is given by the equation:
F=m⋅a
Here, we are considering mass (m) to be constant.
We can rearrange the equation to express acceleration in terms of force:
a=Fm
This shows that acceleration (a) is directly proportional to force (F) when mass is constant.
To plot the graph, we need to choose some values for acceleration and calculate the corresponding force. Let's assume a constant mass m. For simplicity, we can take m=1 kg.
- If a=1, then F=1⋅m=1
- If a=2, then F=2⋅m=2
- If a=3, then F=3⋅m=3
Now, we can create a table of values:
|-------------------|-----------|
| 0 | 0 |
| 1 | 1 |
| 2 | 2 |
| 3 | 3 |
- On a graph, label the x-axis as "Acceleration (a)" and the y-axis as "Force (F)".
- Plot the points from the table:
- (0, 0)
- (1, 1)
- (2, 2)
- (3, 3)
- Connect the points with a straight line. Since the relationship is linear, the graph will be a straight line passing through the origin (0,0).
The final graph will show a straight line that starts from the origin (0,0) and rises to the right, indicating that as force increases, acceleration also increases linearly for a constant mass.
Topper's Solved these Questions
- LAWS OF MOTIONBOOK - ICSECHAPTER - LAWS OF MOTIONEXERCISE - EXERCISE - 3(C) Multiple Choice type
4 Videos
- LAWS OF MOTIONBOOK - ICSECHAPTER - LAWS OF MOTIONEXERCISE - EXERCISE - 3(C) (Numericals)
23 Videos
- LAWS OF MOTIONBOOK - ICSECHAPTER - LAWS OF MOTIONEXERCISE - EXERCISE - 3(B) (Multiple choice type)
3 Videos
- ICSE ANNUAL EXAMINATION -2020BOOK - ICSECHAPTER - ICSE ANNUAL EXAMINATION -2020EXERCISE - SECTION-II
45 Videos
- LIGHTBOOK - ICSECHAPTER - LIGHTEXERCISE - TOPIC 2 Spherical Mirrors (4 Marks Questions )
9 Videos
Similar Questions
Draw graphs to show the dependence of force on mass for a constant acceleration
View SolutionDraw graphs to show the dependence of force on mass for a constant acceleration .
View SolutionDraw a graph to show the deviation of real gas from Boyle's law.
View SolutionIn a uniform electric field, a point charge of mass m and charge q is released from rest. If there are no other forces acting on the particle, then which of the following graphs, correctly show the dependence of the particles speed v on the distance x travelled by the particles speed v on the distance x travelled by it? [Graphs are schmatic and not drawn to scale]
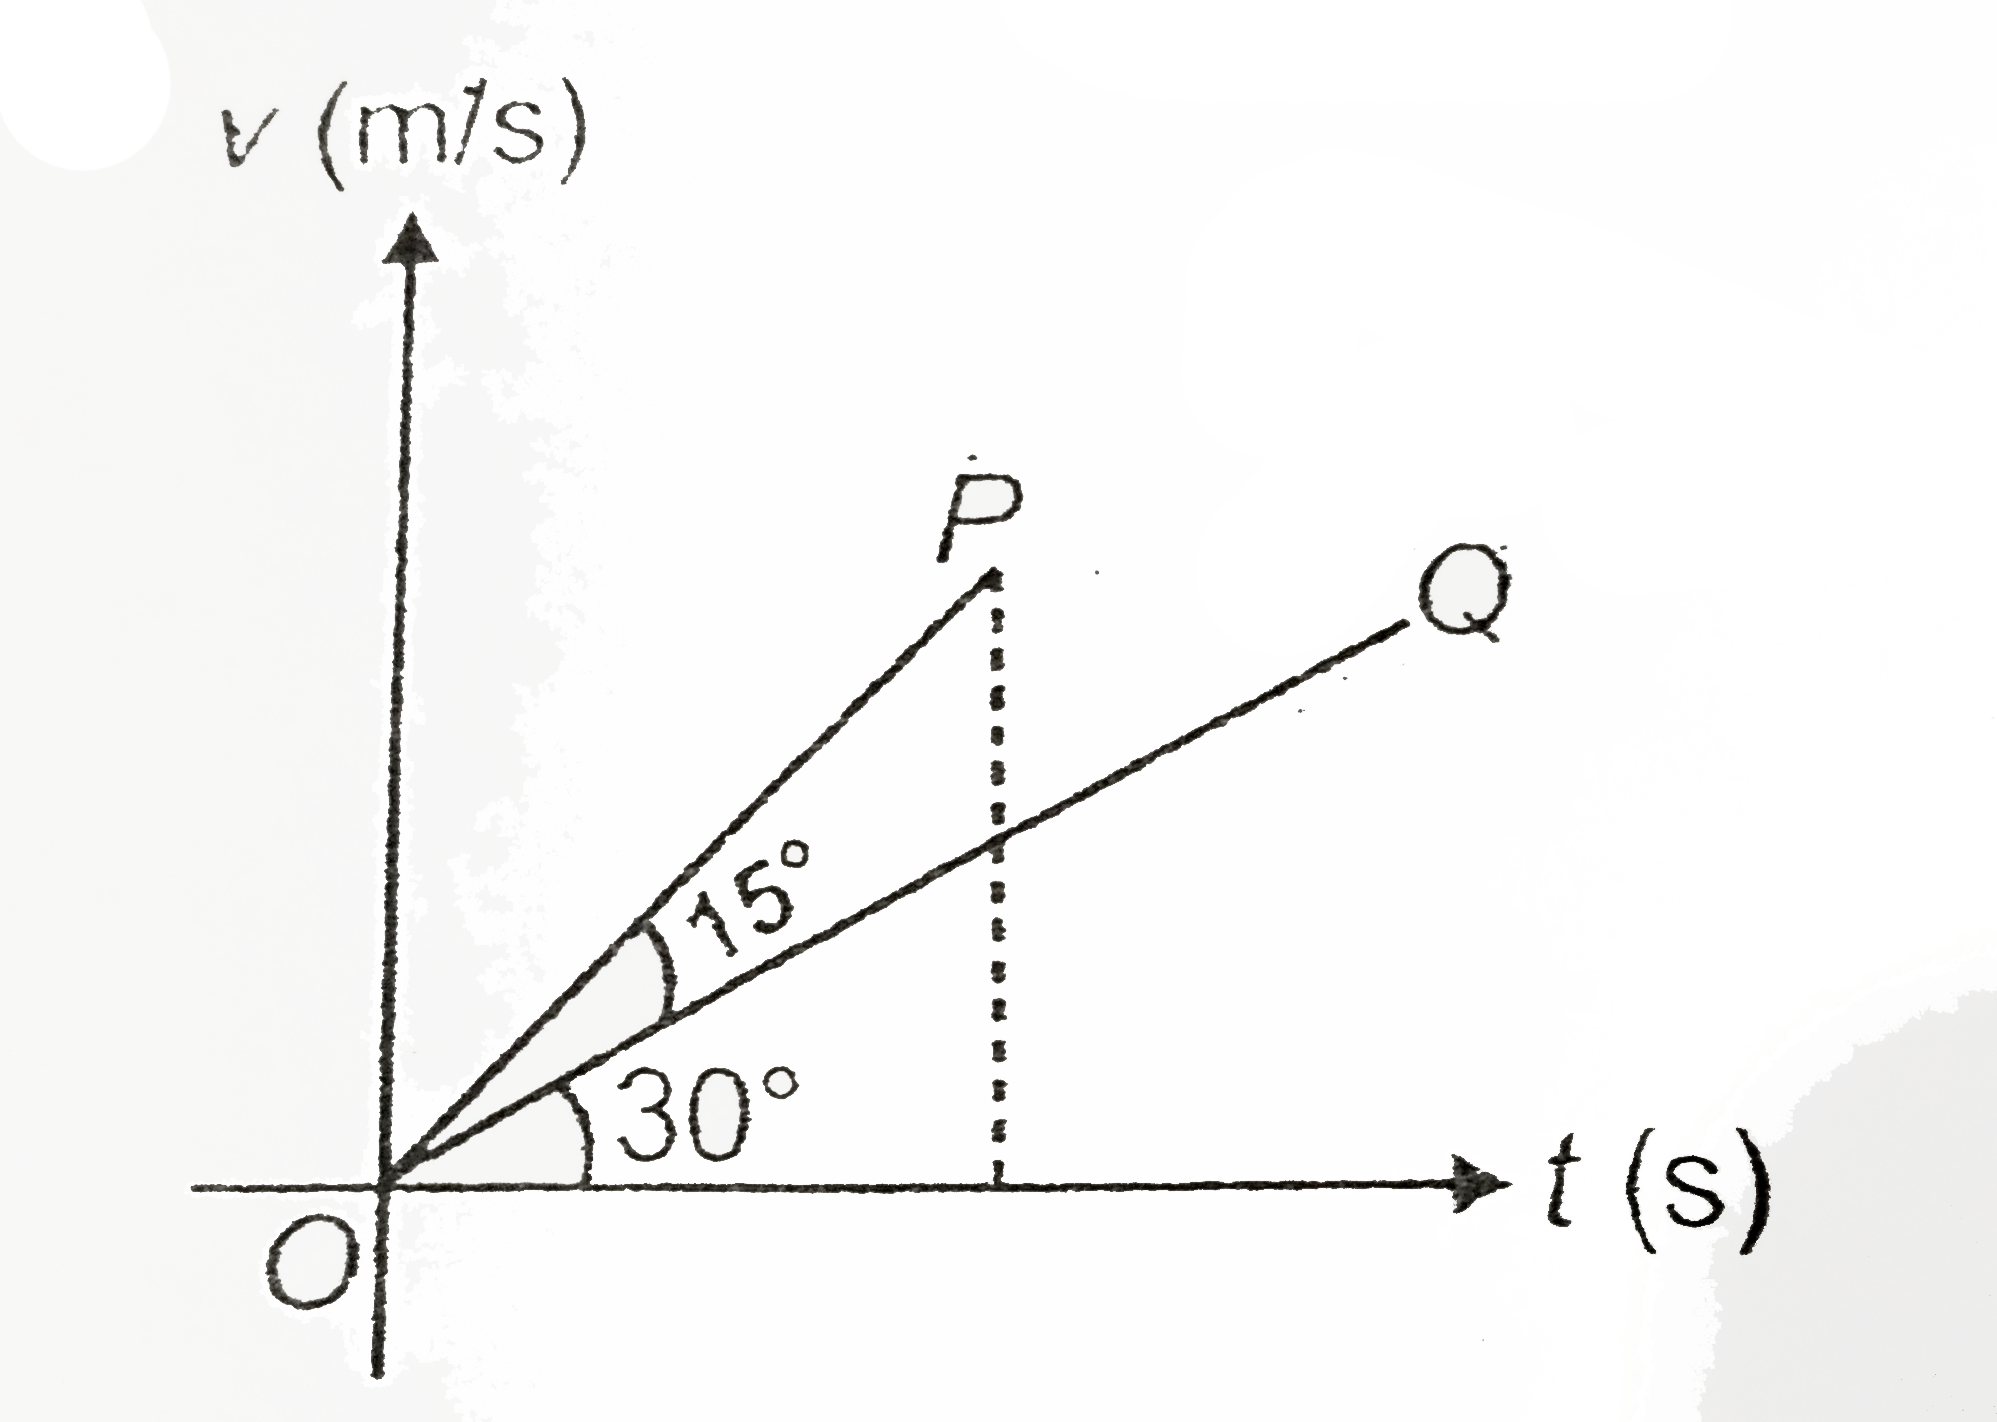
View SolutionGraphs are very useful to represent a physical situation. Various quantities can be easily represented on graphs and other quantites can be determined from the graph. For example the slope of velocity-time graph represents instantaneous acceleration. For a motion with constant acceleration slope of velocity-time graph is constant. If acceleration is changing with time, slope with change and thus velocity-time graph will be a non-linear curve. Further the area of velocity-time graph gives displacement.
The velocity-time graph for two objects P and Q are shown. The ratio of their respective acceleration is

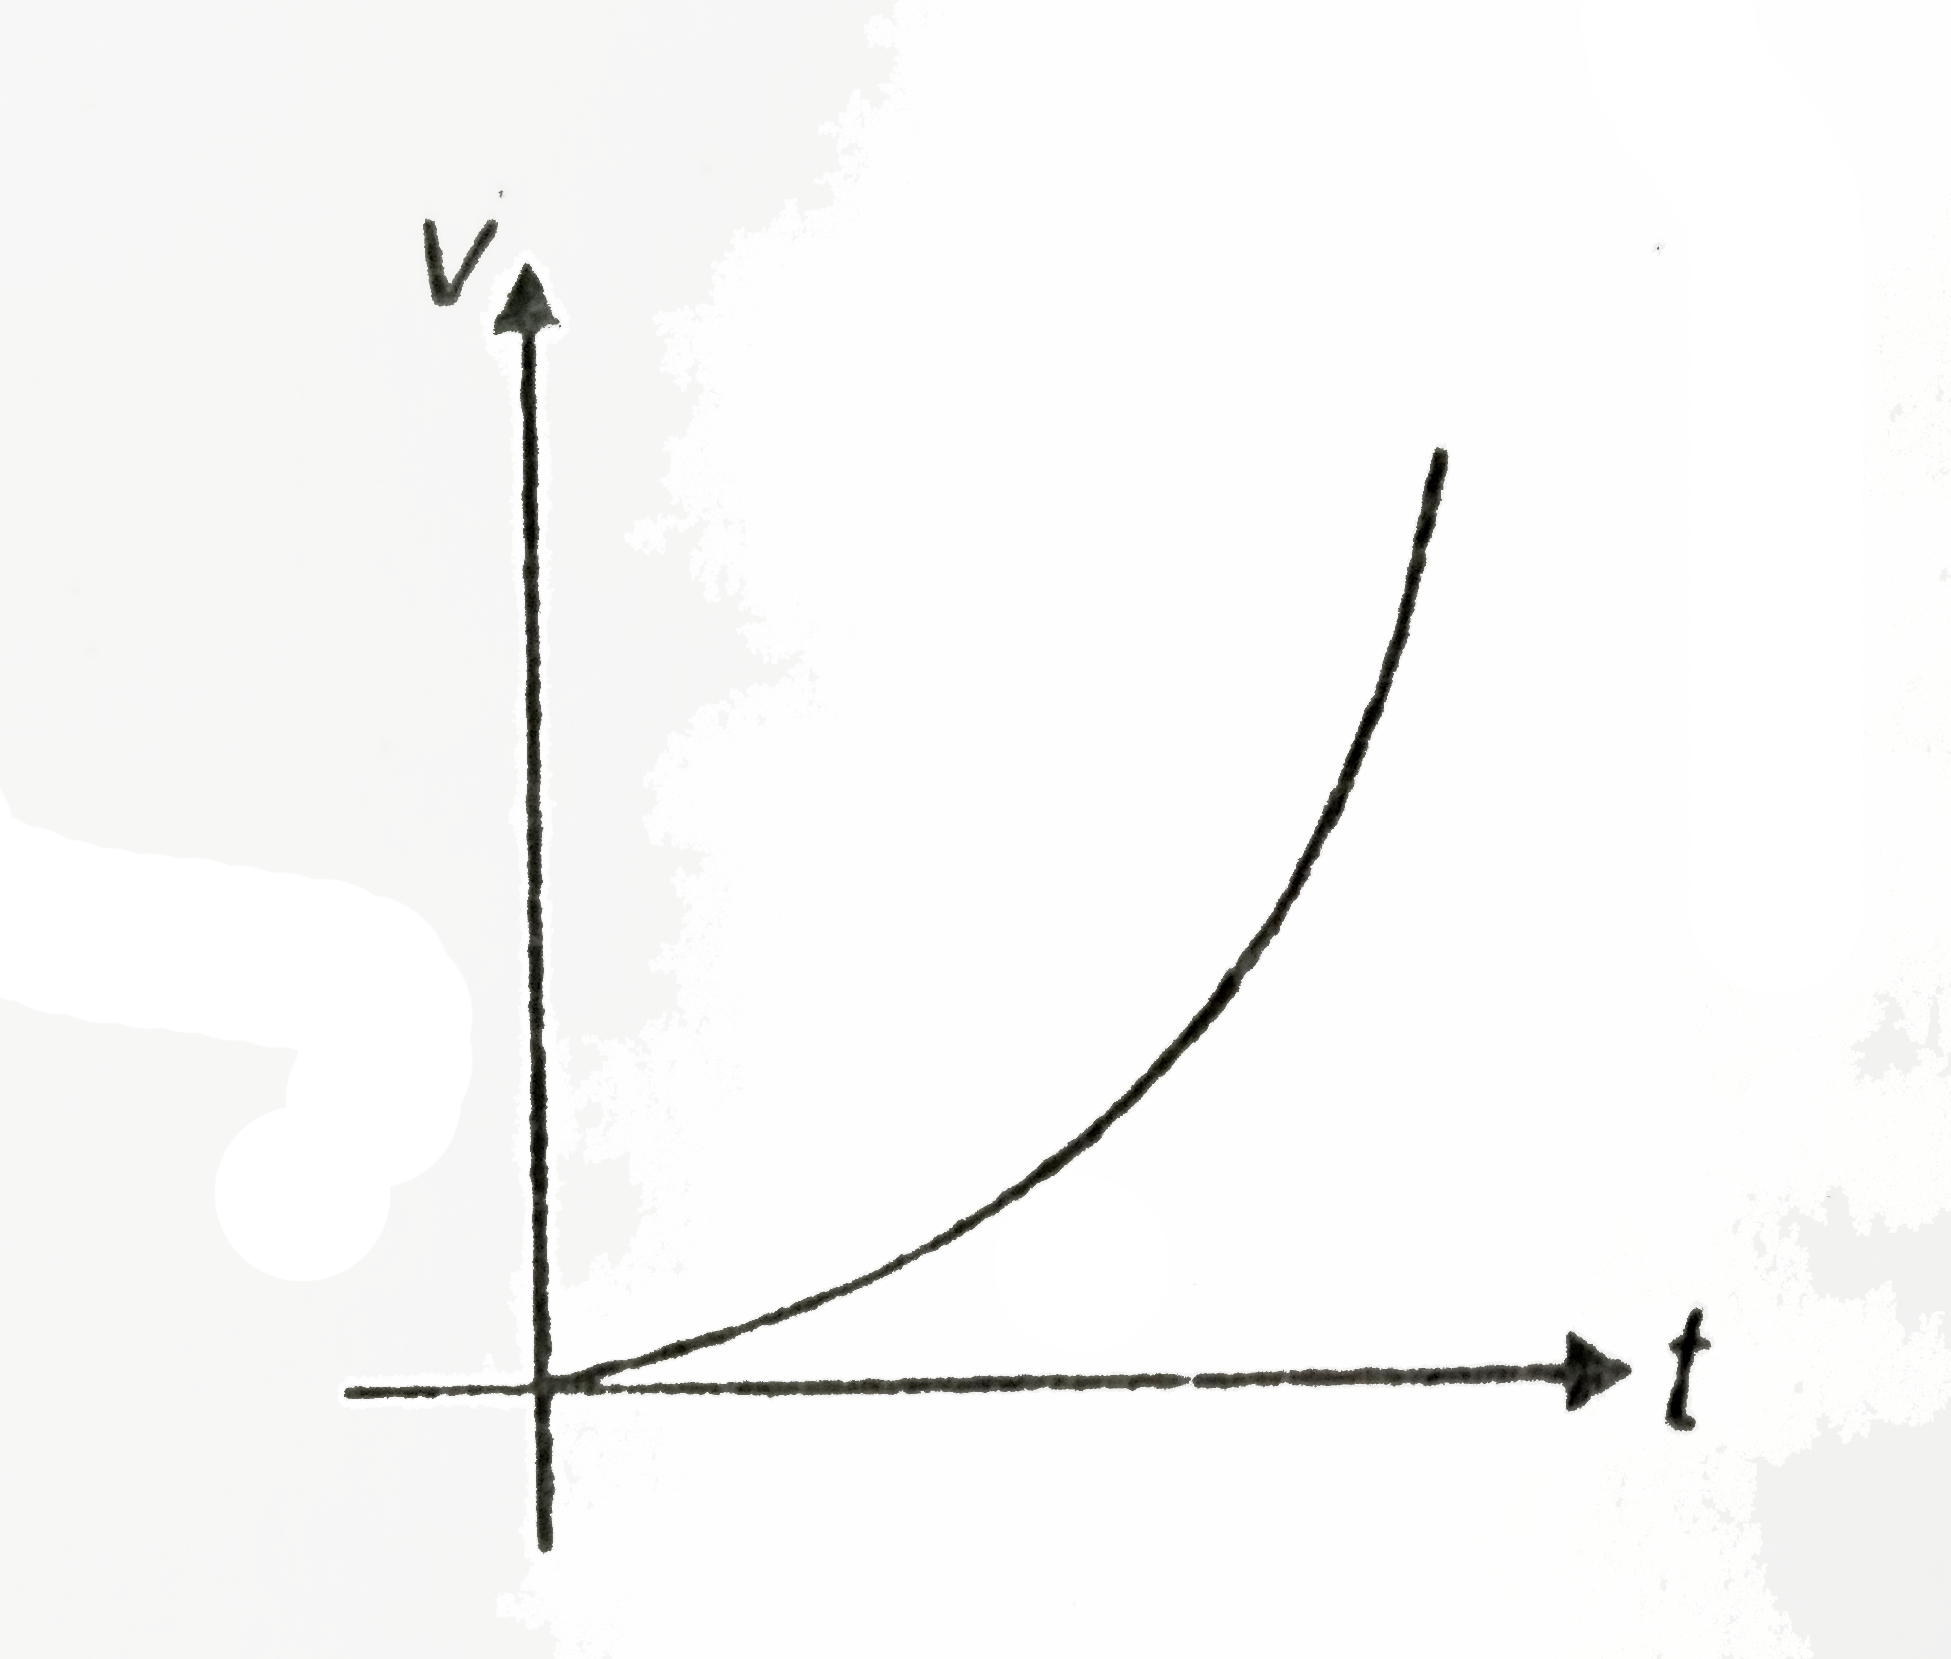
View SolutionGraphs are very useful to represent a physical situation. Various quantities can be easily represented on graphs and other quantites can be determined from the graph. For example the slope of velocity-time graph represents instantaneous acceleration. For a motion with constant acceleration slope of velocity-time graph is constant. If acceleration is changing with time, slope will change and thus velocity-time graph will be a non-linear curve. Further the area of velocity-time graph gives displacement.
For the given velocity-time graph the possibly correct acceleration-time relationship is

View SolutionGraphs are very useful to represent a physical situation. Various quantities can be easily represented on graphs and other quantites can be determined from the graph. For example the slope of velocity-time graph represents instantaneous acceleration. For a motion with constant acceleration slope of velocity-time graph is constant. If acceleration is changing with time, slope with change and thus velocity-time graph will be a non-linear curve. Further the area of velocity-time graph gives displacement.
The average velocity of the car for the entire trip is
View SolutionGraphs are very useful to represent a physical situation. Various quantities can be easily represented on graphs and other quantites can be determined from the graph. For example the slope of velocity-time graph represents instantaneous acceleration. For a motion with constant acceleration slope of velocity-time graph is constant. If acceleration is changing with time, slope will change and thus velocity-time graph will be a non-linear curve. Further the area of velocity-time graph gives displacement.
The correct relation between v0,a1,a2andt0 is
View SolutionDraw the graph of y=|x|
View SolutionWhich of the following option correctly describes the variation of the speed and acceleration 'a' of a point mass falling vertically in a viscous medium that applies a force F=−kv, where 'k' is constant, on the body?
(Graphs are schematic and drawn to scale)
View Solution
