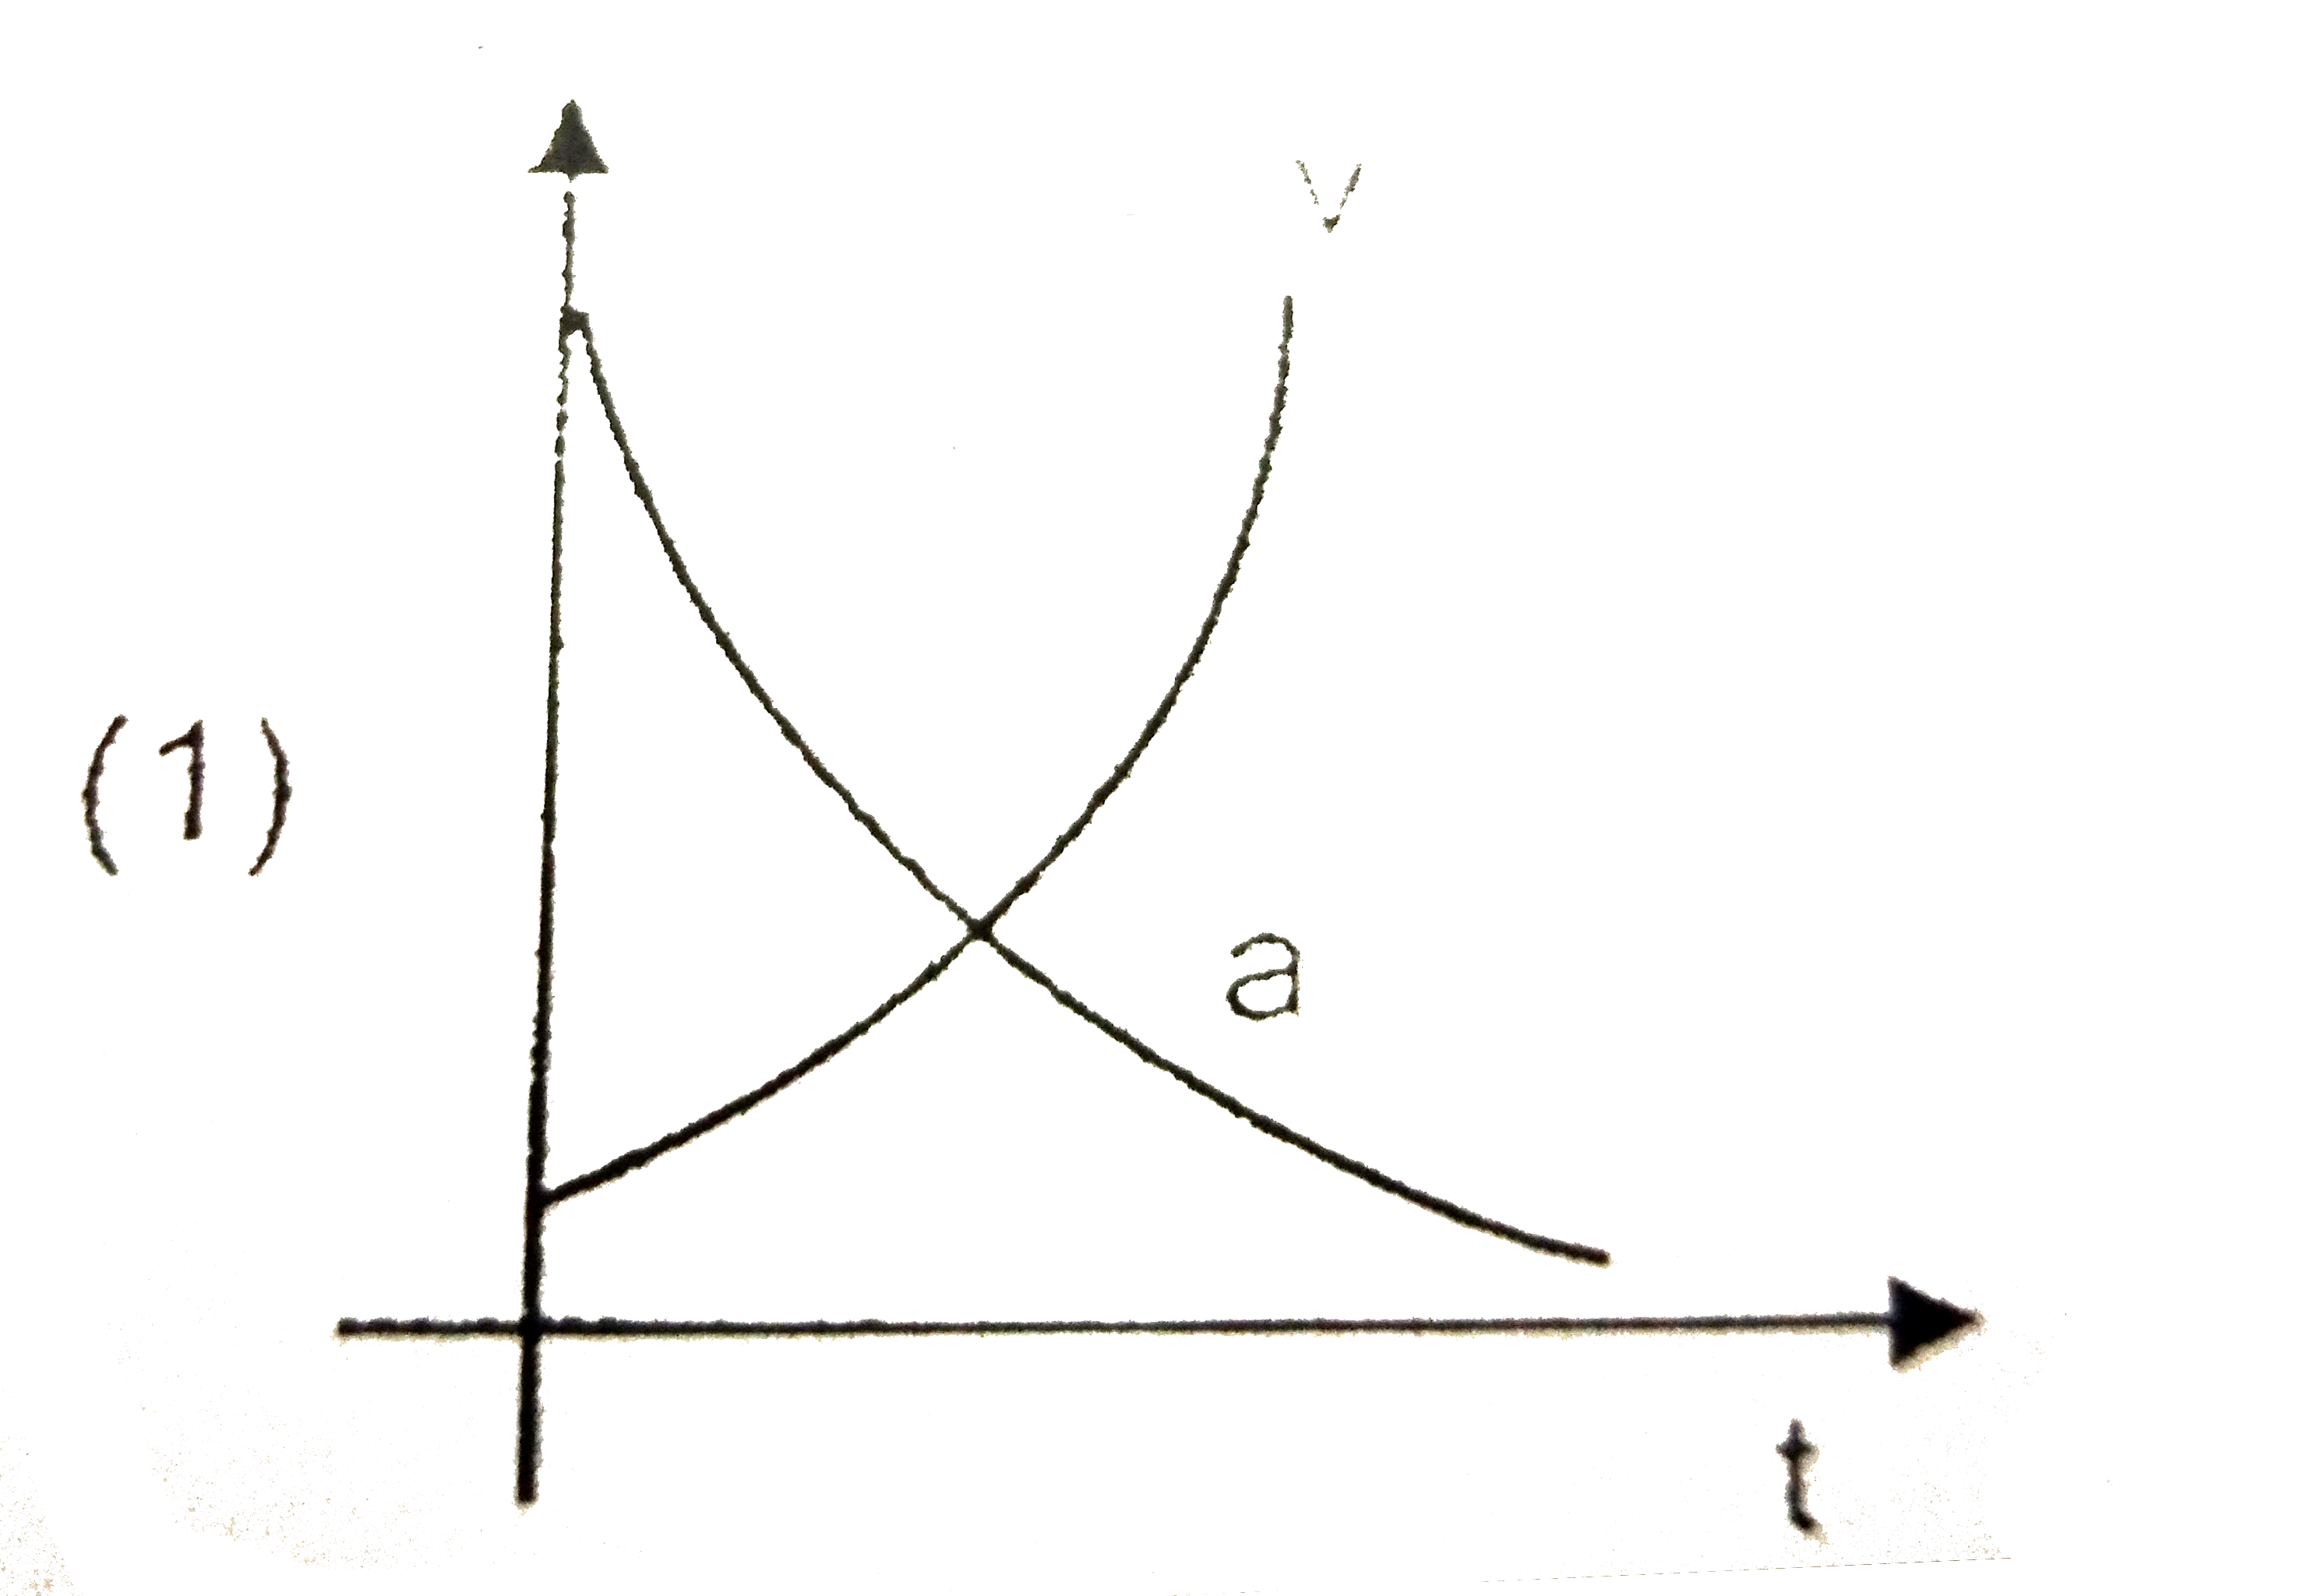
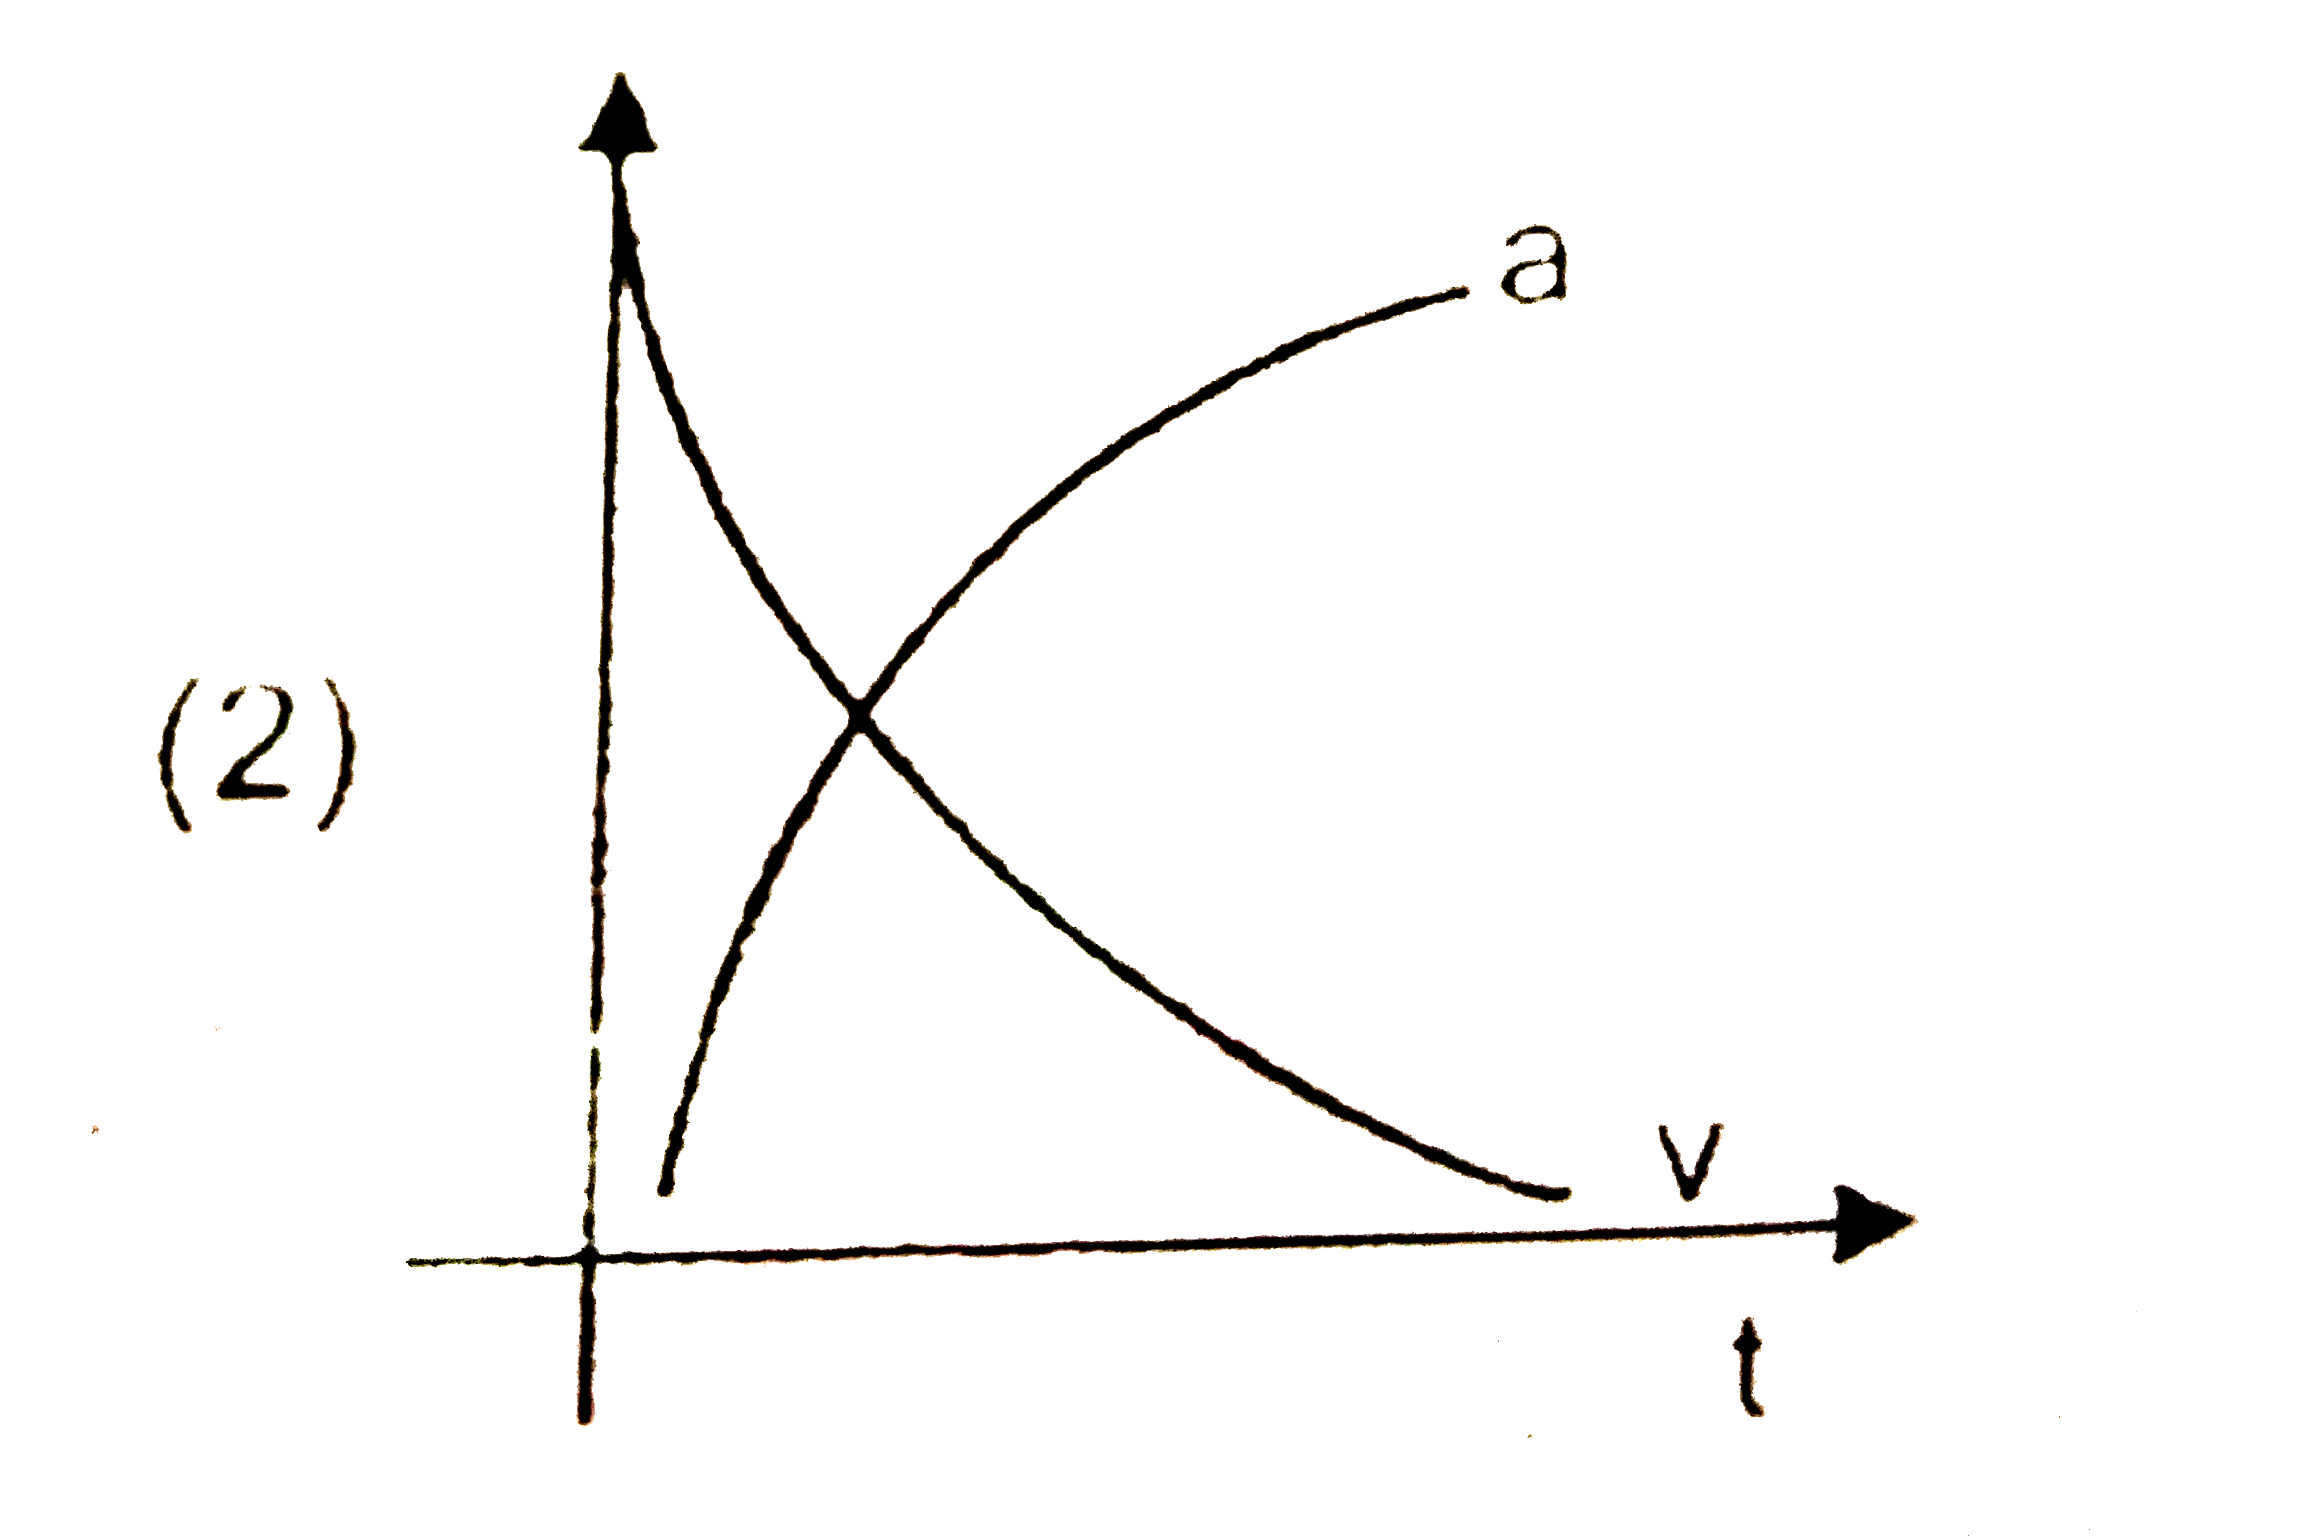
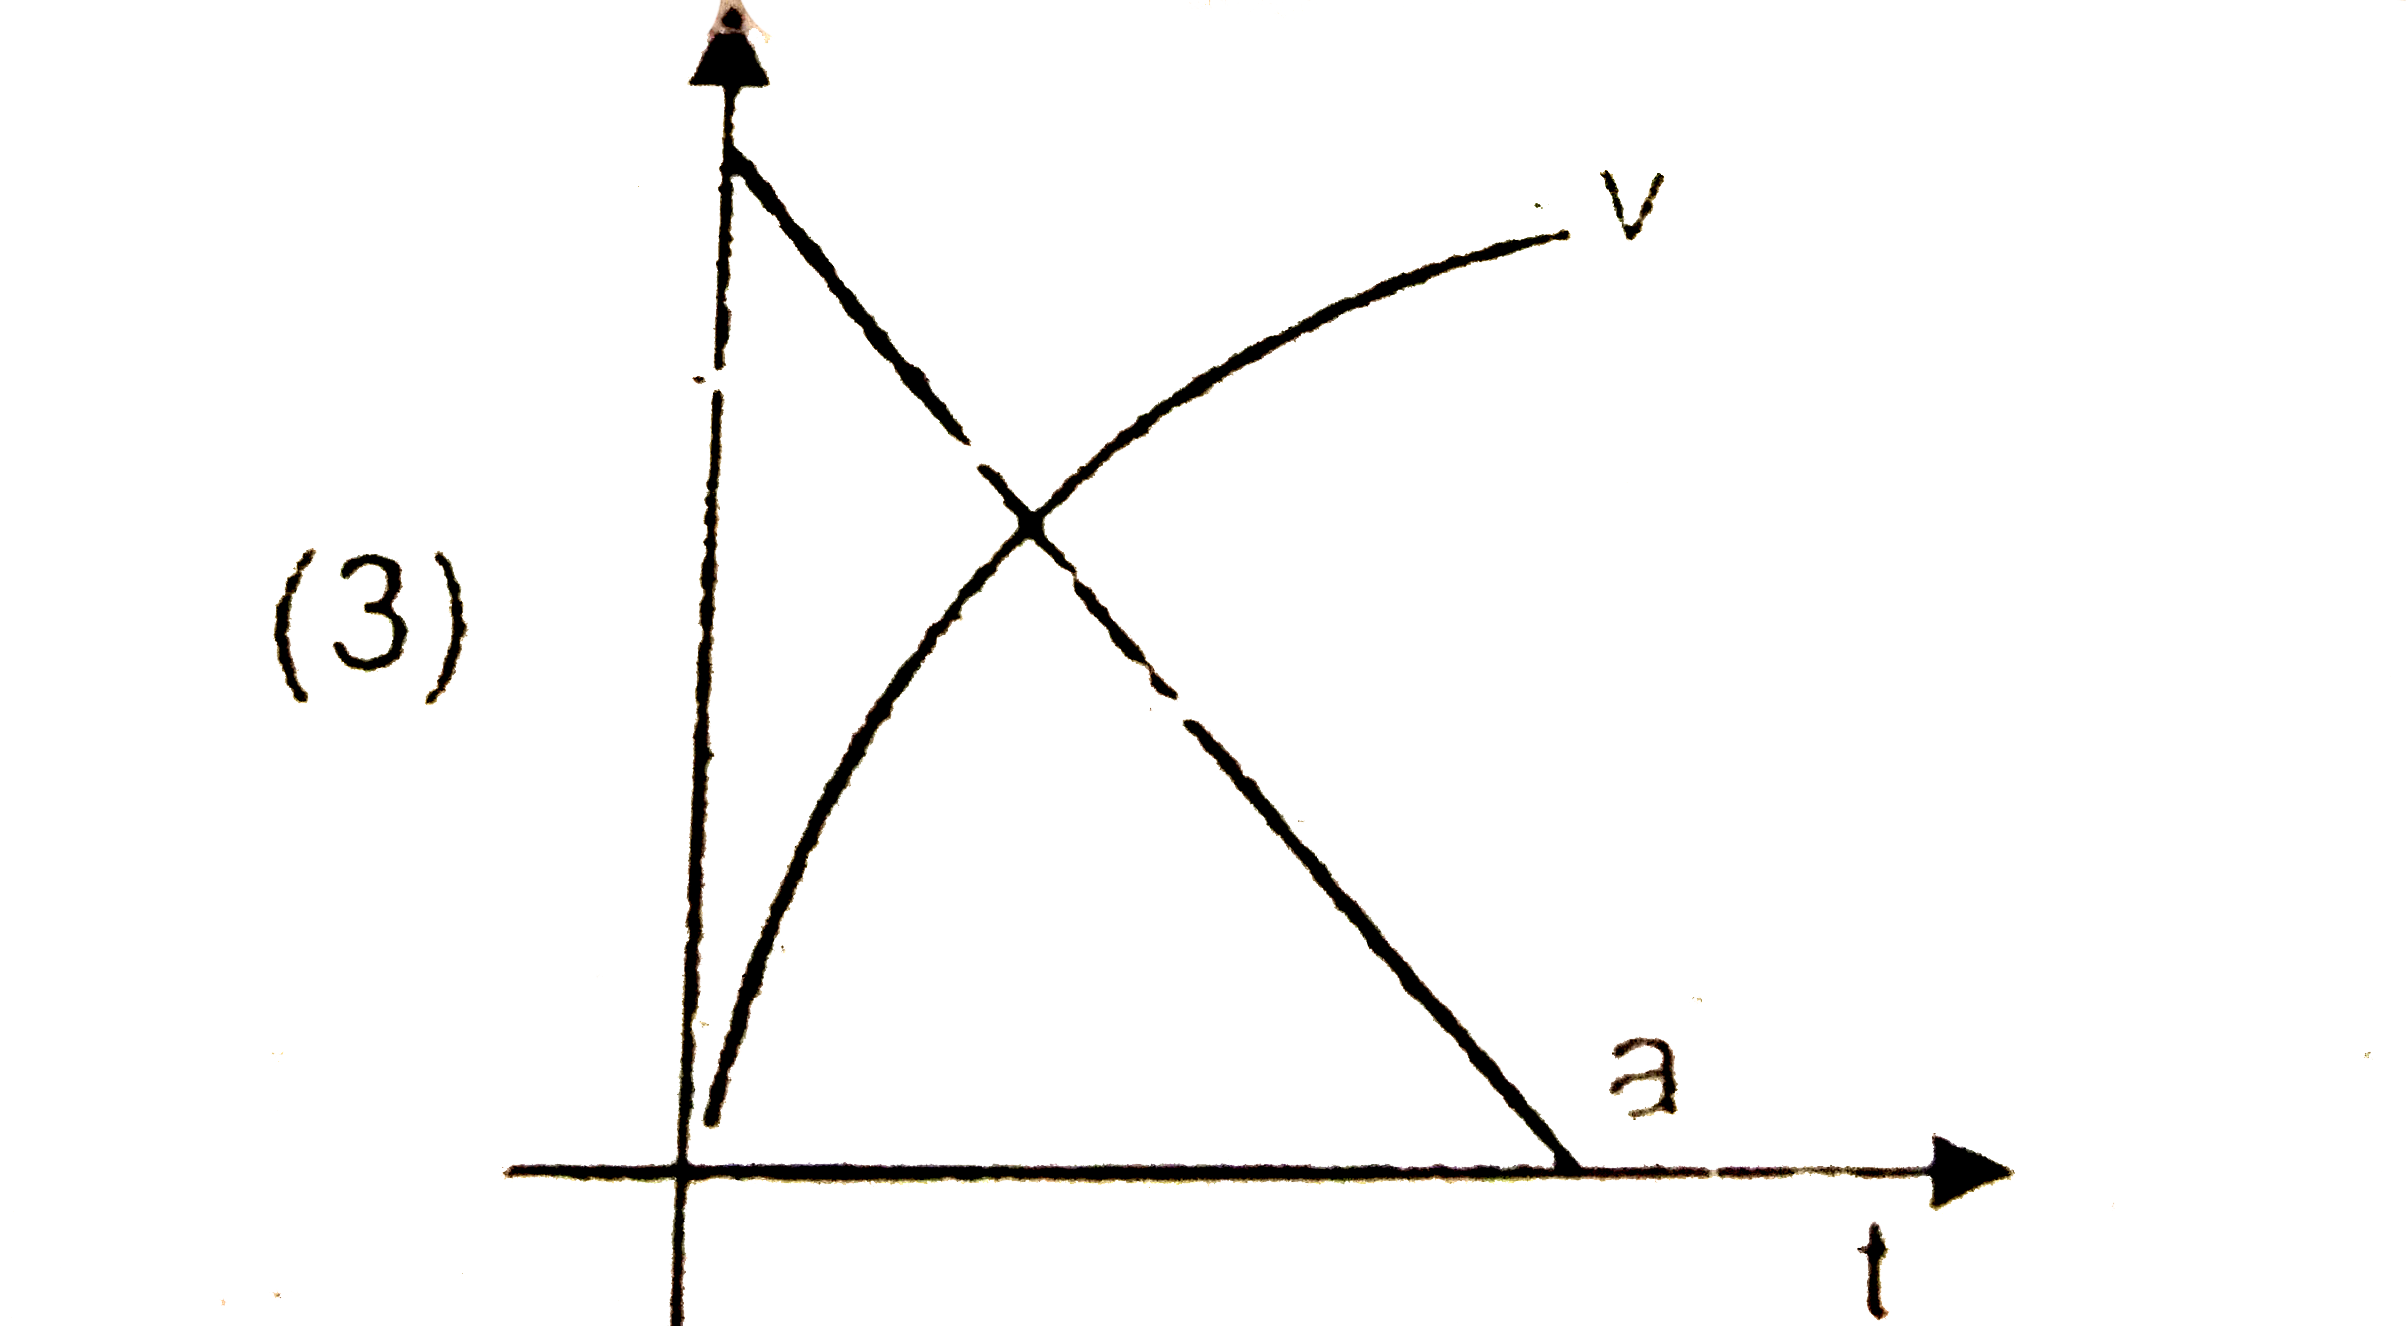
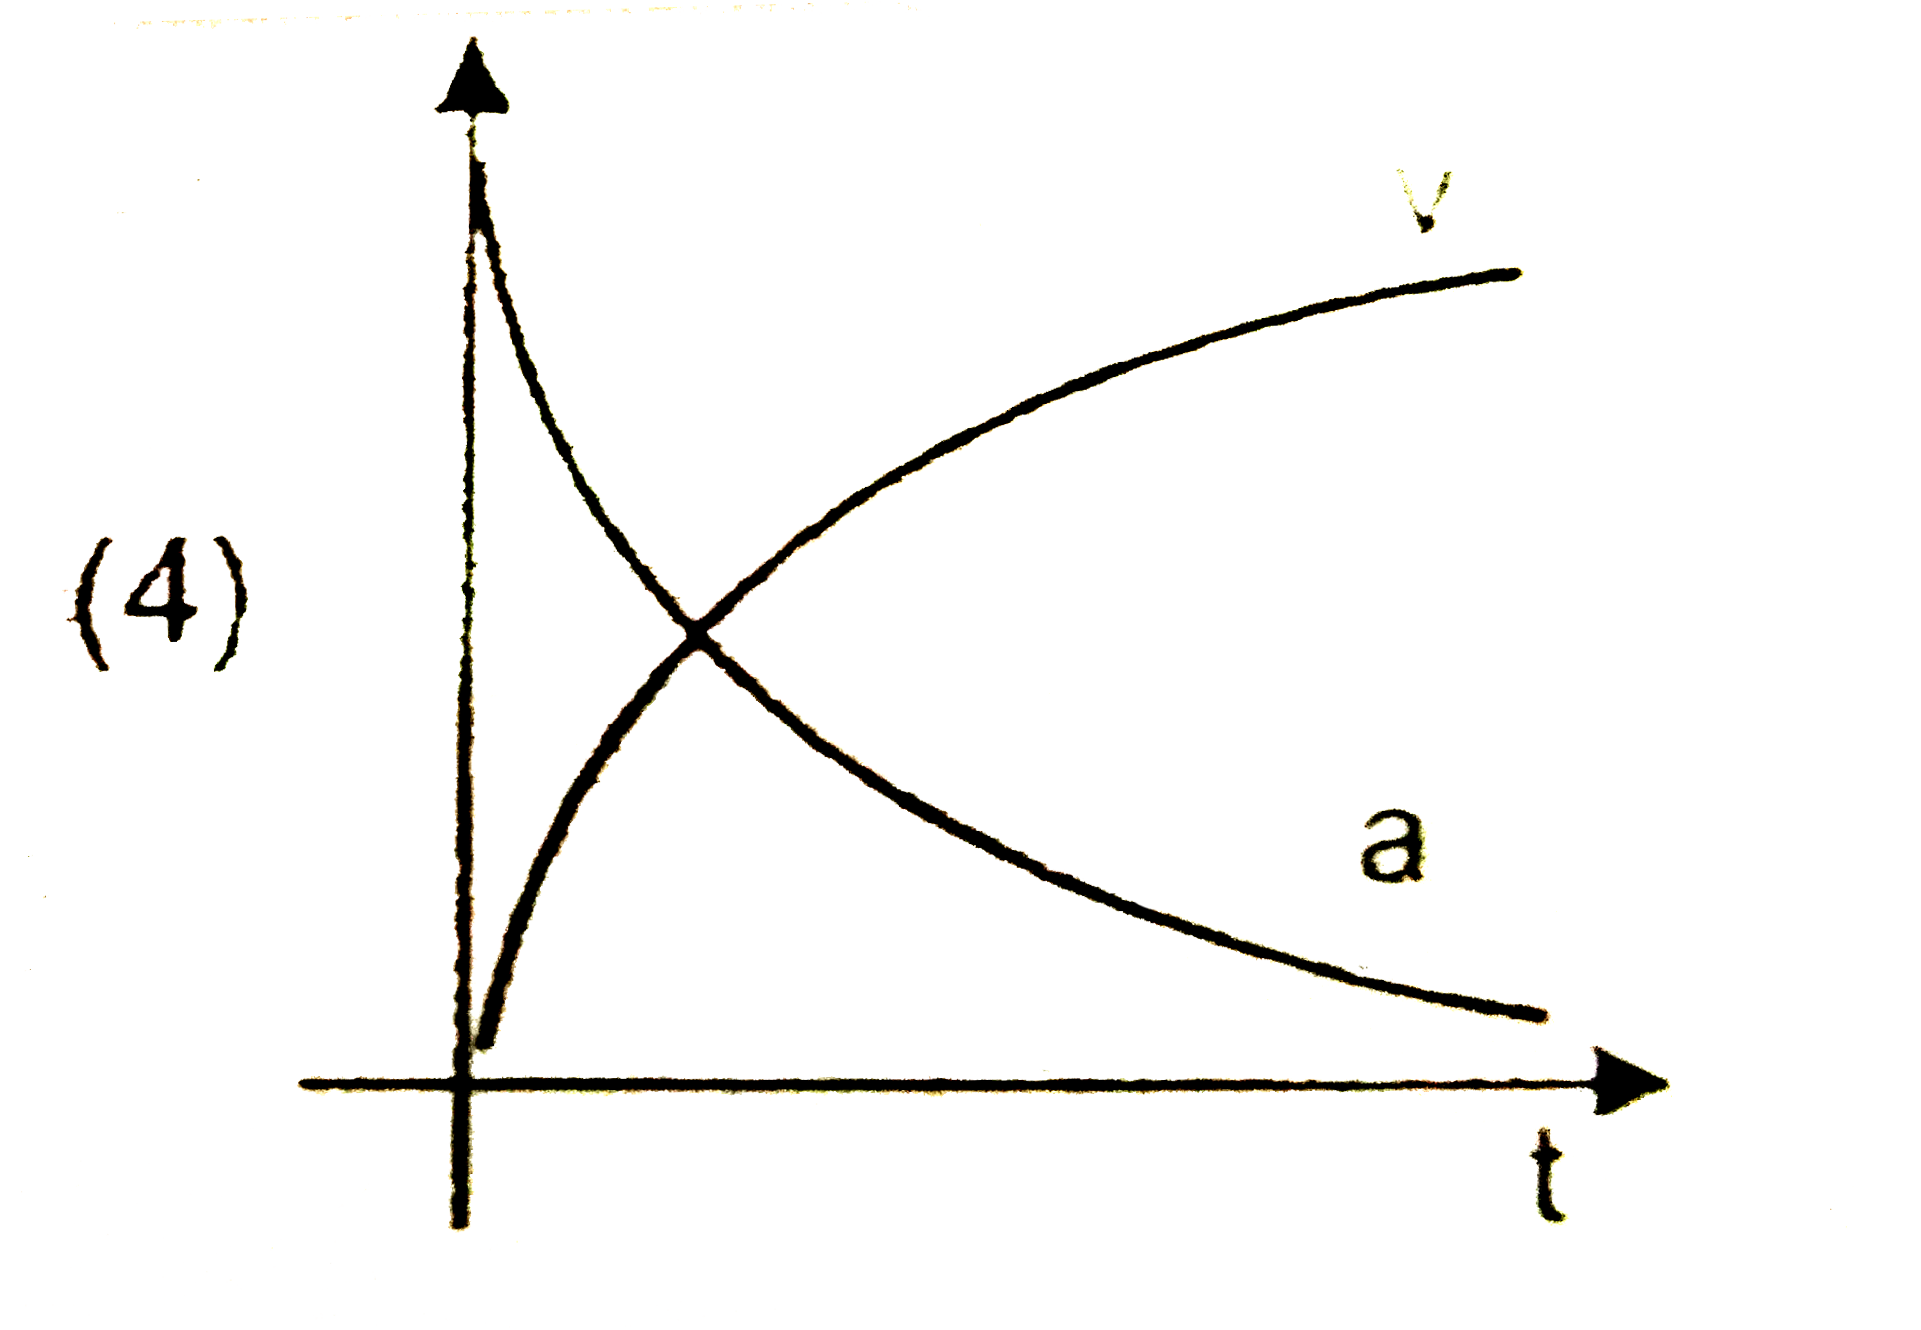
Which of the following option correctly describes the variation of the speed and acceleration 'a' of a point mass falling vertically in a viscous medium that applies a force F=−kv, where 'k' is constant, on the body?
(Graphs are schematic and drawn to scale)


The correct Answer is:D
To solve the problem, we need to analyze the motion of a point mass falling vertically in a viscous medium where the drag force is given by F=−kv. Here’s a step-by-step breakdown of the solution:
Step 1: Understand the Forces Acting on the Mass
When a mass m falls under the influence of gravity and experiences a drag force due to the viscous medium, the forces acting on it are:
- The gravitational force Fg=mg acting downward.
- The drag force Fd=−kv acting upward.
Step 2: Write the Equation of Motion
Using Newton's second law, we can write the equation of motion for the mass:
ma=mg−kv
Where:
- a is the acceleration of the mass.
- g is the acceleration due to gravity.
- v is the velocity of the mass.
Step 3: Rearranging the Equation
Rearranging the equation gives us:
ma=mg−kv⟹a=g−kmv
Step 4: Analyze the Behavior as Time Progresses
1. Initial Condition: At t=0, the mass starts from rest, so v(0)=0.
2. As Time Increases:
- The velocity v will increase due to the gravitational force.
- The drag force kv will also increase with v, which will reduce the acceleration a.
Step 5: Terminal Velocity
Eventually, the mass will reach a terminal velocity vt where the acceleration becomes zero:
0=mg−kvt⟹kvt=mg⟹vt=mgk
At this point, the forces balance out, and the mass falls with constant velocity.
Step 6: Behavior of Acceleration
- Initially, the acceleration a is equal to g (maximum).
- As the velocity increases, the acceleration decreases due to the increasing drag force.
- At terminal velocity, the acceleration becomes zero.
Step 7: Graphical Representation
- The graph of velocity v vs. time t will show an increasing curve that approaches vt asymptotically.
- The graph of acceleration a vs. time t will show a decreasing curve starting from g and approaching zero.
Conclusion
Based on the analysis, the correct option would be the one that shows:
- Velocity starting from zero and increasing towards terminal velocity.
- Acceleration starting from g and decreasing towards zero.
When a mass m falls under the influence of gravity and experiences a drag force due to the viscous medium, the forces acting on it are:
- The gravitational force Fg=mg acting downward.
- The drag force Fd=−kv acting upward.
Using Newton's second law, we can write the equation of motion for the mass:
ma=mg−kv
Where:
- a is the acceleration of the mass.
- g is the acceleration due to gravity.
- v is the velocity of the mass.
Rearranging the equation gives us:
ma=mg−kv⟹a=g−kmv
1. Initial Condition: At t=0, the mass starts from rest, so v(0)=0.
2. As Time Increases:
- The velocity v will increase due to the gravitational force.
- The drag force kv will also increase with v, which will reduce the acceleration a.
Eventually, the mass will reach a terminal velocity vt where the acceleration becomes zero:
0=mg−kvt⟹kvt=mg⟹vt=mgk
At this point, the forces balance out, and the mass falls with constant velocity.
- Initially, the acceleration a is equal to g (maximum).
- As the velocity increases, the acceleration decreases due to the increasing drag force.
- At terminal velocity, the acceleration becomes zero.
- The graph of velocity v vs. time t will show an increasing curve that approaches vt asymptotically.
- The graph of acceleration a vs. time t will show a decreasing curve starting from g and approaching zero.
Based on the analysis, the correct option would be the one that shows:
- Velocity starting from zero and increasing towards terminal velocity.
- Acceleration starting from g and decreasing towards zero.
Topper's Solved these Questions
- TEST PAPERSBOOK - RESONANCE ENGLISHCHAPTER - TEST PAPERSEXERCISE - PART - II PHYSICS
106 Videos
- SIMPLE HARMONIC MOTION BOOK - RESONANCE ENGLISHCHAPTER - SIMPLE HARMONIC MOTION EXERCISE - Advanced Level Problems
13 Videos
- TEST SERIESBOOK - RESONANCE ENGLISHCHAPTER - TEST SERIESEXERCISE - PHYSICS
130 Videos
Similar Questions
From amongst the following curves, which one shows the variation of the velocity v with time t for a small sized spherical body falling vertically in a long column of a viscous liquid
View SolutionIn a uniform electric field, a point charge of mass m and charge q is released from rest. If there are no other forces acting on the particle, then which of the following graphs, correctly show the dependence of the particles speed v on the distance x travelled by the particles speed v on the distance x travelled by it? [Graphs are schmatic and not drawn to scale]
View SolutionA particle of mass and charge is released from rest in a uniform electric field. If there is no other force on the particle, the dependence of its kinetic energy on the distance travelled by it is correctly given by (graphs are schematic and not drawn to scale)
View SolutionA particle of mass and charge is released from rest in a uniform electric field. If there is no other force on the particle, the dependence of its kinetic energy on the distance travelled by it is correctly given by (graphs are schematic and not drawn to scale)
View SolutionFor a simple pendulum, a graph is plotted between itskinetic energy (KE) and potential energy (PE)against its displacement d. Which one of the following represents these correctly? (graph are schematic and not drawn to scale)
View SolutionA particle of mass m and charge −q is released from rest in a uniform electric field. If there is no other force on the particle, the dependence of its potential energy on the distance x travelled by it is correctly given by (assume initial potential energy to be zero ,graphs are schematic and not drawn to scale)
View SolutionA particle of mass m and charge −q is released from rest in a uniform electric field. If there is no other force on the particle, the dependence of its potential energy on the distance x travelled by it is correctly given by (assume initial potential energy to be zero ,graphs are schematic and not drawn to scale)
View SolutionThe velocity v of a particle of mass m changes with time t as d2vdt=−kv, where k is constant. Now, which of the following statements is correct?
View SolutionTwo stones are through up simultaneously from the edge of a cliff 240 m high with initial speed of 10 m/s and 40 m/s respectively. Which of the following graphs best represents the time variation of relative position of the second stone with respect to the first? Assume stones do not rebound after hitting the ground and neglect air resistance, take . g=10m/s2 (The figures are schematic and not drawn to scale)
View SolutionAssertion: The value of acceleration due to gravity does not depends upon mass of the body on which force is applied.
Reason: Acceleration due to gravity is a constant quantity.
View Solution