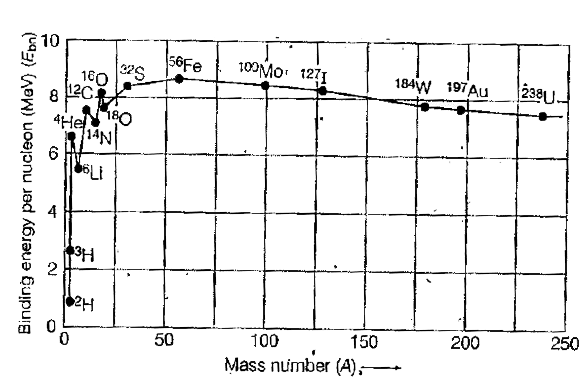
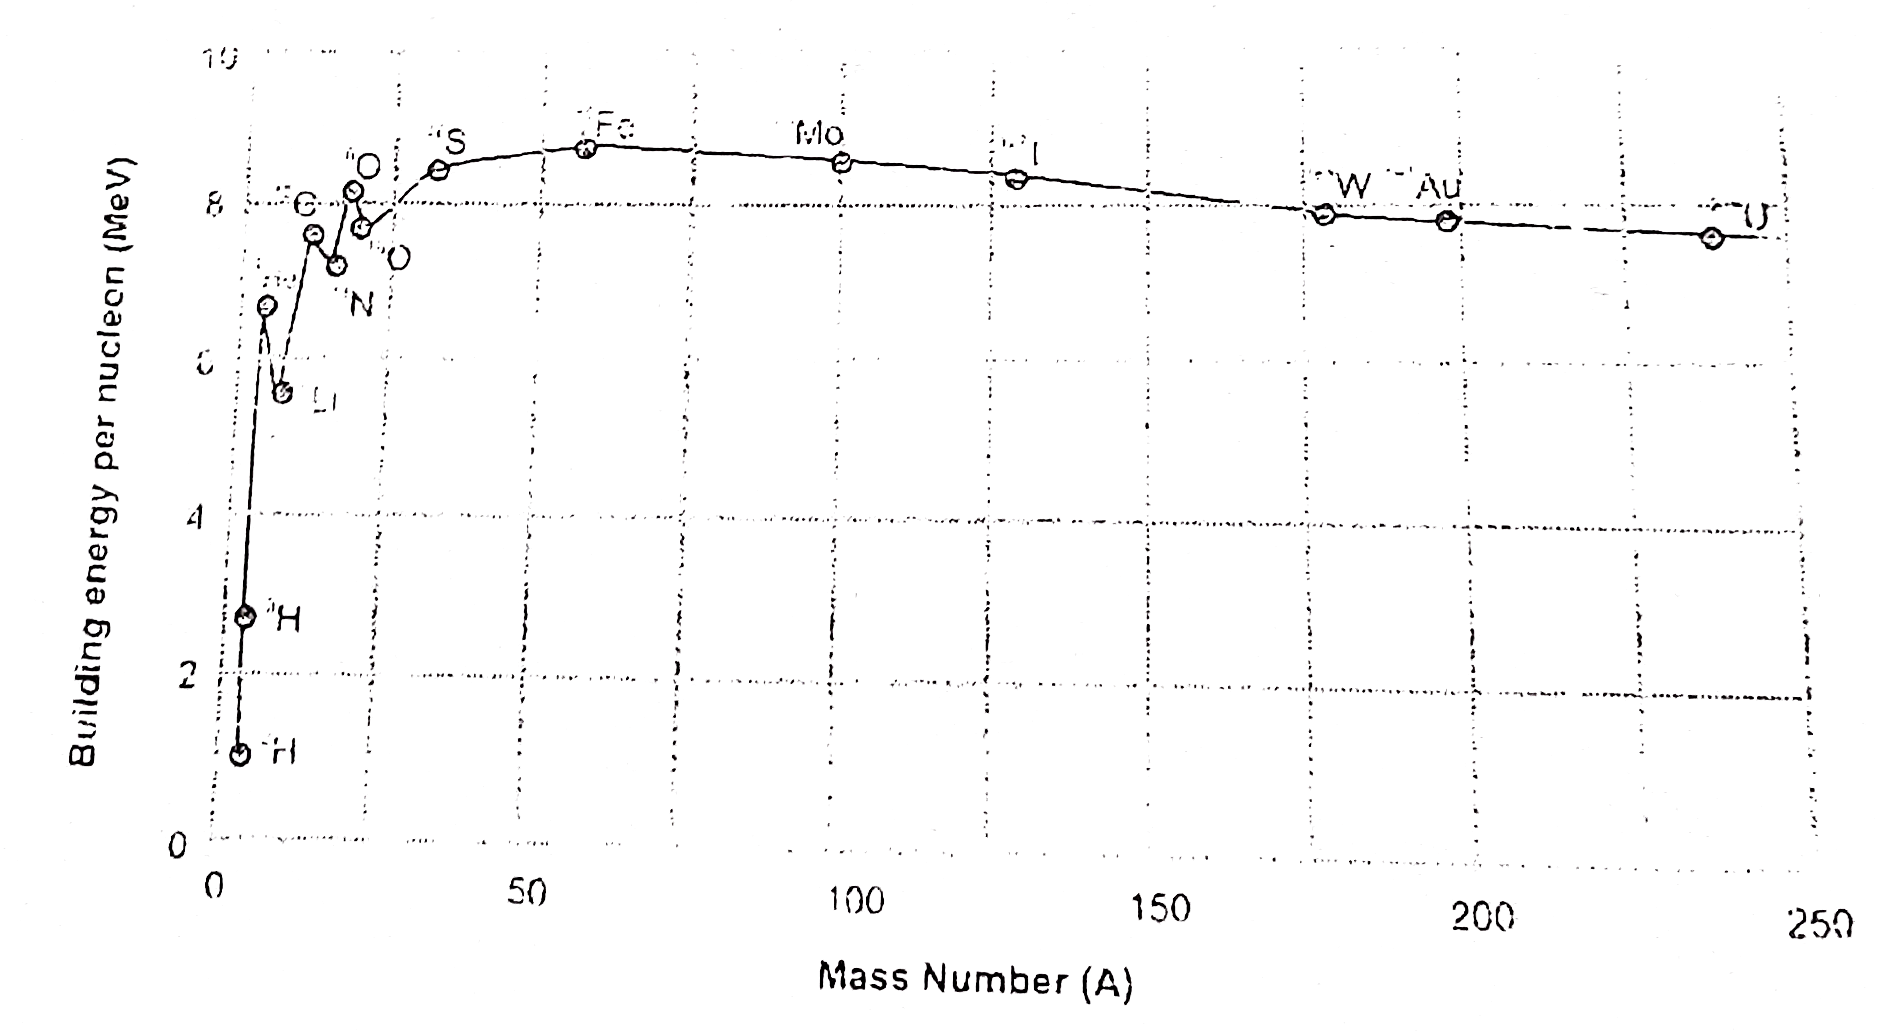
Draw the graph showing the variation of average binding energy per nucleon of a nucleus with its mass number. Explain nuclear fission and fusion on the basis of this graph.
Binding energy curve It is a plot the binding energy per nucleon Ebn versus the mass number A for a large number of nuclei .

Conclusions Following conclusions are obtained from the graph
(i) A very heavy nucleus A= 240 has lower Eba compared to that of a nucleus with A = 120. Thus, if a nucleus A=240 breaks into two A=120 nuclei, nucleons get more tightly bound. Energy would be released in this process (nuclear fission) (ii) When two light nuclei (A<10) join to form a heavier nucleus, Ebn of fused heavier nuclei is more than the Ebn of lighter nuclei-Energy would be released in this process (nuclear fusion).
Similar Questions
Draw the graph showing thervariation of binding energy per nucleon with mass number. Give therason for the decrease of binding energy per nucleon for nuclei with high mass numbers.

The binding energy per nucleon for nuclei with high mass number is low due to the large coulomb repulsion between the protons inside these nuclei.
View SolutionDraw a graph showing variation of binding energy per nucleon with mass number. Write two main inferences drawn from the graph.
View Solution
Knowledge Check
The binding energy per nucleon of nucleus is a measure of its.
AChargeBMassCMomentumDStabilityBinding energy per nucleon relation with mass number
Afirst decreases then increasesBfirst increases then decreasesCincreasesDdecreasesThe average binding energy per nucleon is maximum for the nucleus
A2He4B8O16C26Fe36D92U238
Draw a graph showing the variation of binding energy per nucleon with mass number of different nuclei. State two inferences from this graph.
View SolutionVARIATION OF BINDING ENERGY OF PER NUCLEON WITH MASS NUMBER
View SolutionAs the mass number increase binding energy per nucleon :
View SolutionIn the process of fission, the binding energy per nucleon
View SolutionAs the mass number A increases, the binding energy per nucleon in a nucleus.
View Solution
