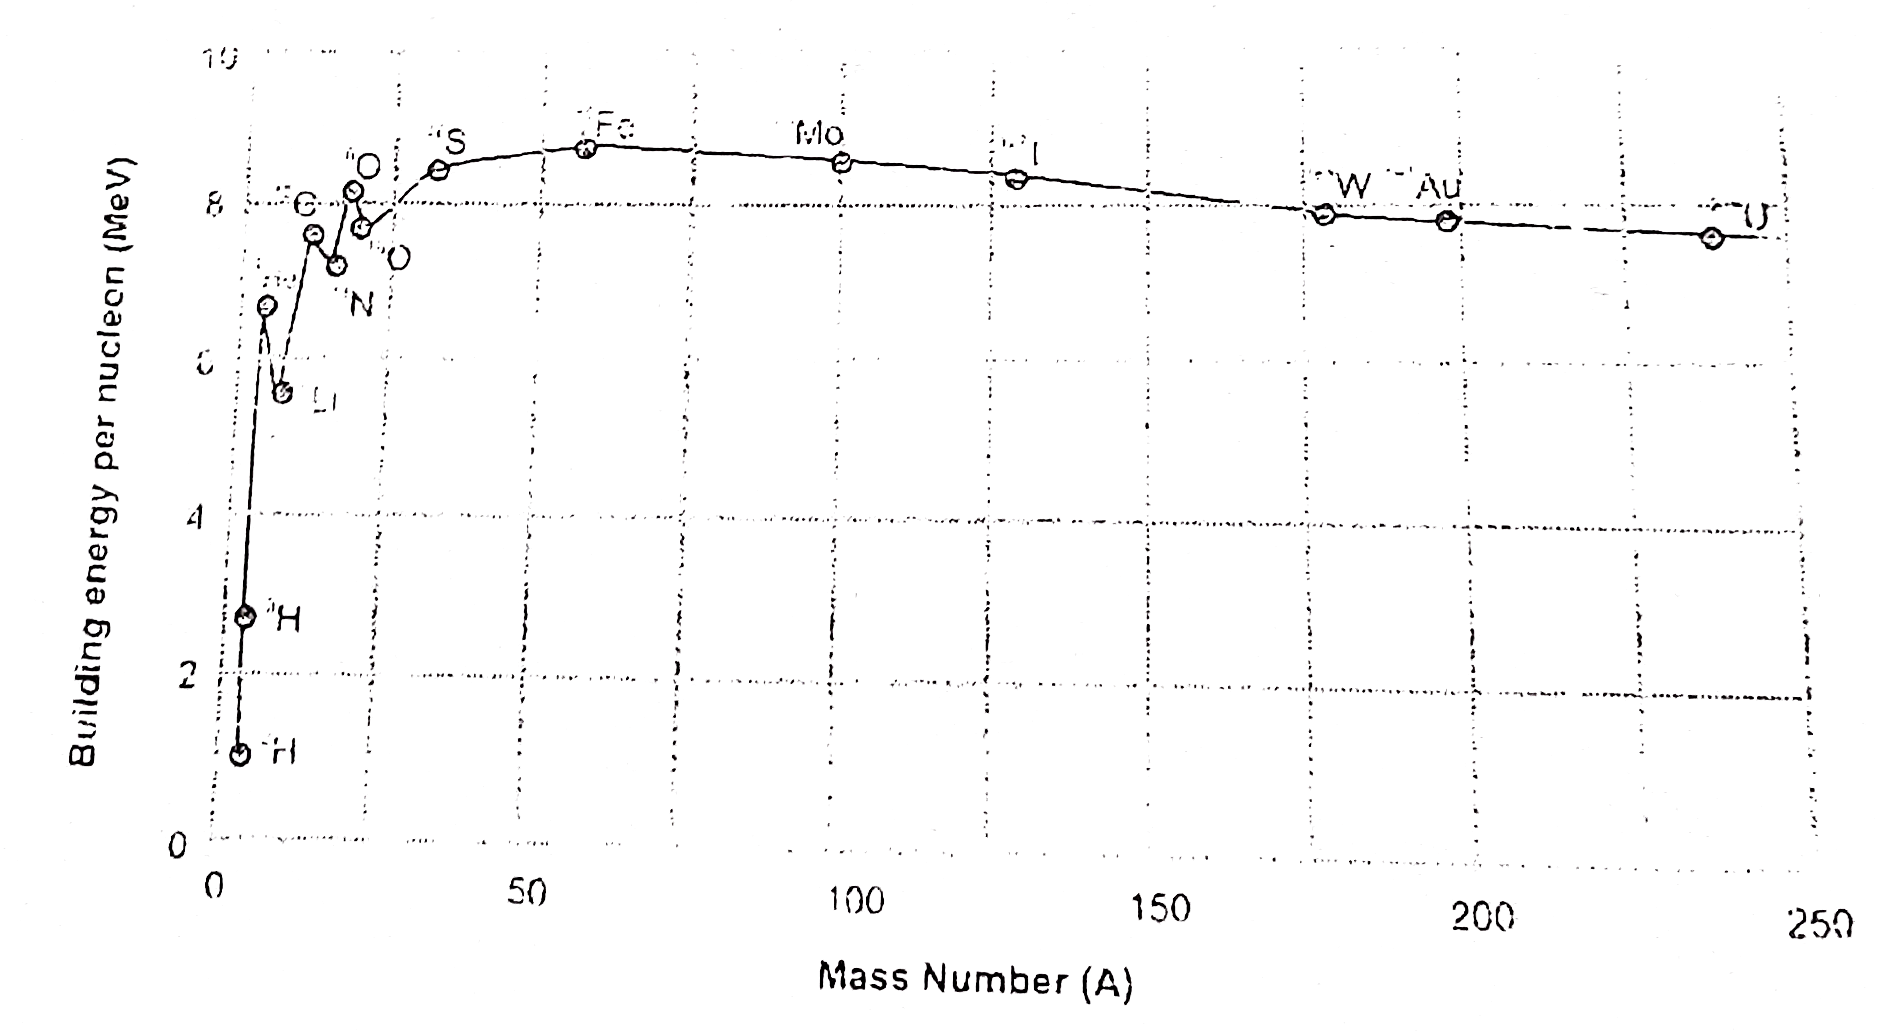
Draw a graph showing the variation of binding energy per nucleon with mass number of different nuclei. State two inferences from this graph.
The graph is shown in the

Two important inferences from this graph are :
(i) Nuclei in mass number range 30 - 170 are highly stable.
(ii) Nuclei of elements either having very small (A < 20) or very large (A > 208) value of mass number are unstable because their binding energy per nucleon is small.
Topper's Solved these Questions
- NUCLEIBOOK - U-LIKE SERIESCHAPTER - NUCLEIEXERCISE - Long Answer Question-I
22 Videos
- NUCLEIBOOK - U-LIKE SERIESCHAPTER - NUCLEIEXERCISE - Long Answer Question-II
2 Videos
- NUCLEIBOOK - U-LIKE SERIESCHAPTER - NUCLEIEXERCISE - Very Short Answer Question
30 Videos
- MOVING CHARGES AND MAGNETISM BOOK - U-LIKE SERIESCHAPTER - MOVING CHARGES AND MAGNETISM EXERCISE - SELF ASSESSMENT TEST (SECTION D)
1 Videos
- RAY OPTICS AND OPTICAL INSTRUMENTSBOOK - U-LIKE SERIESCHAPTER - RAY OPTICS AND OPTICAL INSTRUMENTSEXERCISE - SELF ASSESSMENT TEST (SECTION B)
3 Videos
Similar Questions
Knowledge Check
Binding energy per nucleon relation with mass number
Afirst decreases then increasesBfirst increases then decreasesCincreasesDdecreases
Draw the graph showing thervariation of binding energy per nucleon with mass number. Give therason for the decrease of binding energy per nucleon for nuclei with high mass numbers.

The binding energy per nucleon for nuclei with high mass number is low due to the large coulomb repulsion between the protons inside these nuclei.
View SolutionDraw the graph to show variation of binding energy per nucleon with mass number of different atomic nuclei. Calculate binding energy per nucleon of 4020Ca nucleus. Given : mass of 4020Ca=39.962589u, mass of proton=1.007825 u, mass of neutron=1.008665 u and 1 u=931 MeV/c2.
View SolutionDraw the graph showing the variation of binding energy per nucleon with mass number. Give the reason for the decrease of binding energy per nucleon for nuclei with high mass numbers.
View SolutionVARIATION OF BINDING ENERGY OF PER NUCLEON WITH MASS NUMBER
View SolutionDraw the graph showing thervariation of binding energy per nucleon with mass number. Give therason for the decrease of binding energy per nucleon for nuclei with high mass numbers.

The binding energy per nucleon for nuclei with high mass number is low due to the large coulomb repulsion between the protons inside these nuclei.
View SolutionDraw the graph showing thervariation of binding energy per nucleon with mass number. Give therason for the decrease of binding energy per nucleon for nuclei with high mass numbers.

The binding energy per nucleon for nuclei with high mass number is low due to the large coulomb repulsion between the protons inside these nuclei.
View Solution(a) Draw a graph showing the variation of binding energy per nucleon (BE/A) vs mass number A for the nuclei in 20≤A≤170.
(b) A nucleus of mass number 240 and having binding energy/nucleon 7.6 MeV splits into two fragments Y, Z of mass numbers 110 and 130 respectively. If the binding energy/nucleon of Y, Z is equal to 8.5 MeV each, calculate the energy released in the nuclear reaction
View Solution
