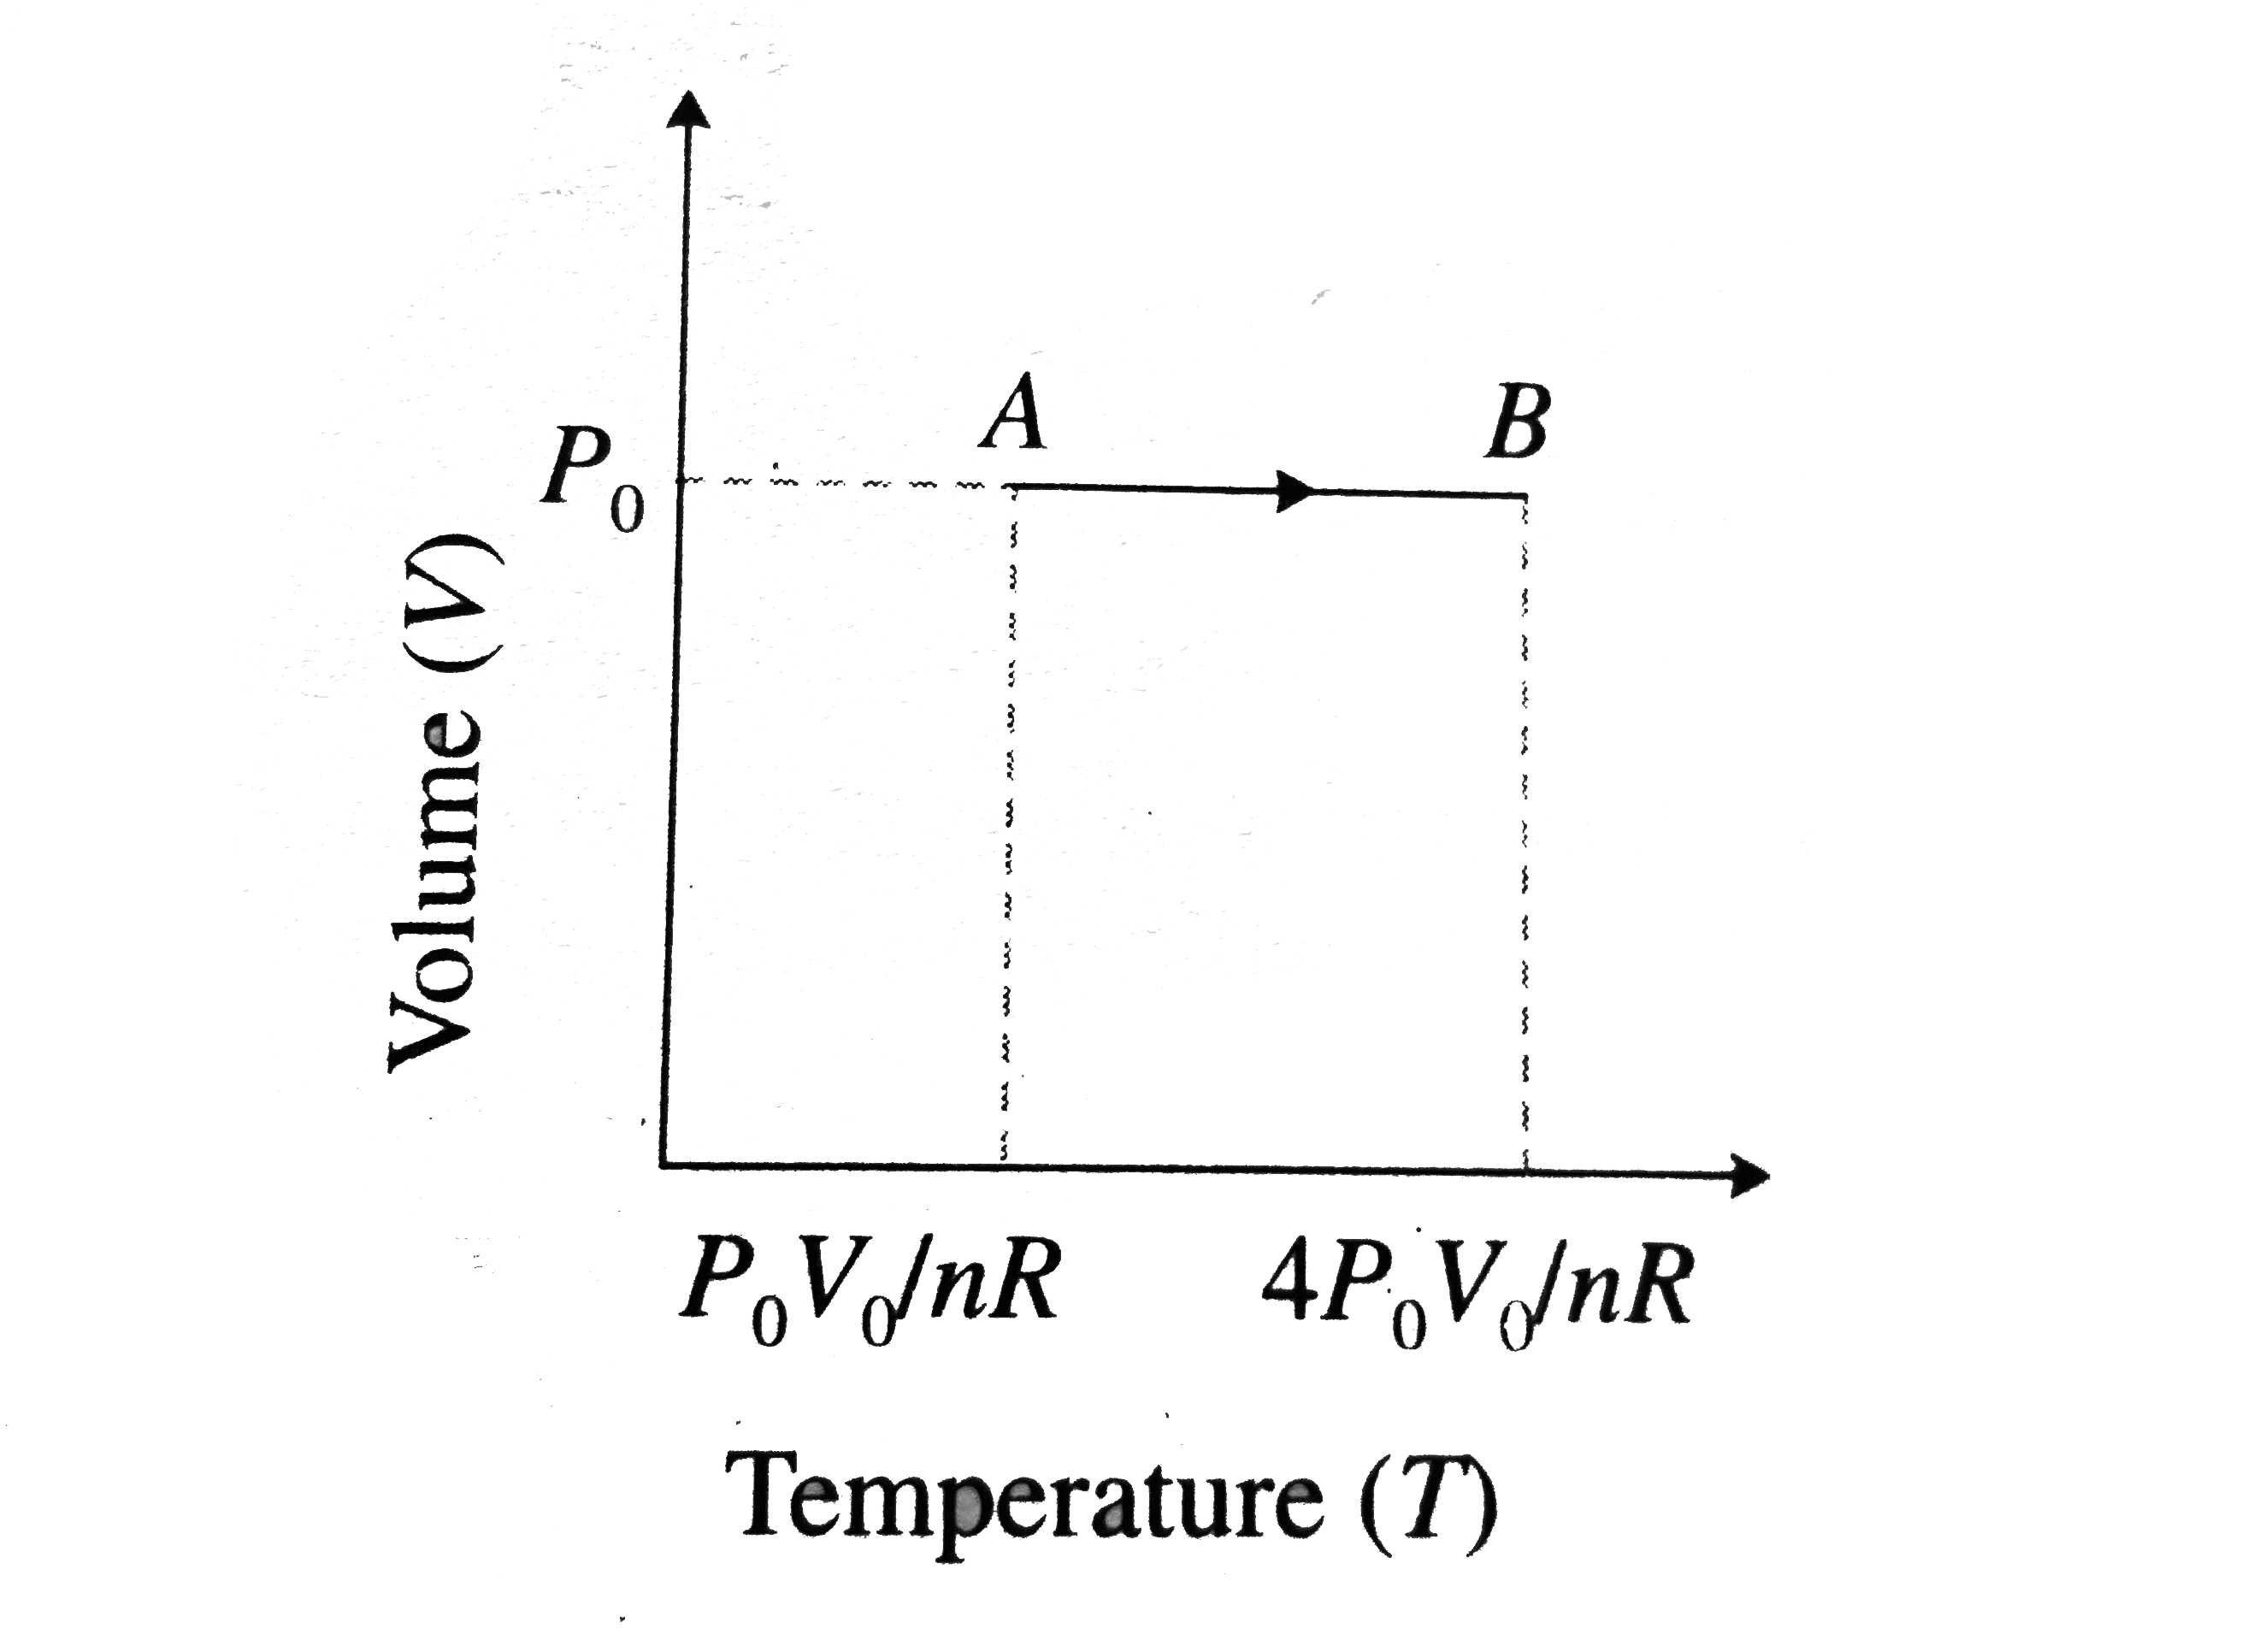
Draw the P-T and V-T diagrams of an isochoric process of n moles an ideal gas from pressure P0 volume V0 to pressure 4P0, indicating the pressures and temperatures of the gas in the initial and the final states.
From the equation of state for an ideal gas PV=nRT, we get the following.
(a) P=nRTV , i.e, P∝T(v=constant)
At P=P0, and V=V0, we get T=P0V0/nR
And at P=4P0,V+V0, we get T=4P0V0/nR
The graph is a straight line (passing through the origin, When produced) shown in Fig

Since temperature increases from P0V0nR t o 4P0V0nR
Volume remains constant, so, the graph of V-T will be as shown in Fig.

Topper's Solved these Questions
- KINETIC THEORY OF GASES AND FIRST LAW OF THERMODYNAMICSBOOK - CENGAGE PHYSICSCHAPTER - KINETIC THEORY OF GASES AND FIRST LAW OF THERMODYNAMICSEXERCISE - Solved Examples
14 Videos
- KINETIC THEORY OF GASES AND FIRST LAW OF THERMODYNAMICSBOOK - CENGAGE PHYSICSCHAPTER - KINETIC THEORY OF GASES AND FIRST LAW OF THERMODYNAMICSEXERCISE - Exercise 2.1
20 Videos
- KINETIC THEORY OF GASESBOOK - CENGAGE PHYSICSCHAPTER - KINETIC THEORY OF GASESEXERCISE - Compression
2 Videos
- LINEAR AND ANGULAR SIMPLE HARMONIC MOTIONBOOK - CENGAGE PHYSICSCHAPTER - LINEAR AND ANGULAR SIMPLE HARMONIC MOTIONEXERCISE - Multiple Correct Answer Type
9 Videos
Similar Questions
Knowledge Check
The pressure p and volume V of an ideal gas both increase in a process.
Asuch a process is not possible.BThe work done by the system is positive.CThe tempreture of the system must increase.DHeat supplied to the gas is equal to the change in internal energy.The pressure P and volume V of an ideal gas both decreases in a process.
Asuch a process is not possible.BThe work done by the system is positive.CThe tempreture of the system must increase.DHeat supplied to the gas is equal to the change in internal energy.Thermal coefficient of volume expansion at constant pressure for an ideal gas sample of n moles having pressure P0, volume V0, and temperature T0 is
ARP0V0BP0V0RC1T0D1nT0
The pressure (P) and volume (V) of an ideal gas both increase in a process:
View SolutionAn ideal gas has pressure P, volume V and temperature T. Select the correct option.
View SolutionAn inflated rubber balloon contains one mole of an ideal gas has a pressure p, volume V and temperature T. if the temperature rises to 1.1 T, and the volume is increased to 1.05 V, the final pressure will be
View SolutionAn inflated rubber ballon contains one mole of an ideal gas , has a pressure P, volume V and temperature T. If the temperature rises to 1.1 T, and the volume isincreased to 1.05 V, the final pressure will be
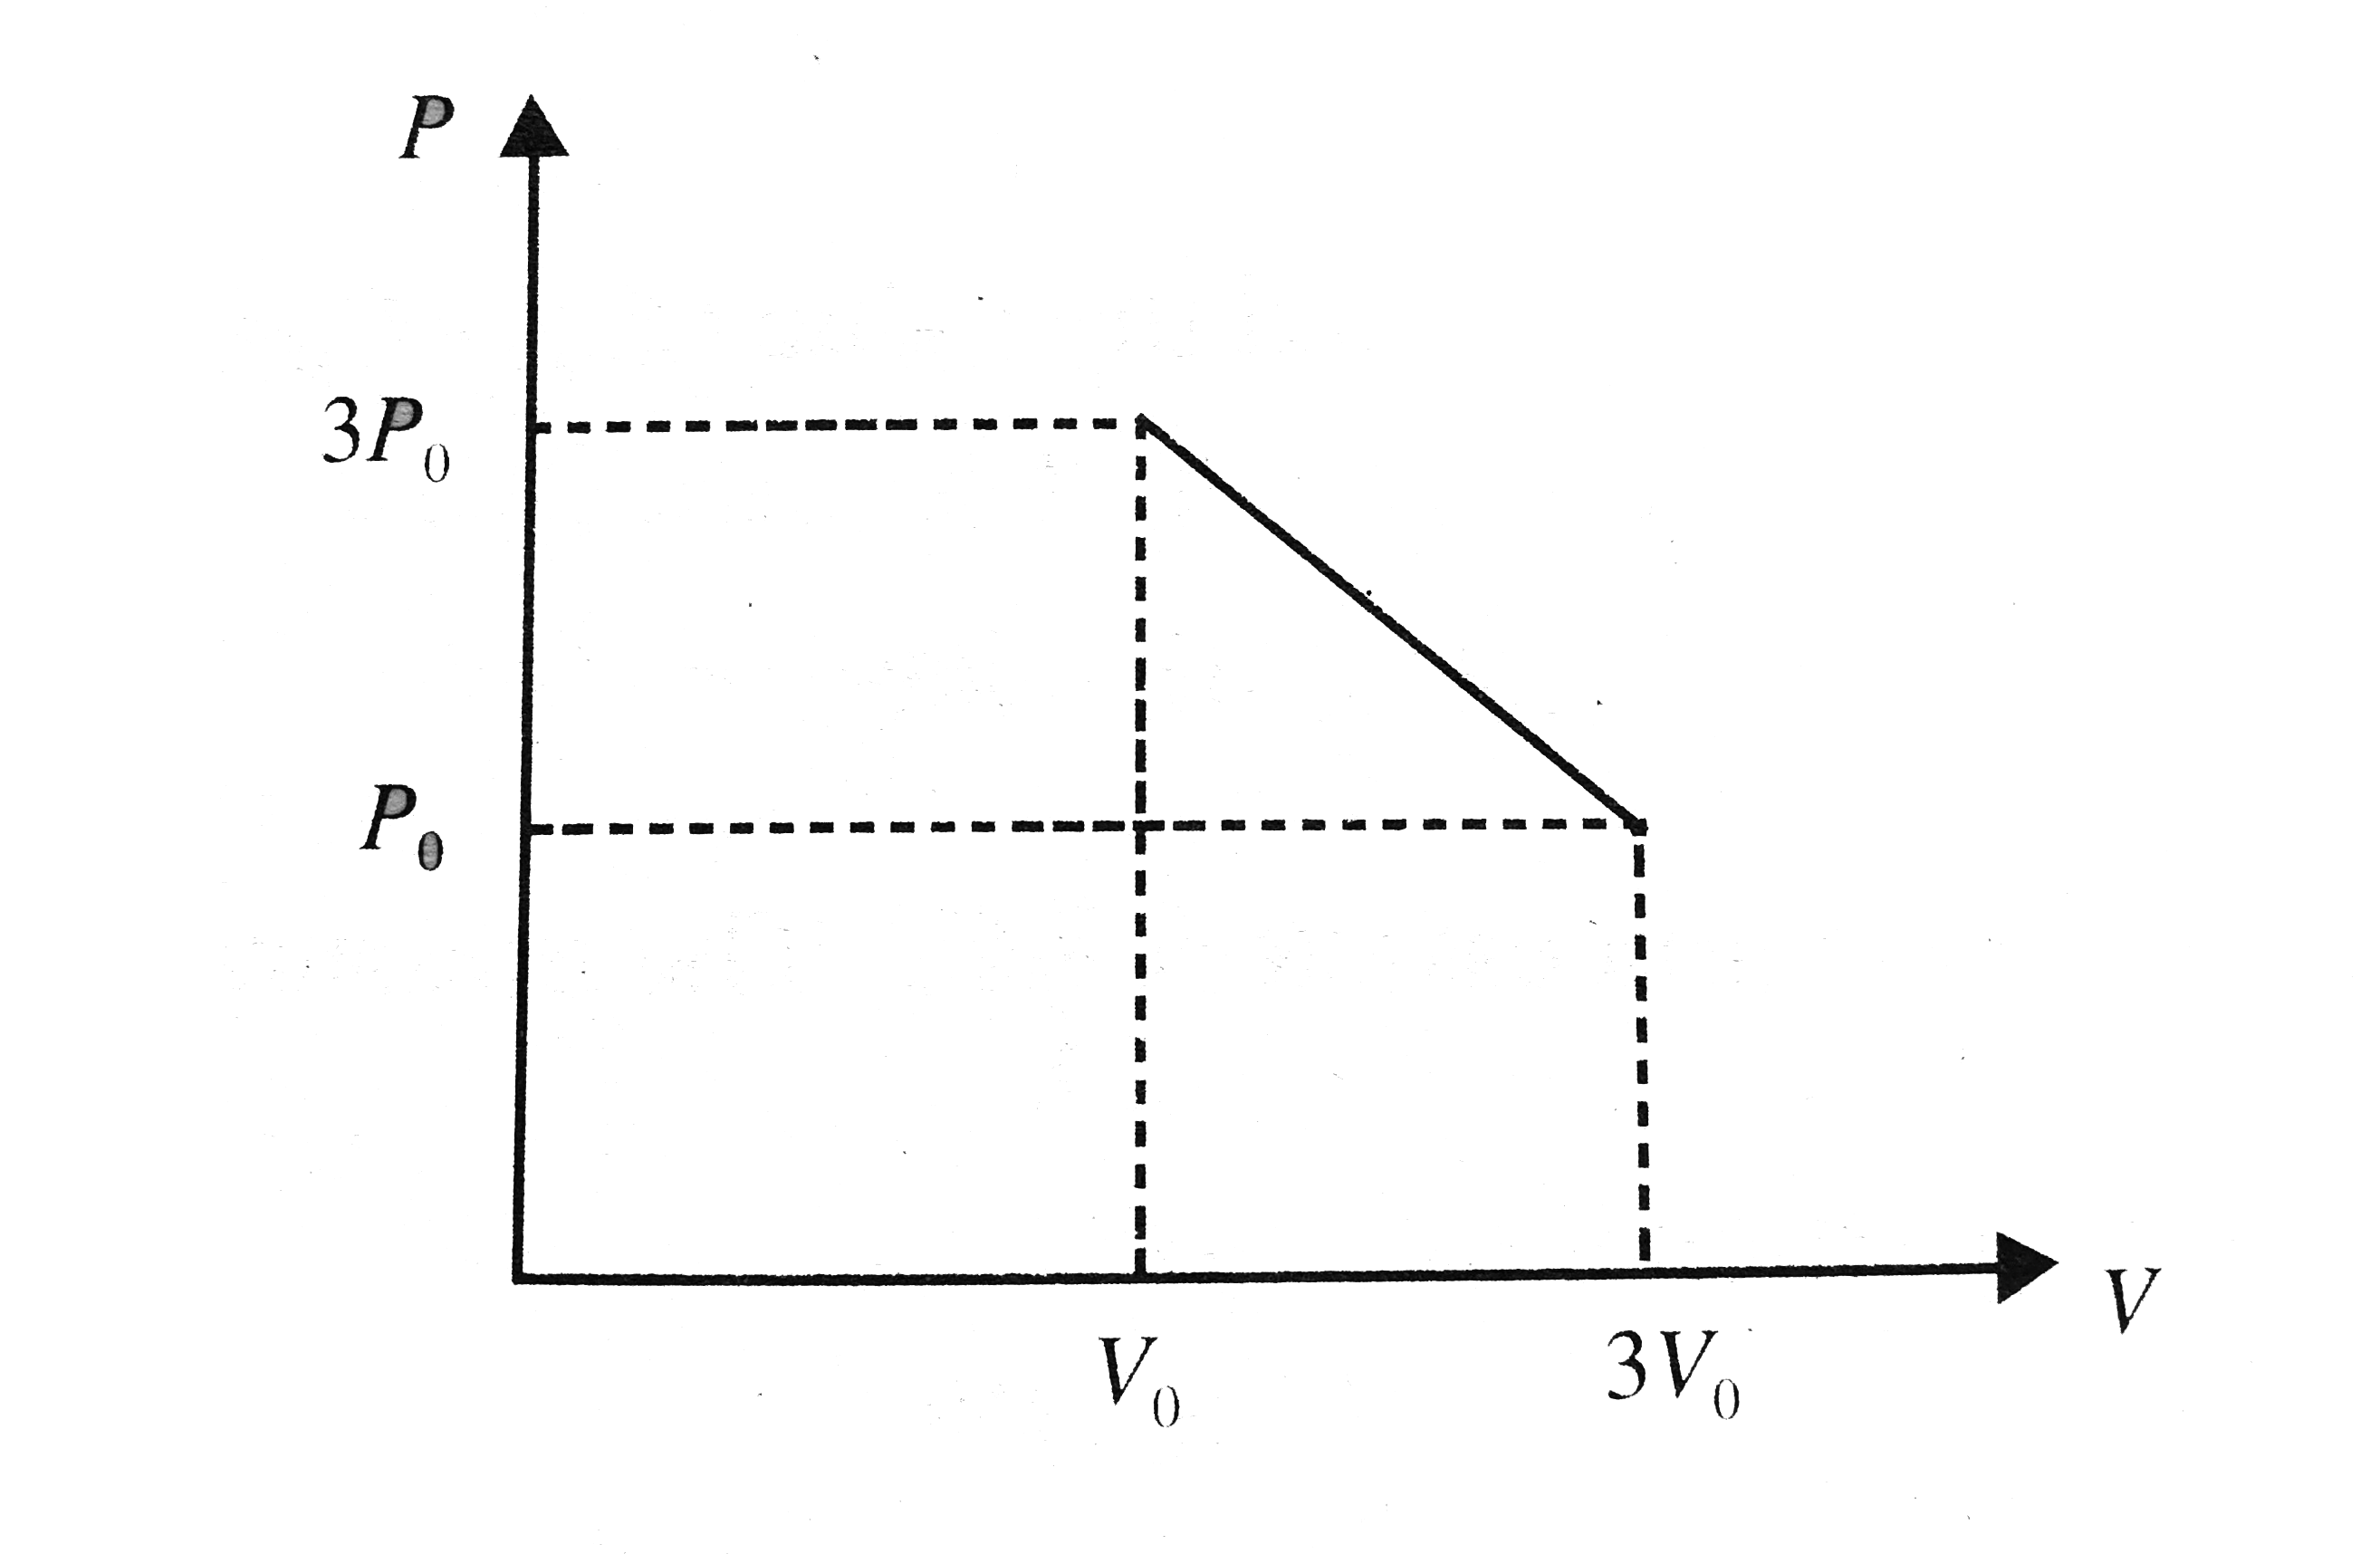
View Solutionn moles of gas in a cylinder under a piston is transferred infinintley slowly from a state with a volume of V0 and a pressure 3P0 to a state with a volume of 3V0 and a pressure P0 as shown in Fig. The maximum temperature that gas will reach in this process is

View Solution
