Draw the x→t graphs which represent the positive, negative and zero velocity
 Solution in Gujrati
In graph (a), the position increases with respect to time, hence the average velocity is positive.
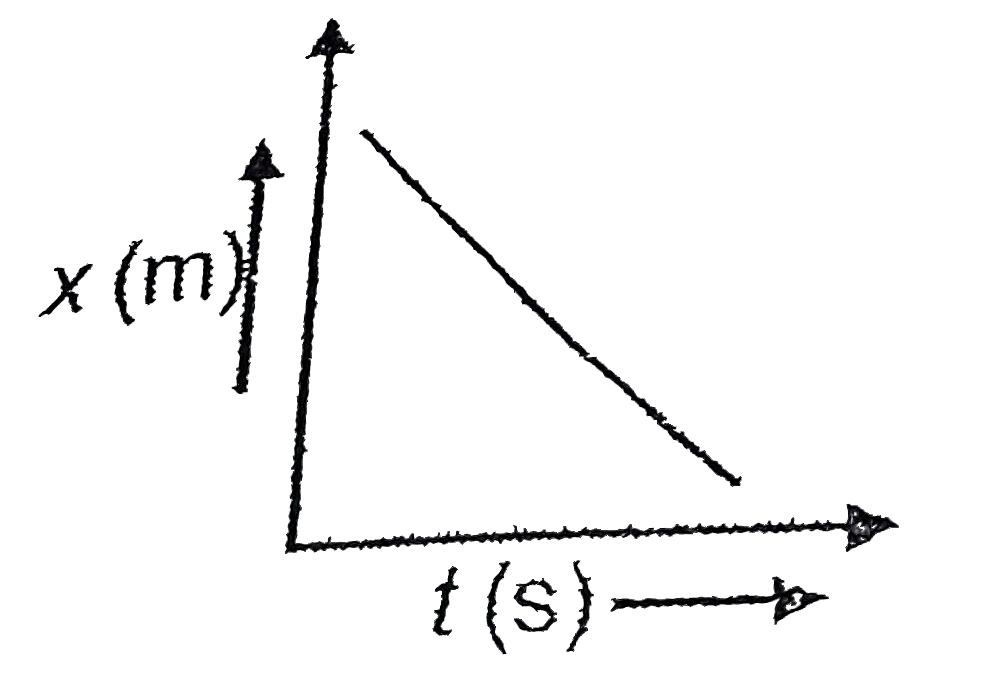
In graph (b), the position decreases with respect to time, hence the average velocity is negative.
In graph (c), the position doesn.t change with respect to time, hence the average velocity is zero.
Topper's Solved these Questions
- BOOK - KUMAR PRAKASHANCHAPTER - MOTION IN A STRAIGHT LINE EXERCISE - SECTION-A TRY YOUR SELF (VSQs)52videos
MOTION IN A STRAIGHT LINE
- BOOK - KUMAR PRAKASHANCHAPTER - MOTION IN A STRAIGHT LINE EXERCISE - SECTION-B58videos
MOTION IN A STRAIGHT LINE
- BOOK - KUMAR PRAKASHANCHAPTER - MECHANICAL PROPERTIES OF FLUIDS EXERCISE - QUESTION PAPER (SECTION -C)3videos
MECHANICAL PROPERTIES OF FLUIDS
- BOOK - KUMAR PRAKASHANCHAPTER - OBJECTIVE QUESTIONS AS PER NEW PAPER STYLE EXERCISE - CHAPTER - 8 (Match Type questions)5videos
OBJECTIVE QUESTIONS AS PER NEW PAPER STYLE
Similar Questions
How can we determine whether the object is in rest or not?
01:33View SolutionA car is moving along a straight line, say OP in It move from O to P in 18 s and returns from P to Q in 6s, where OP=360 m and OQ=240 m. What are the average velocity and average speed of the car in going (a) from O to P ? And (b) from O to P and back to Q ?
02:13View SolutionGlycerine flows steadily through a horizontal tube of length 1.5m and radius 1.0 cm . If the amount of glycerine collected per second at one is 4.0×10⁻³kgs−1 , what is the pressure difference between the two ends of the tube ? (Density of glycerine =1.3×10103kgm−3 and viscosity of glycerine =0.83 Pa s). [ you may also like to check if the assumption of laminar flow in the tube is correct]
02:27View SolutionType of satellites are given in Column-I and their uses are given in Column-II. Match them properly :
Column-IColumn-II(1) Polar satellite(a) Tele communication(2) Geo-stationary satellite(b) Investigation(c) For information about atmosphere01:55View SolutionDraw position-time graphs for two objects having zero relative velocity.
05:08View SolutionWhich of the following graph(s) represent retardation ? [v : velocity, t : time, x : position]
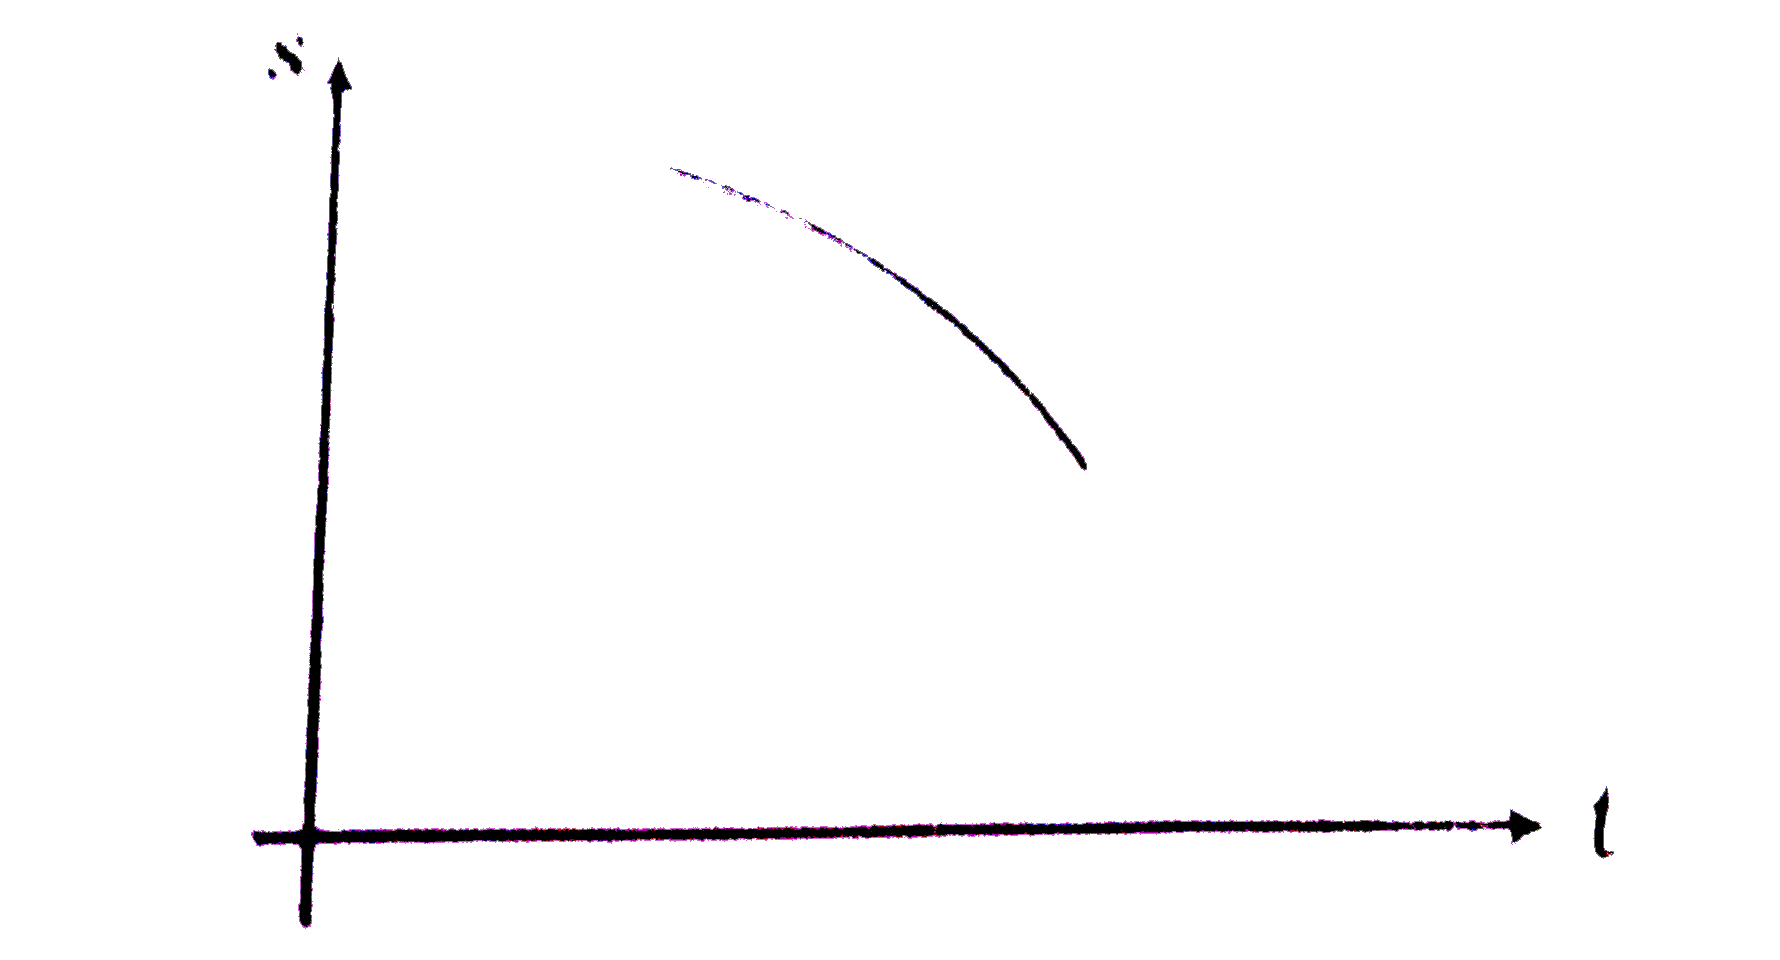
01:28View SolutionAssertion : In the s-t graph as shown in figure, velocity of particle is negative and acceleration is positive.

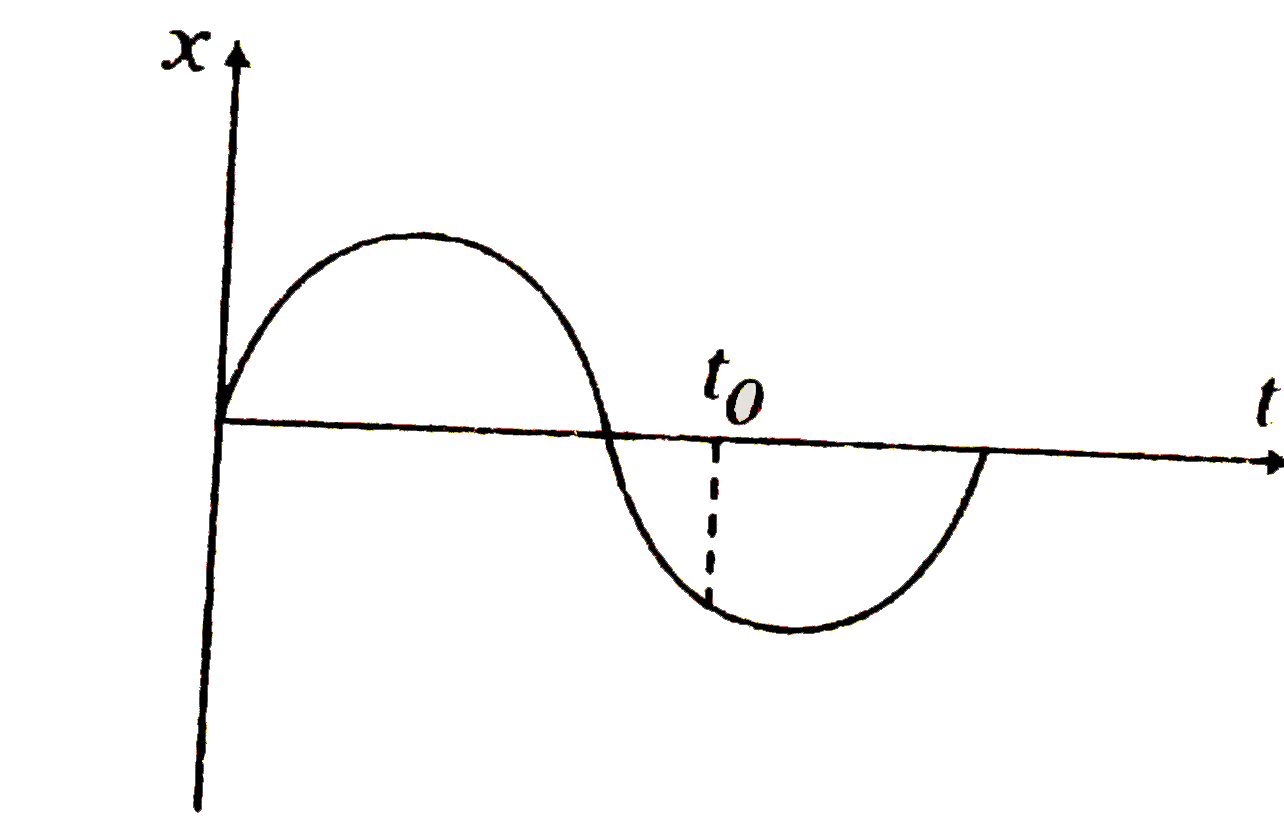
Reason : Slope of s-t graph is negative and increasing in magnitude.05:06View SolutionAssertion : In the x-t graph of a particle in SHM acceleration of particle at time t0 is positive but velocity is negative

Reason :a∝−x and velocity is slope of x-t graph.02:29View SolutionWhich of the following graphs represents the position time-graph of a particle moving with negative velocity?
03:06View SolutionThe position-time (x-t) graph of an object in uniform motion is shown below, the velocity of object is
(i) Positive
(ii) Negative
(iii) Zero
(iv) None of these
 13:20View Solution
STATEMENT - 1 : All accelerated object are represented on position-time graphs by curved lines. STATEMENT - 2 : An object with a positive velocity will be represented on a position-time graph by a line with a positive slope. STATEMENT - 3 : An object with a negative velocity will be represented on a position-time graph by a line with a negative slope.
03:35View Solutionवेग शून्य, ऋणात्मक तथा धनात्मक हो सकता है । सत्य/असत्य
02:40View SolutionPosition (x) versus time (t) graph of a particle is as shown. The velocity is zero at?
07:55View Solution(a) If the position of a particle is given by x=25t−6.0t3, where x is in meters and t is in seconds, when, if ever, is the particle's velocity v zero ? (b) When is its acceleration a zero ? For what time range ( positive or negative ) is a (c) negative and (d) positive ? (e) Graph x(t),v(t), and a(t).
02:11View Solutionनिम्न में से कौन-सा ग्राफ ऋणात्मक वेग से गति करने वाले किसी कण के स्थिति-समय ग्राफ को दर्शाता है?
01:41View Solution

