Which of the following graph(s) represent retardation ? [v : velocity, t : time, x : position]

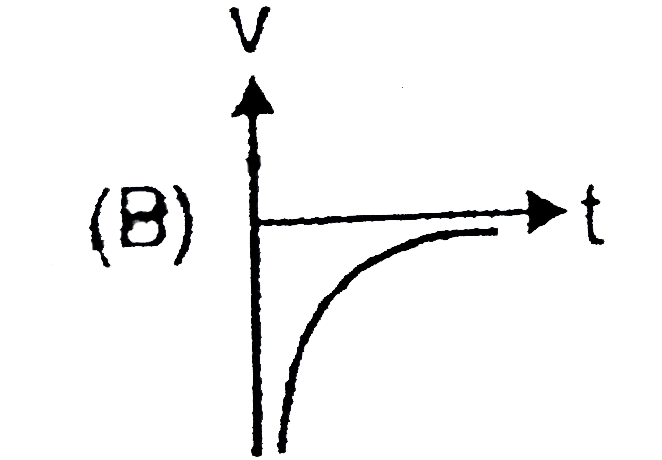
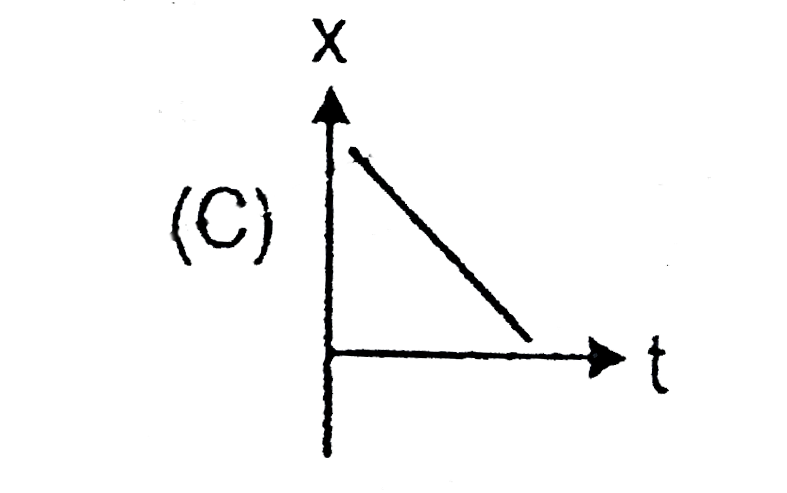
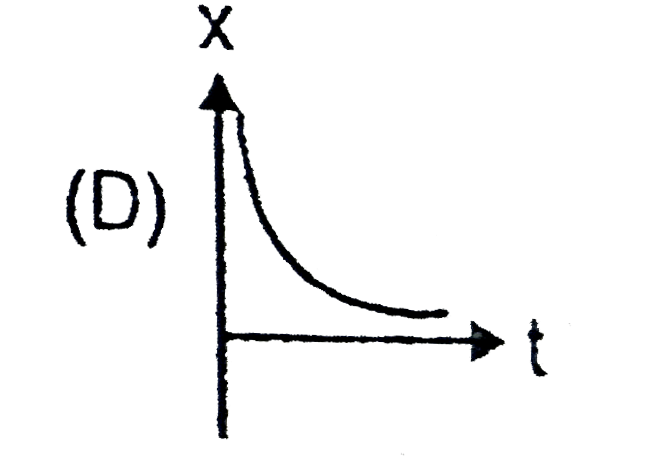
The correct Answer is:A, B, D
Retardation means ∣∣→v∣∣ is decreasing
In A,B∣∣→v∣∣ is decreasing
In D slope of xt is decreasing
Topper's Solved these Questions
- BOOK - RESONANCECHAPTER - TEST PAPERSEXERCISE - PART - II PHYSICS107videos
TEST PAPERS
- BOOK - RESONANCECHAPTER - TEST PAPERSEXERCISE - Physics775videos
TEST PAPERS
- BOOK - RESONANCECHAPTER - TEST PAPERSEXERCISE - FST-330videos
TEST PAPERS
- BOOK - RESONANCECHAPTER - SIMPLE HARMONIC MOTION EXERCISE - Advanced Level Problems13videos
SIMPLE HARMONIC MOTION
- BOOK - RESONANCECHAPTER - TEST SERIESEXERCISE - PHYSICS127videos
TEST SERIES
Similar Questions
A body is acted upon by a constant force fromtime t=0 to a time t=T after which it does not experience any force. Which of the following graphs best represents the variation of the velocity of the body with time ?
View SolutionThe velocity v of a particle moving along x - axis varies with ist position (x) as v=α√x, where α is a constant. Which of the following graph represents the variation of its acceleration (a) with time (t)?
View Solution
Knowledge Check
- Question 1 - Select One
A tennis ball is released so that it falls vertically to the floor and bounces again. Taking velocity upwards as positive, which of the following graphs best represents the variation of its velocity v with time t?
A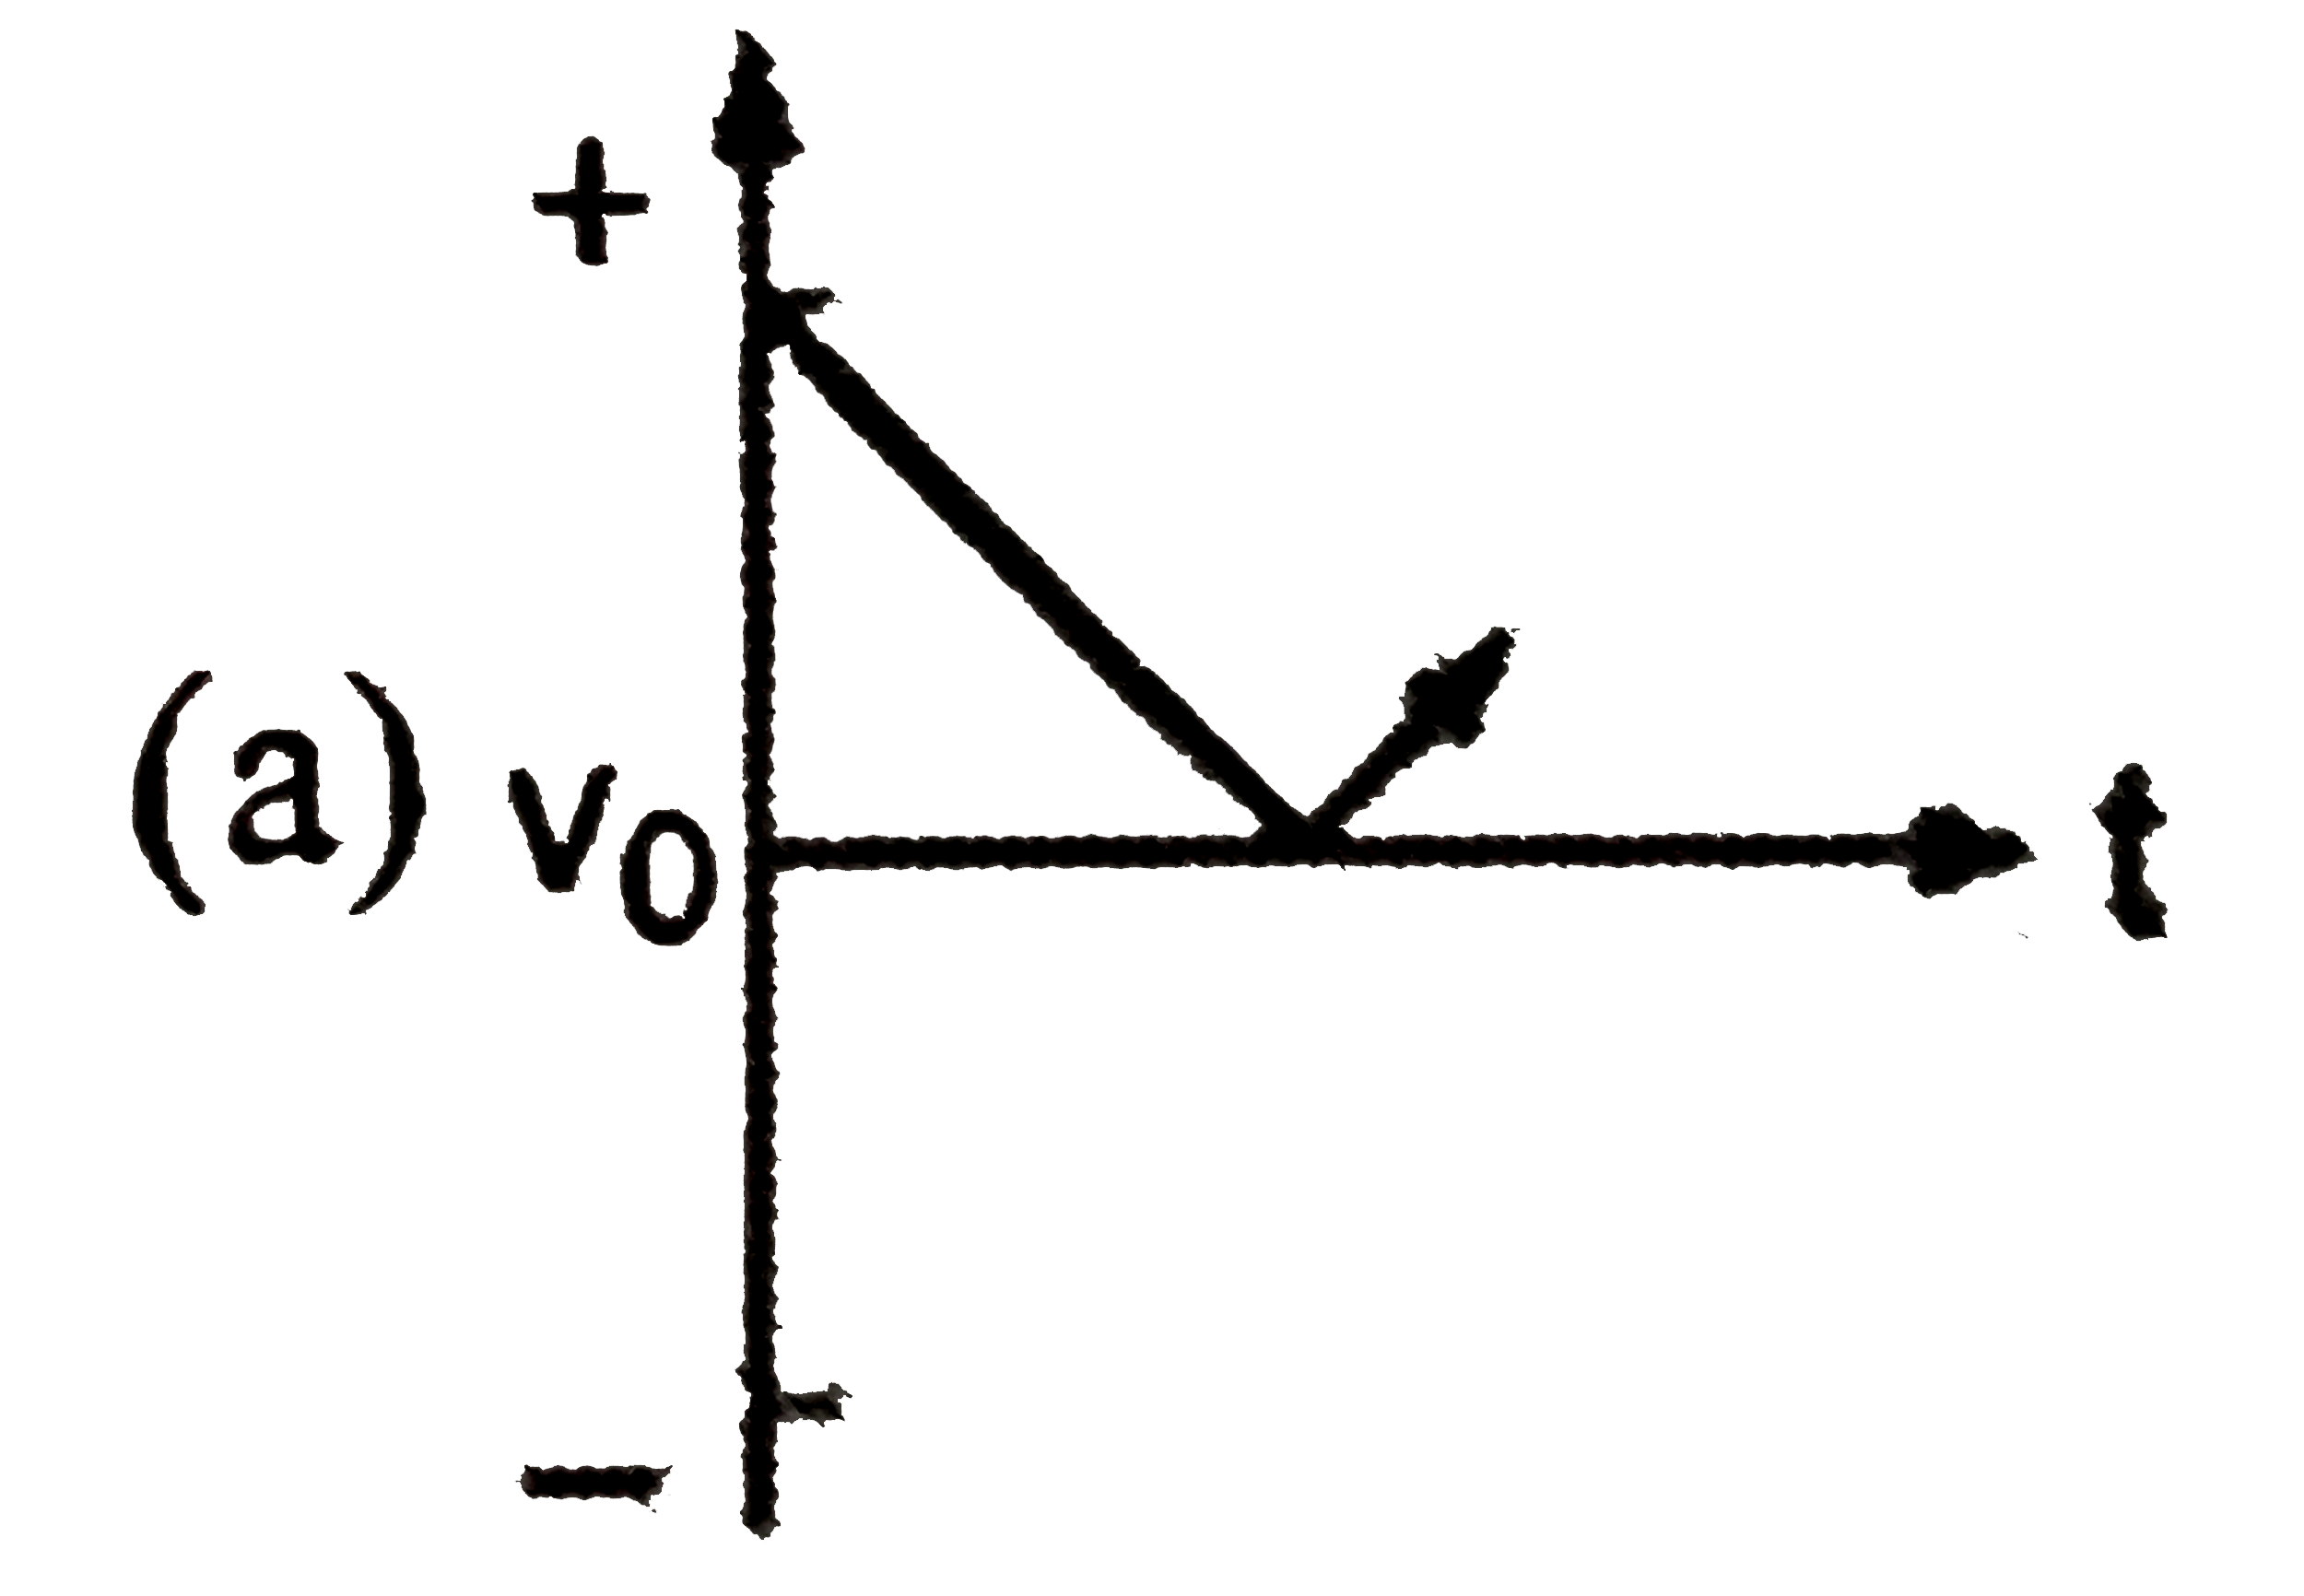 B
B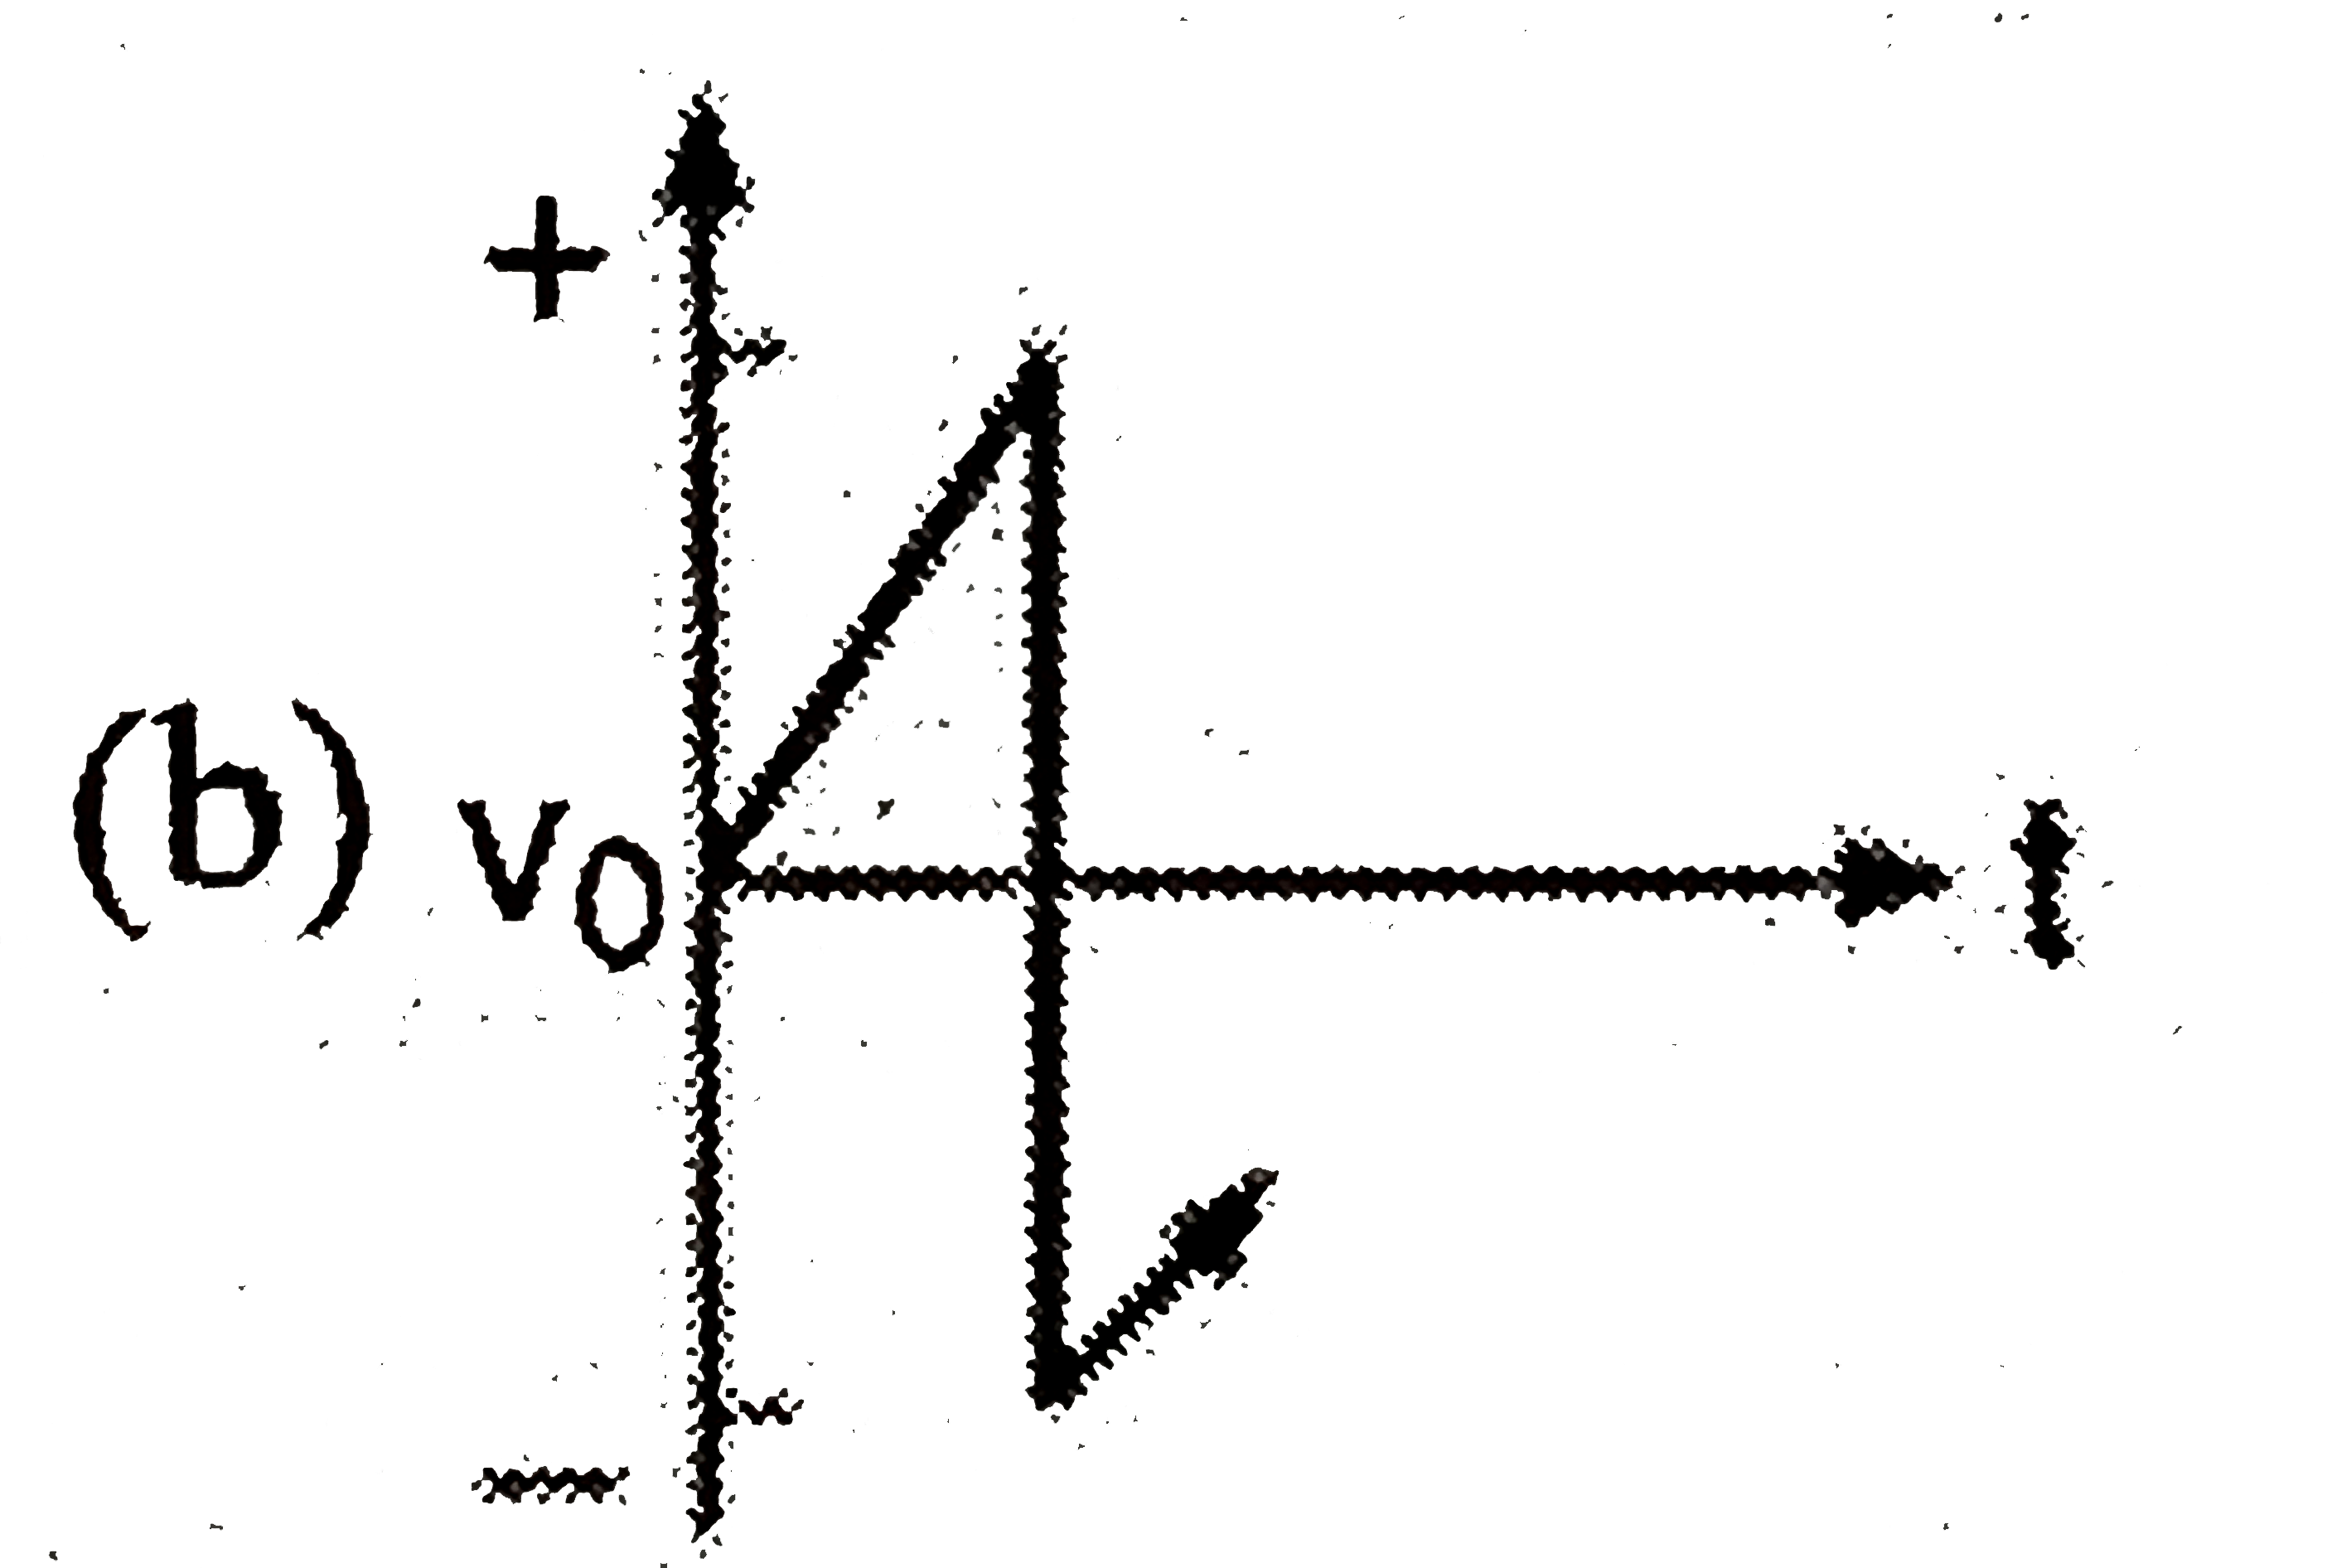 C
C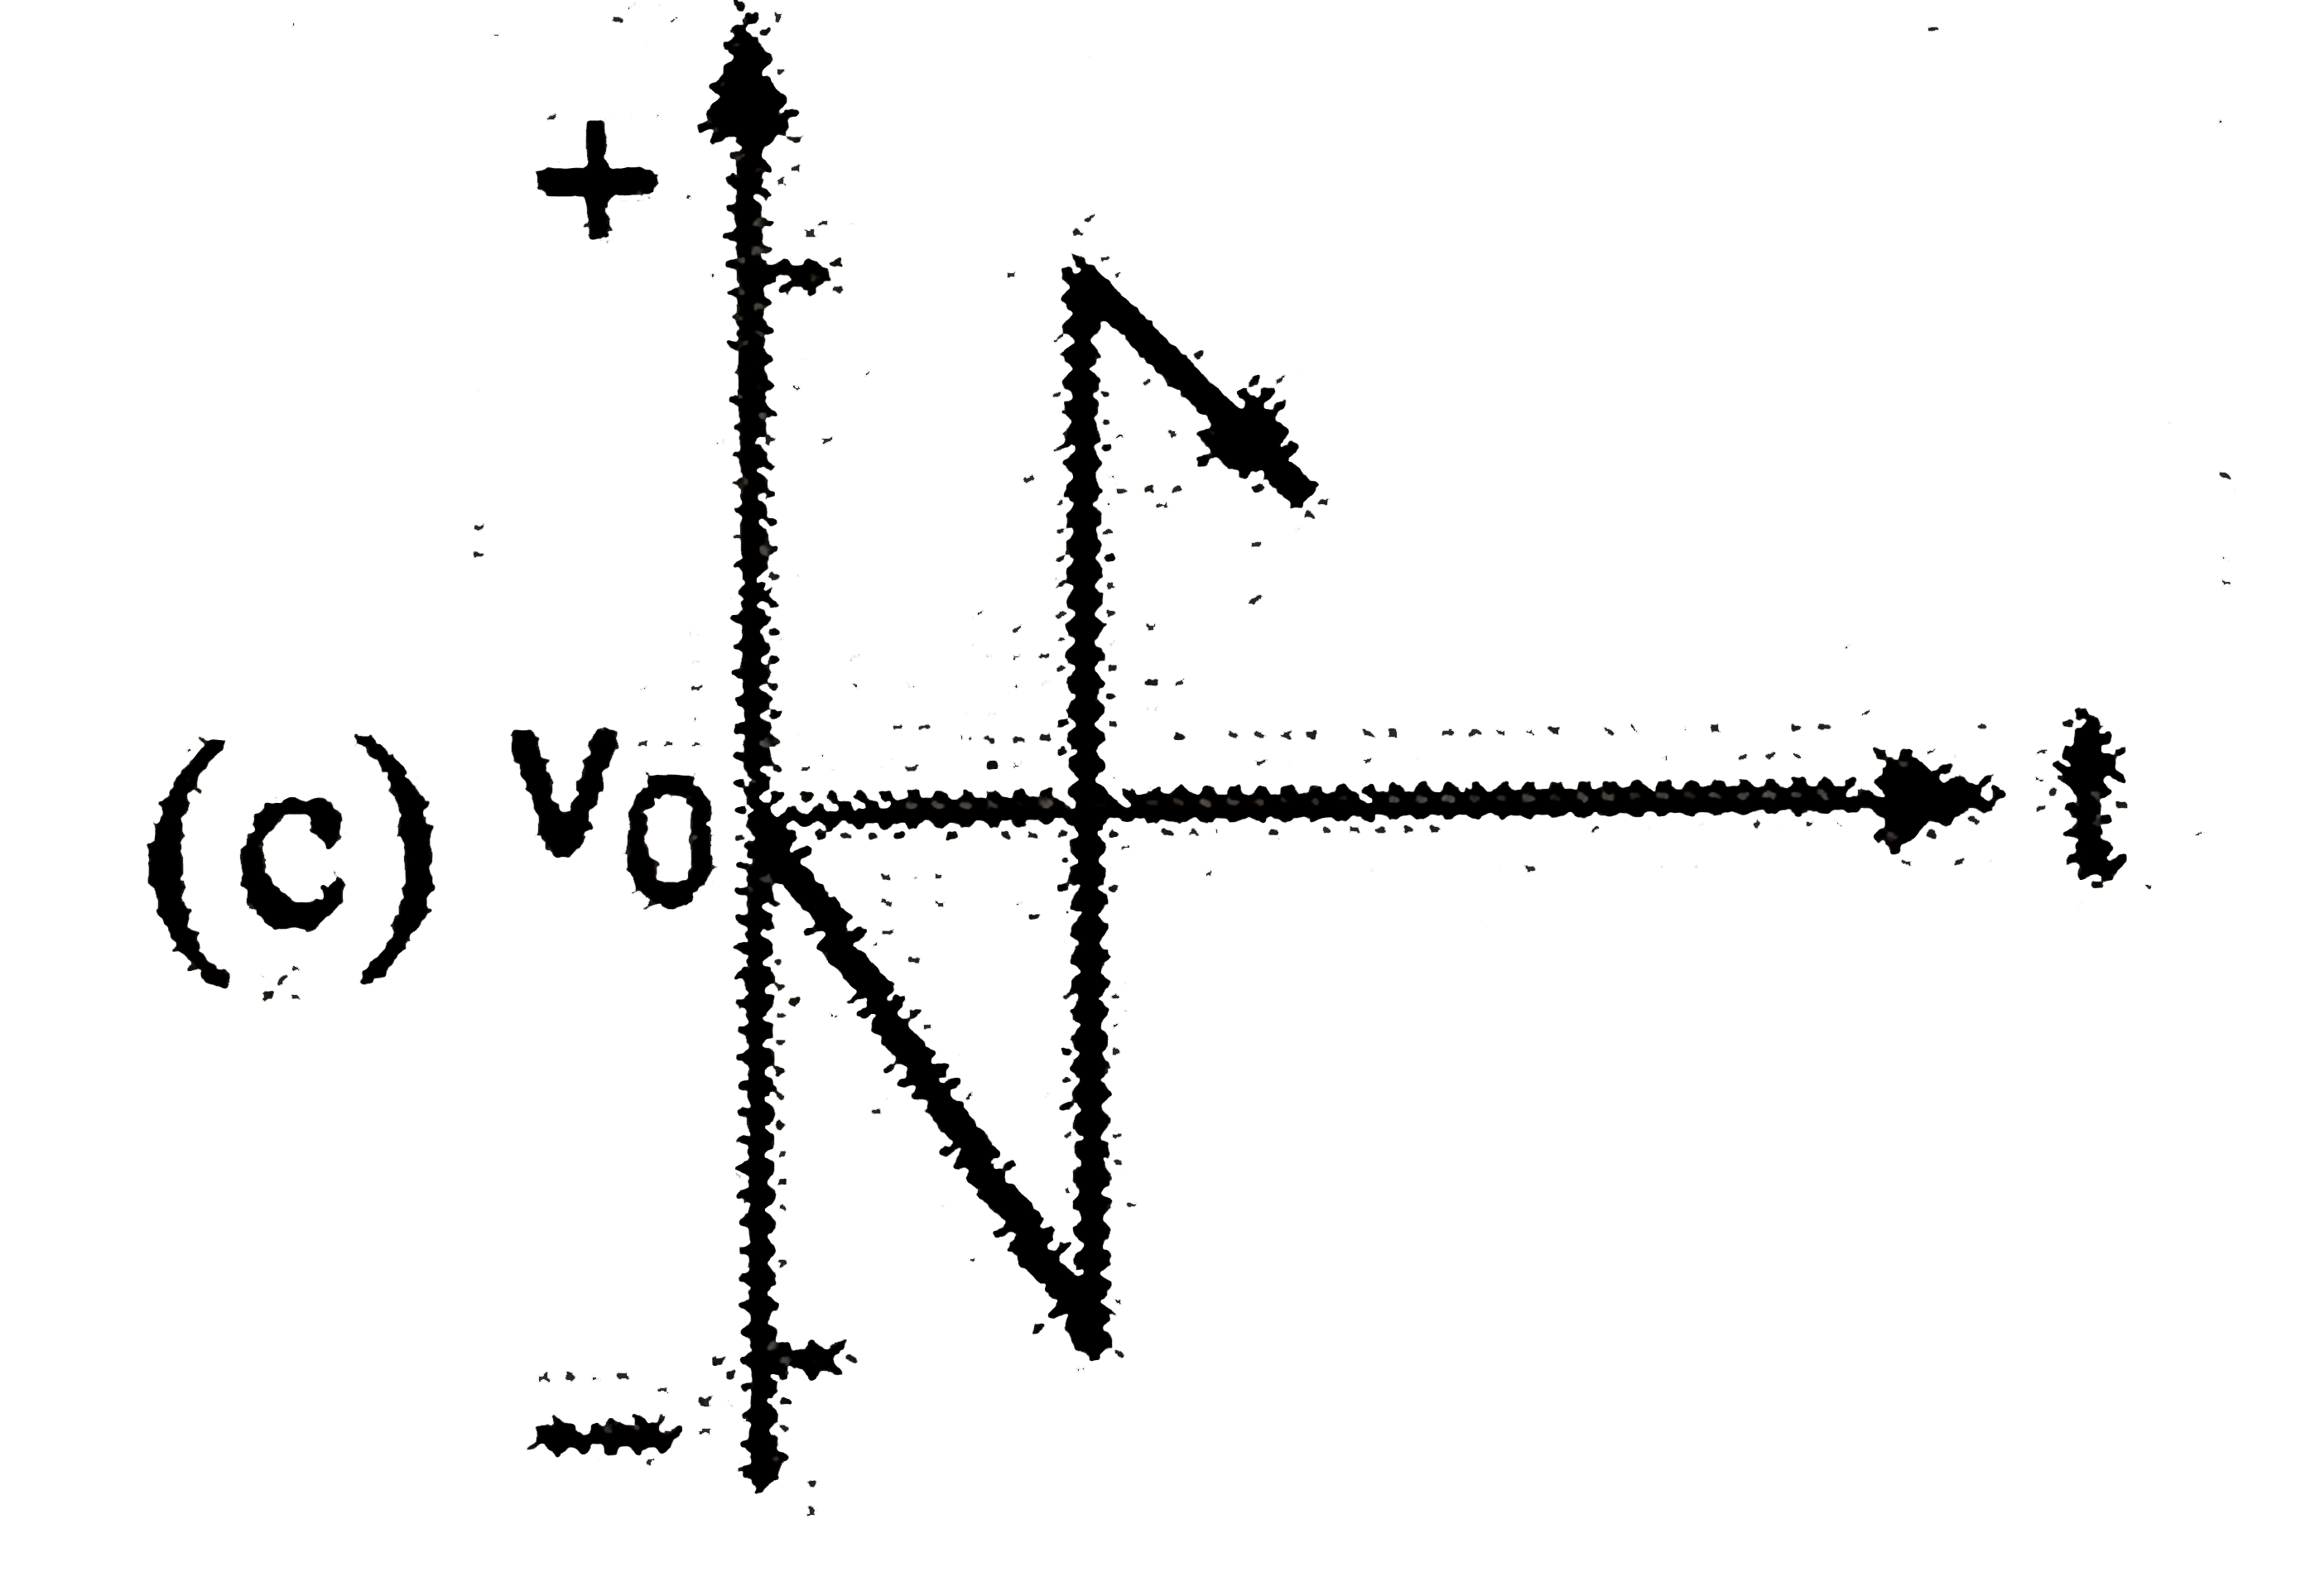 D
D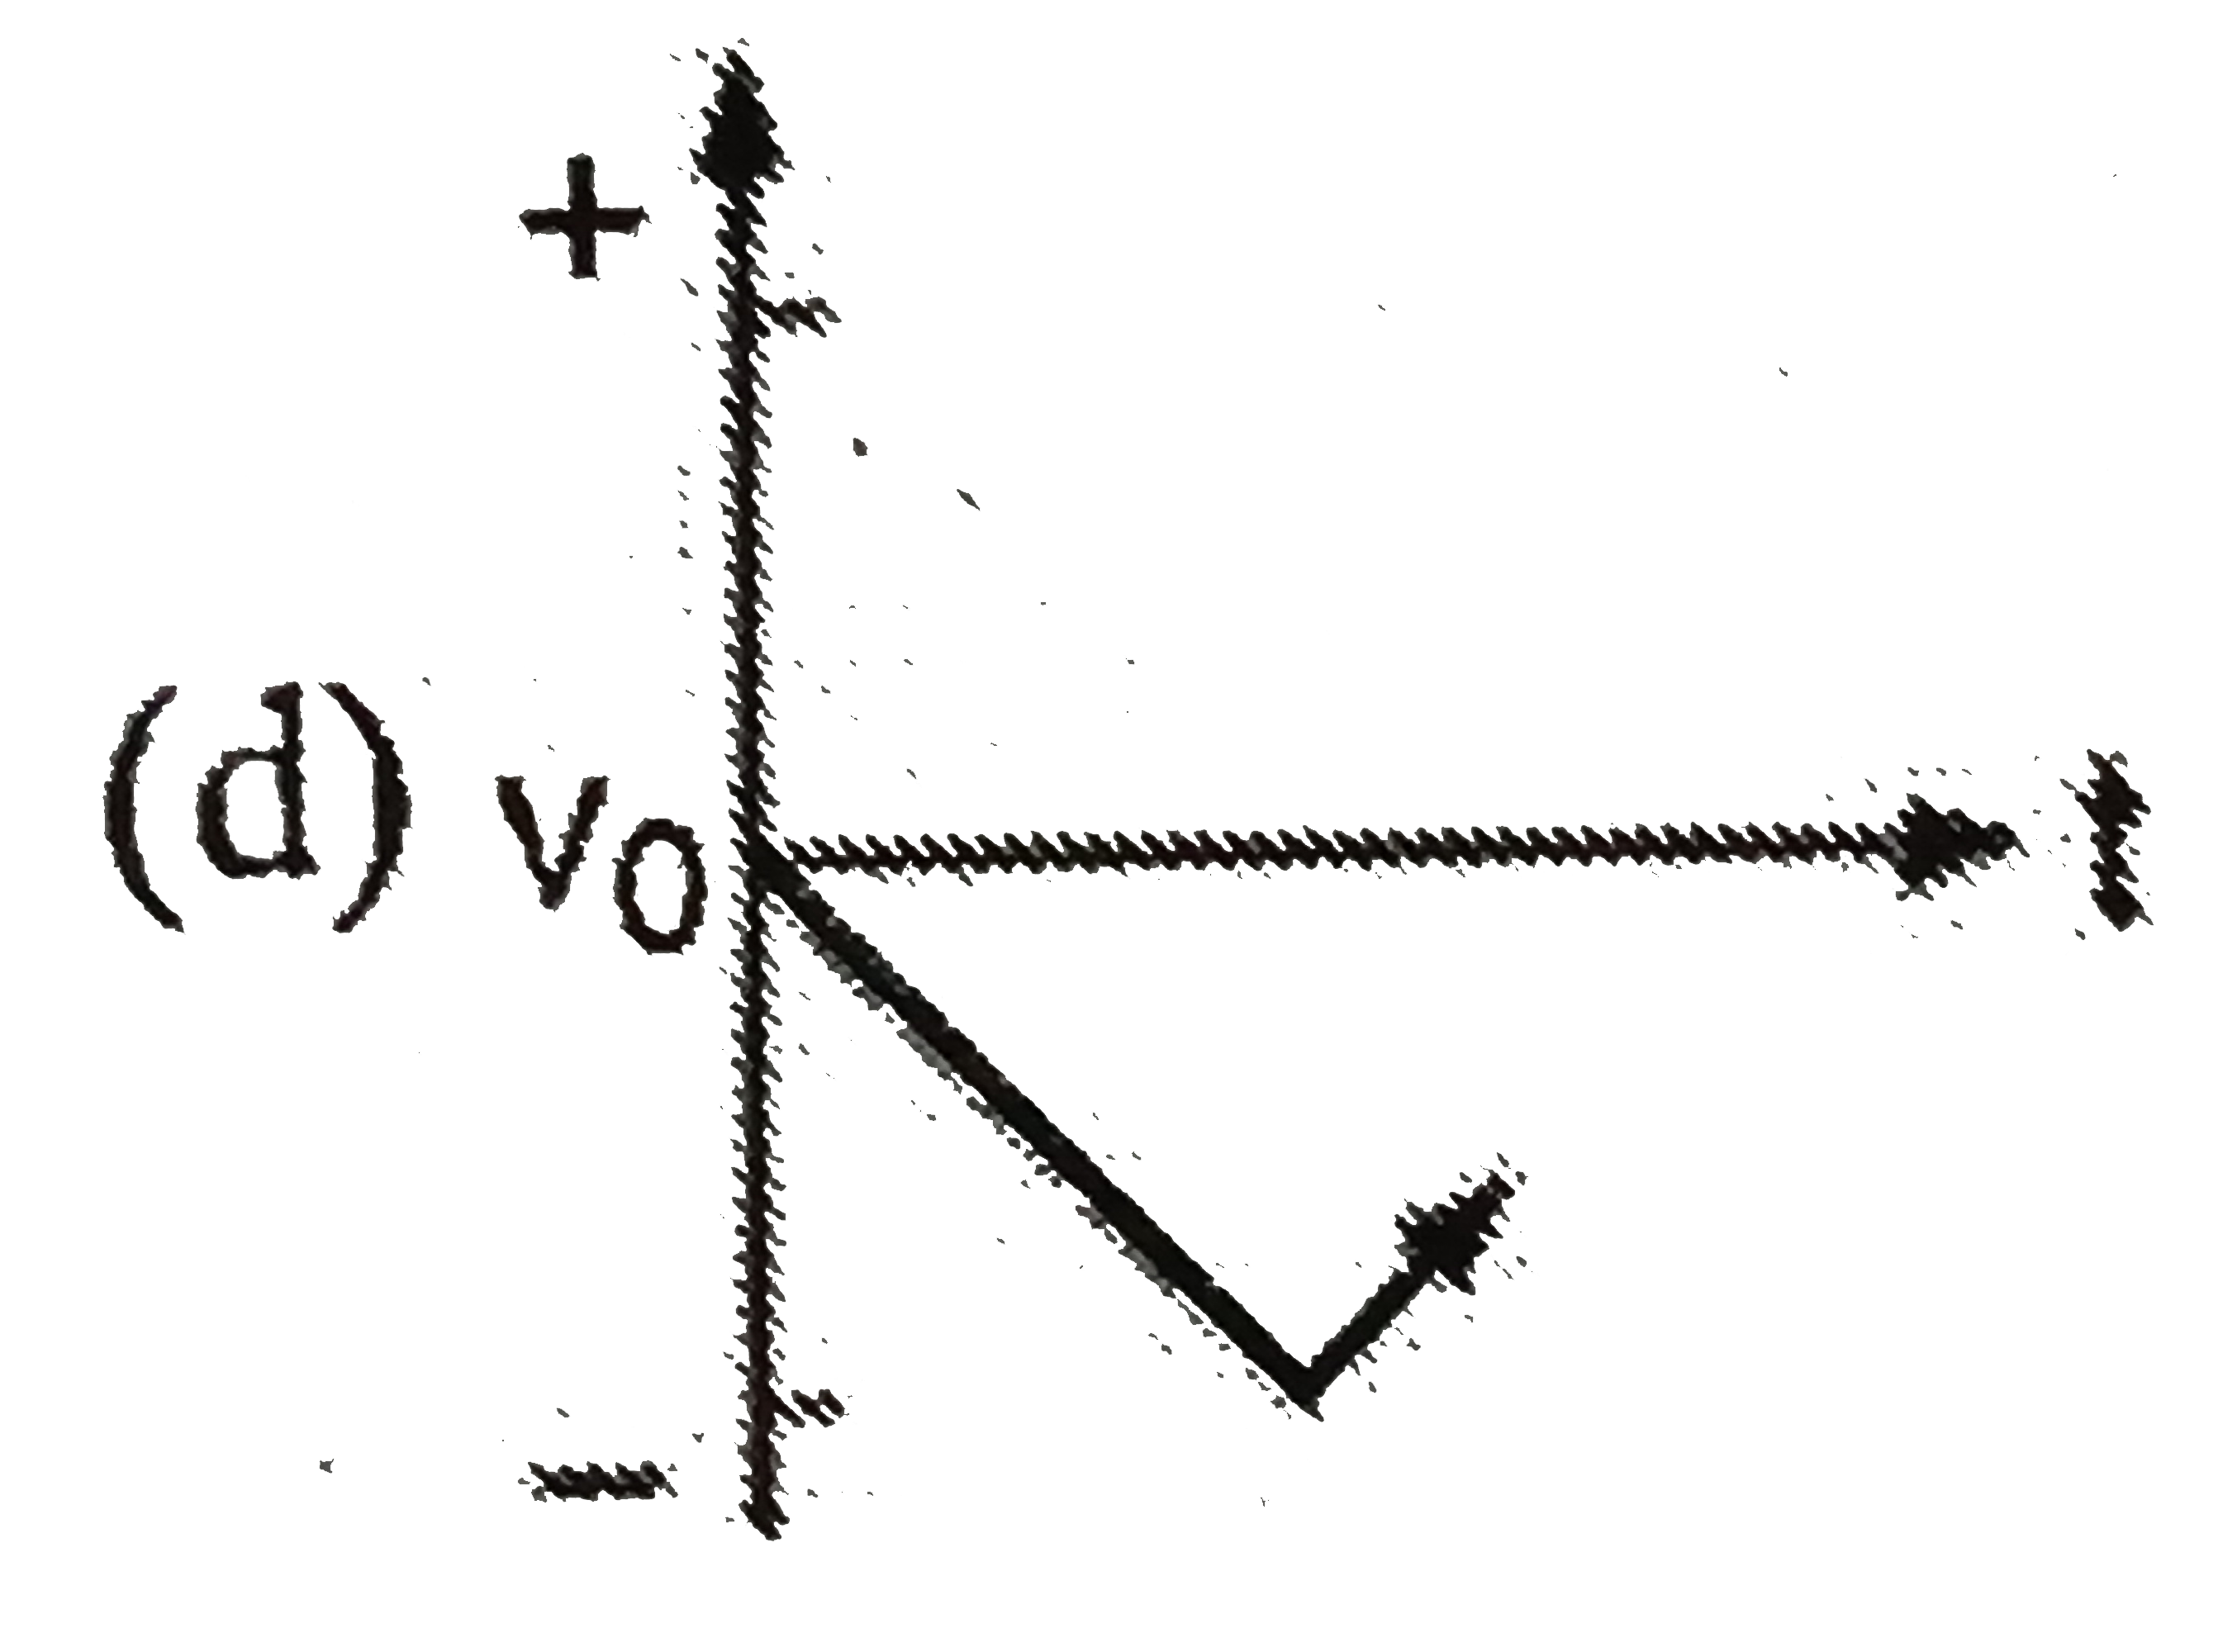
- Question 2 - Select One
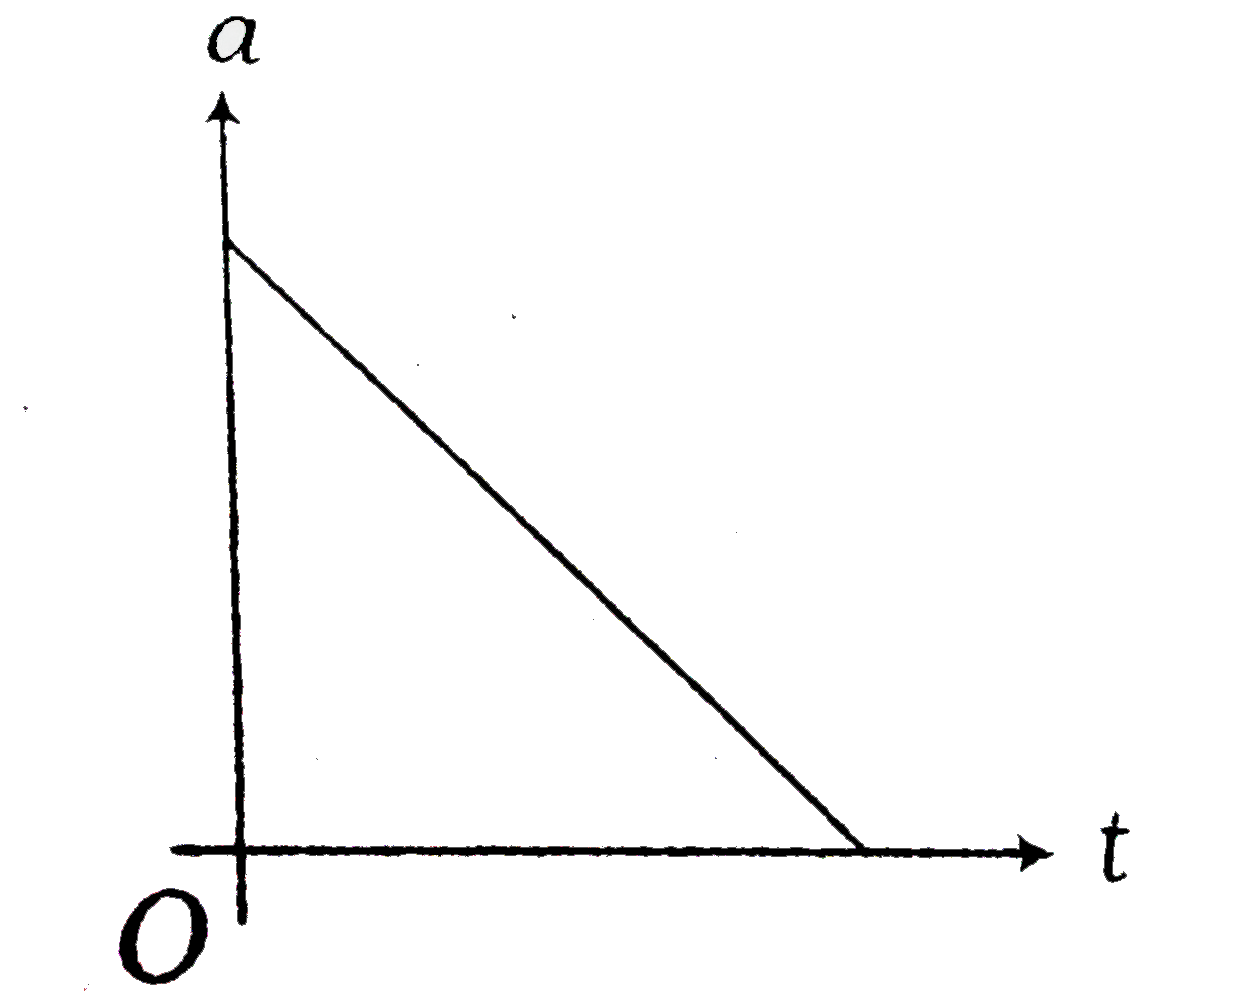
The acceleration (a)-time(t) graph for a particle moving along a straight from rest is shown in figur. Which of the following graph is the best representation of its velocity (v) with time (t) ?
 A
A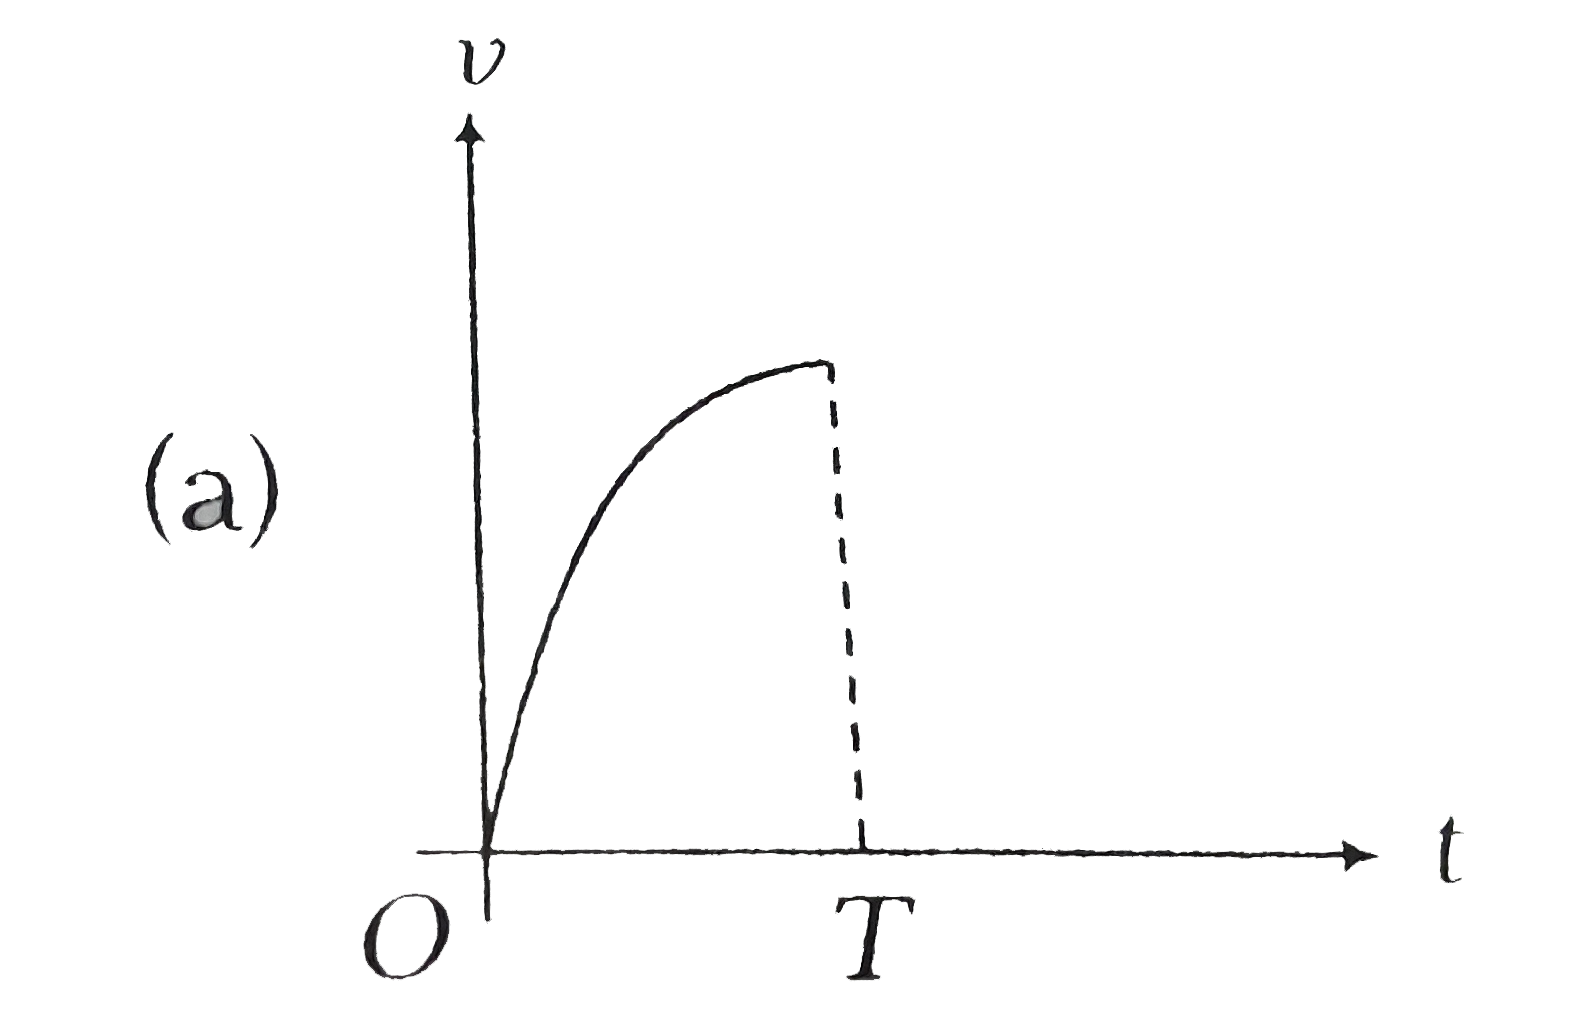 B
B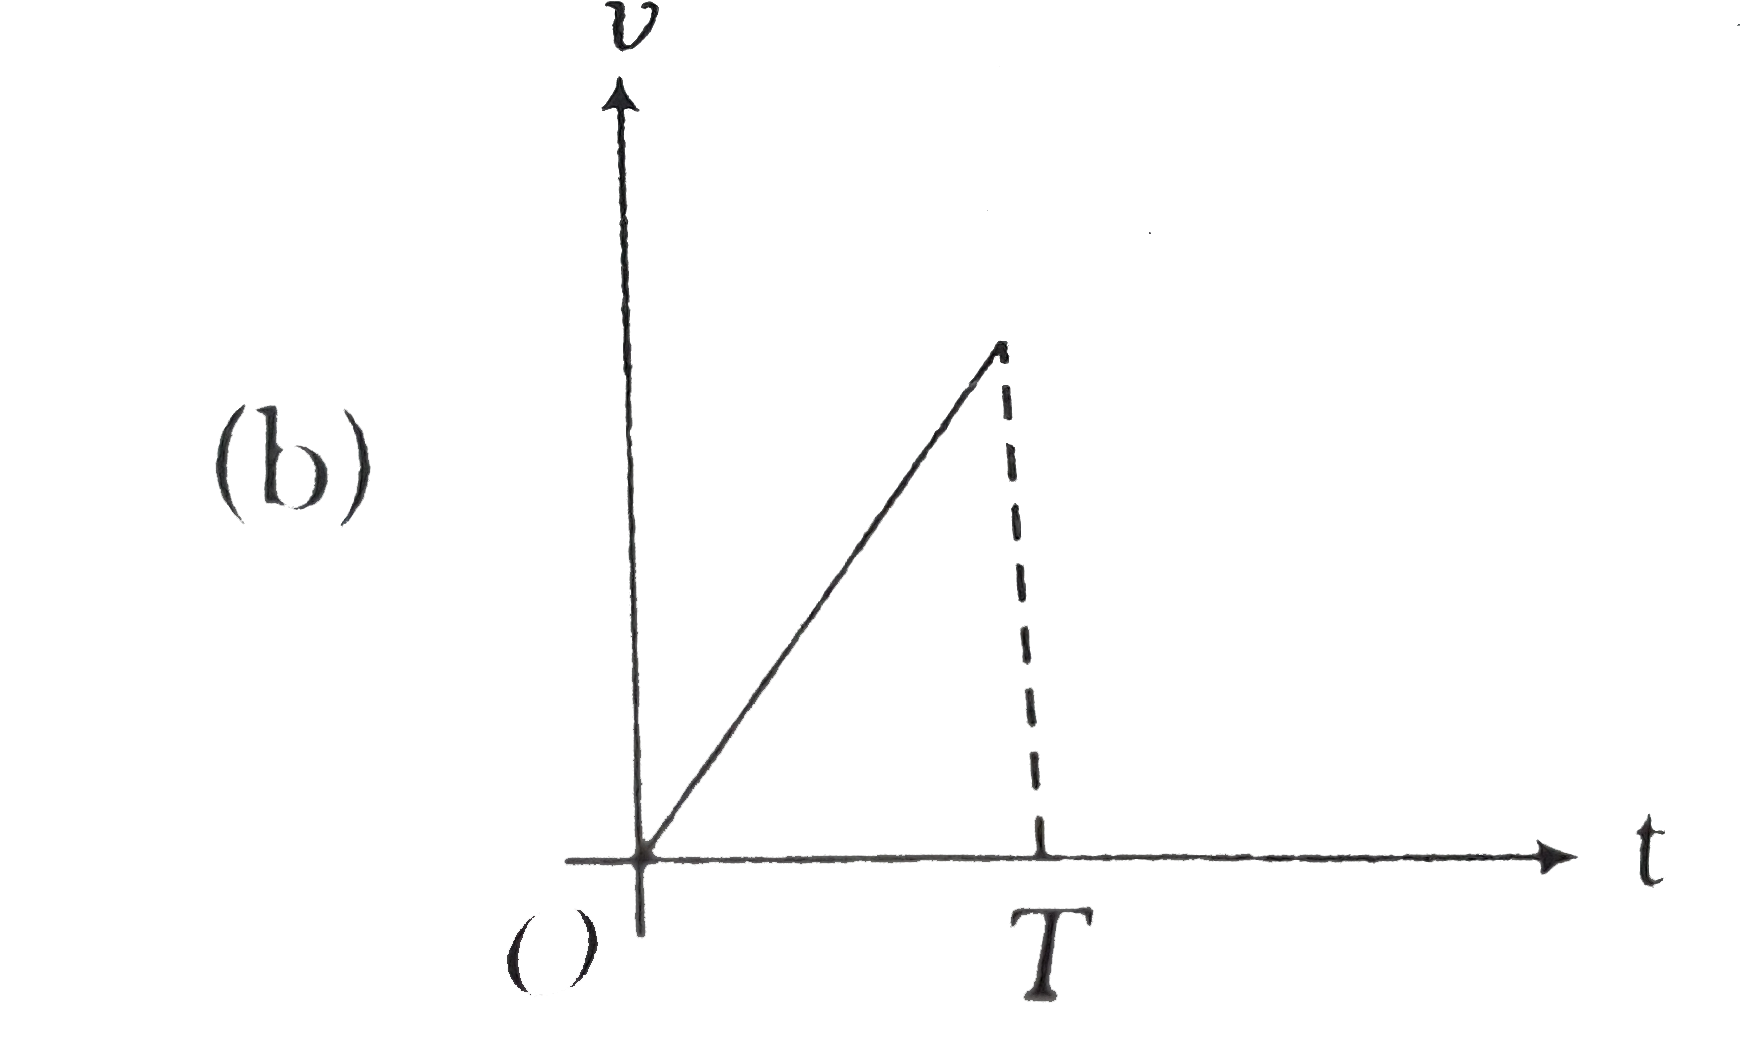 C
C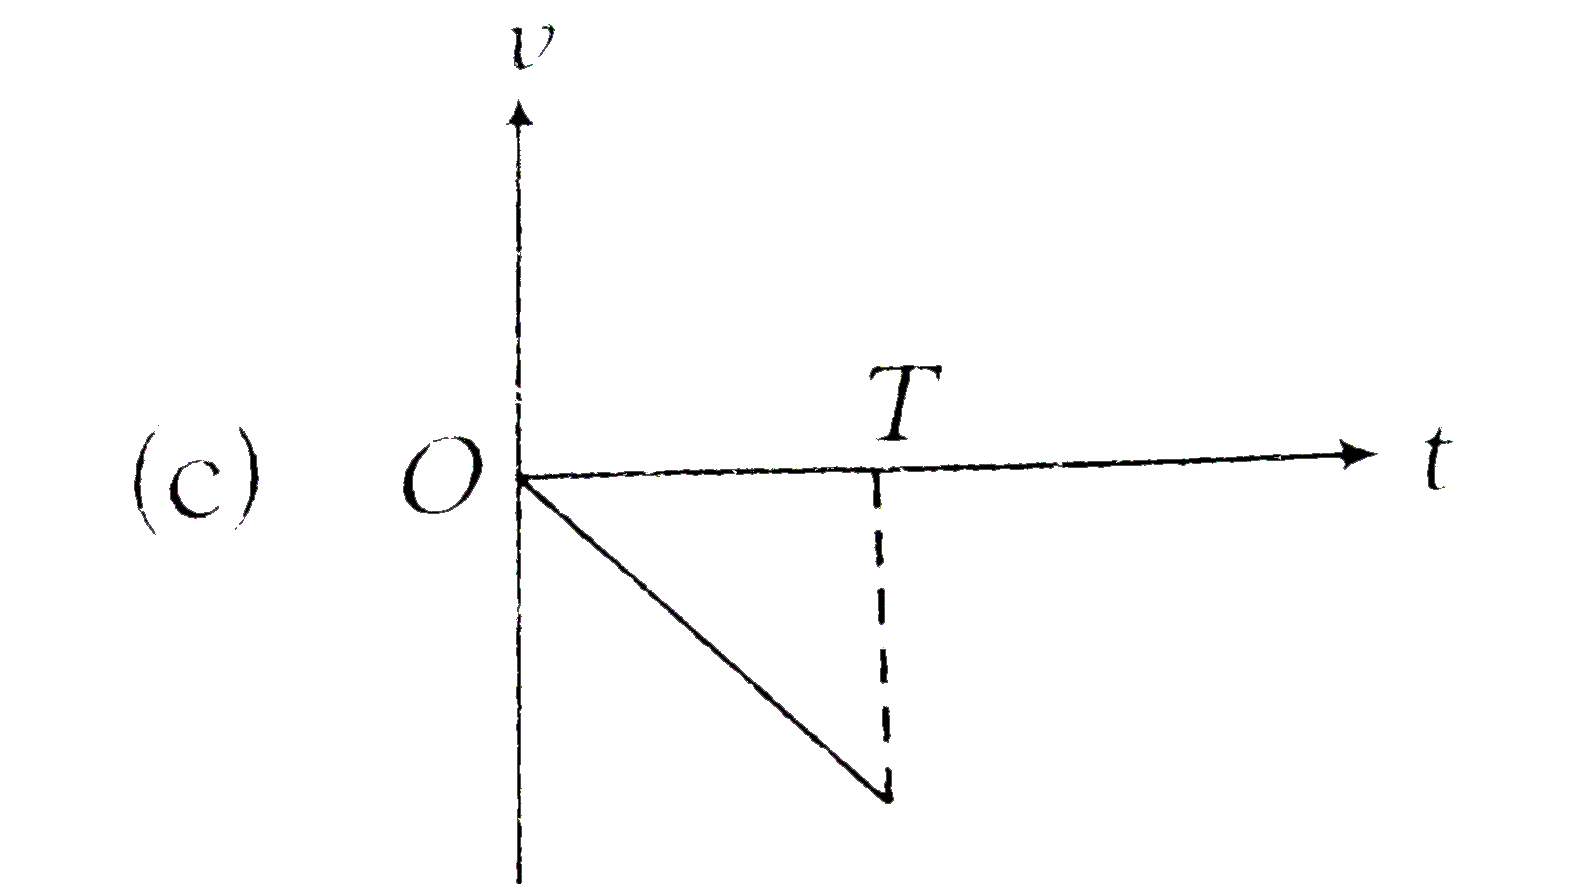 D
D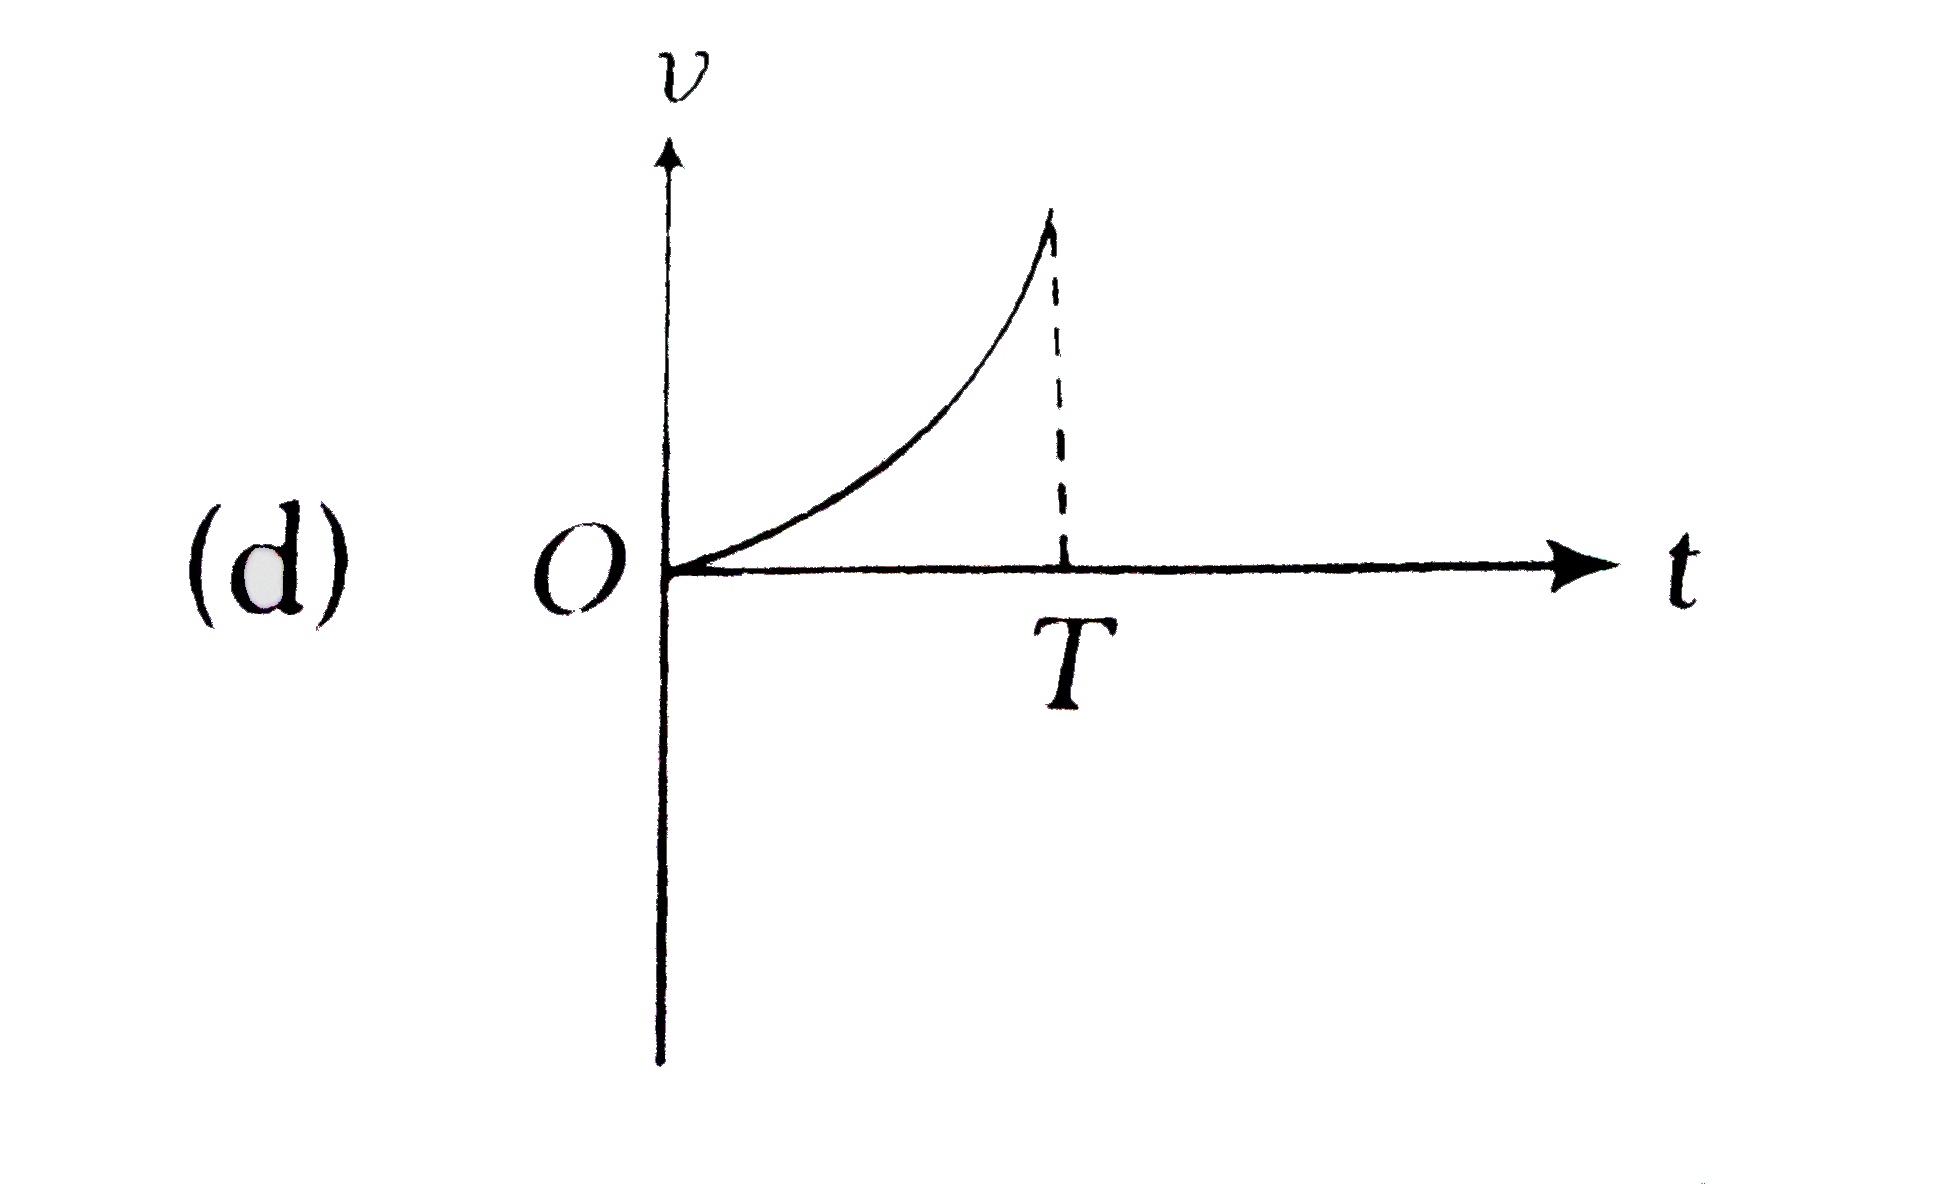
- Question 3 - Select One
Which of the following graph represents relation between the image position (v) and object position (u) from the concave lens.
A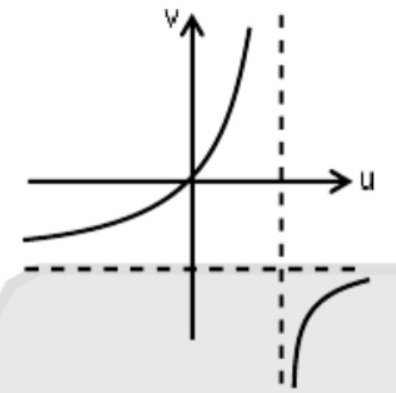 B
B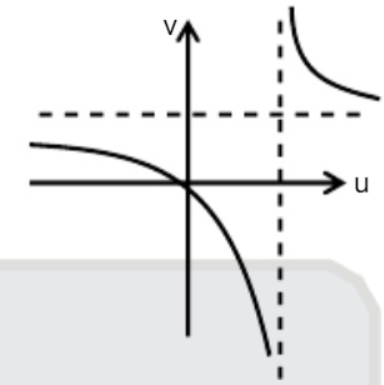 C
C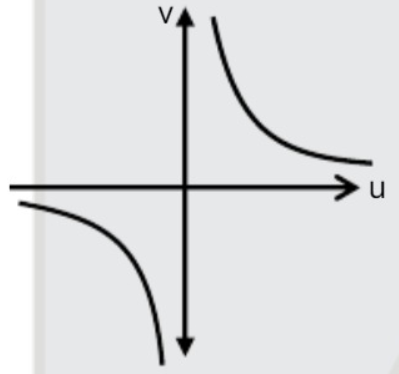 D
D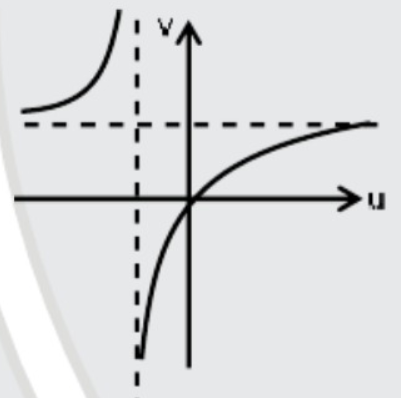
Which of the following graphs represents the variation of activity (A) of a radioactive substance with time (t).
View SolutionWhich of the following velocity-time graphs (v−tgraph) represent uniform motion
View SolutionThe graph shown the variation with times t of the velocity v of an object . Which one of the following graphs best represents the variation of acceleration a of the object with time t?
 View Solution
Which of the following graphs represents the velocity-time relationship for a falling apple?
View SolutionA ball thrown vertically upward with initial velocity u. Which of the following graphs represent the velocity of ball correctly as function of time?
(Take upward direction as positive)View Solution
