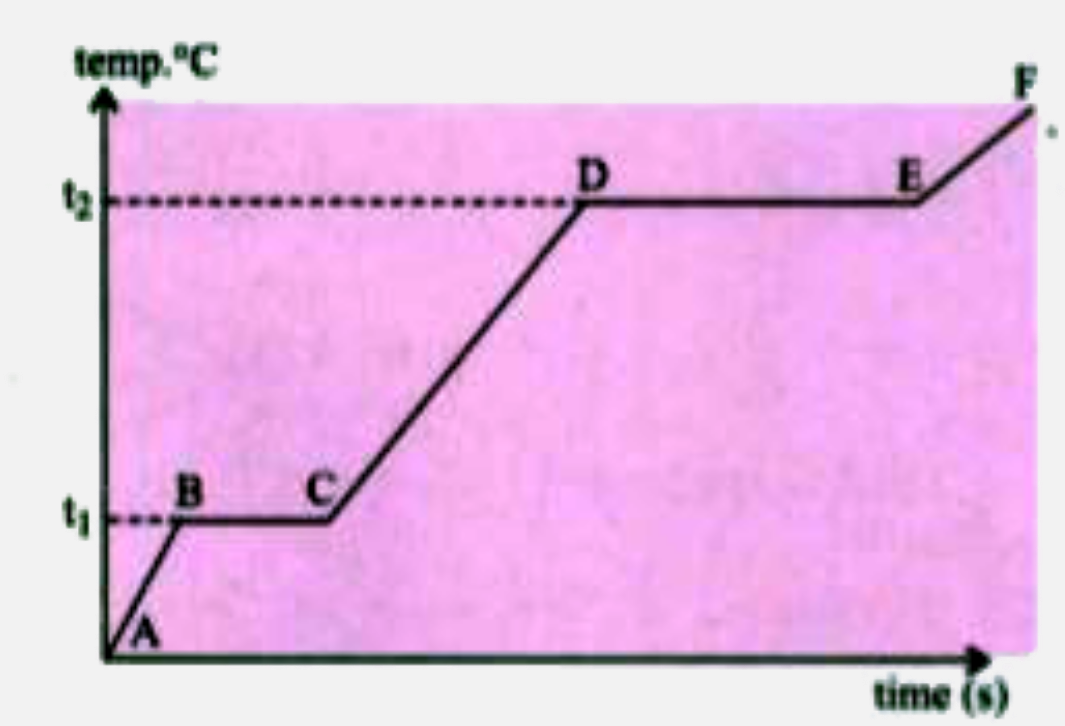
Explain the following temperature vs time graph.

Text Solution
i. The given temperature v/s time graph demonstrates the behaviour of water when heated continuously and uniformly.
ii. a. Line segment AB indicates temperature of ice remaining constant at 0∘C for certain period of time (about 4 minutes).
b. This means, amount of heat (latent heat of fusion) supplied to ice is entirely used for changing its state from solid to liquid.
c. Thus, line segment AB denotes conversion office at 0∘C into water at0∘C.
iii. Line segment BC indicates continuous rise m temperature of water from 0∘C to 100∘C .
iv. a. At point C, boiling point of water is reached and heat energy (latent heat of vaporisation) supplied further is used to convert water into steam.
b. During this transformation, temperature remains unchanged as represented by line segment CD.
c. Thus, line segment CD denotes conversion of water at 100∘C into steam at 100∘C.
|
Topper's Solved these Questions
- HEATBOOK - TARGET PUBLICATIONCHAPTER - HEATEXERCISE - Given reasons
8 Videos
- HEATBOOK - TARGET PUBLICATIONCHAPTER - HEATEXERCISE - Complete the given chart
2 Videos
- HEATBOOK - TARGET PUBLICATIONCHAPTER - HEATEXERCISE - Match the following
6 Videos
- GRAVITATIONBOOK - TARGET PUBLICATIONCHAPTER - GRAVITATIONEXERCISE - ASSESSMENT
19 Videos
- LENSES BOOK - TARGET PUBLICATIONCHAPTER - LENSES EXERCISE - Chapter Assessment
21 Videos
Similar Questions
Knowledge Check
Which of the substances A, B or C has the highest specific heat ? The temperature vs time graph is shown
 AABBCCDAll have equal specific heat
In the following displacement (x) vs time (t) graph, at which among the point P,Q and R is the object speed increasing ?
 AR onlyBP onlyCQ and R onlyDP,Q,R
In which of the following reactions the graph of concentration vs time for reactants and products will be difficult to plot.
AN2O5(g)→2NO2(g)+12O2(g)BCH3O∣∣C−OCH3(aq)[H+]−−−→CH3O∣∣C−OH+CH3OHCH2(g)+12O2(g)→H2O(l)DH2O2(aq)→H2O(l)+12O2(g)
In the following displacement (x) vs time (t) graph, at which among the point P,Q and R is the object speed increasing ?

View SolutionExplain the situations represented by the following distance-time graphs.

View SolutionExplain the situations represented by the following distance-time graphs :

View SolutionIf liquefied oxygen at 1 atmospheric pressure is heated from 50K to 300k by supplying heat at constant rate. The graph of temperature vs time will be
View SolutionIf liquefied oxygen at 1 atmospheric pressure is heated from 50K to 300k by supplying heat at constant rate. The graph of temperature vs time will be
View Solution

