Temperature-time graphs
Step by step video solution for Temperature-time graphs by Physics experts to help you in doubts & scoring excellent marks in Class 12 exams.
Updated on:21/07/2023Similar Questions
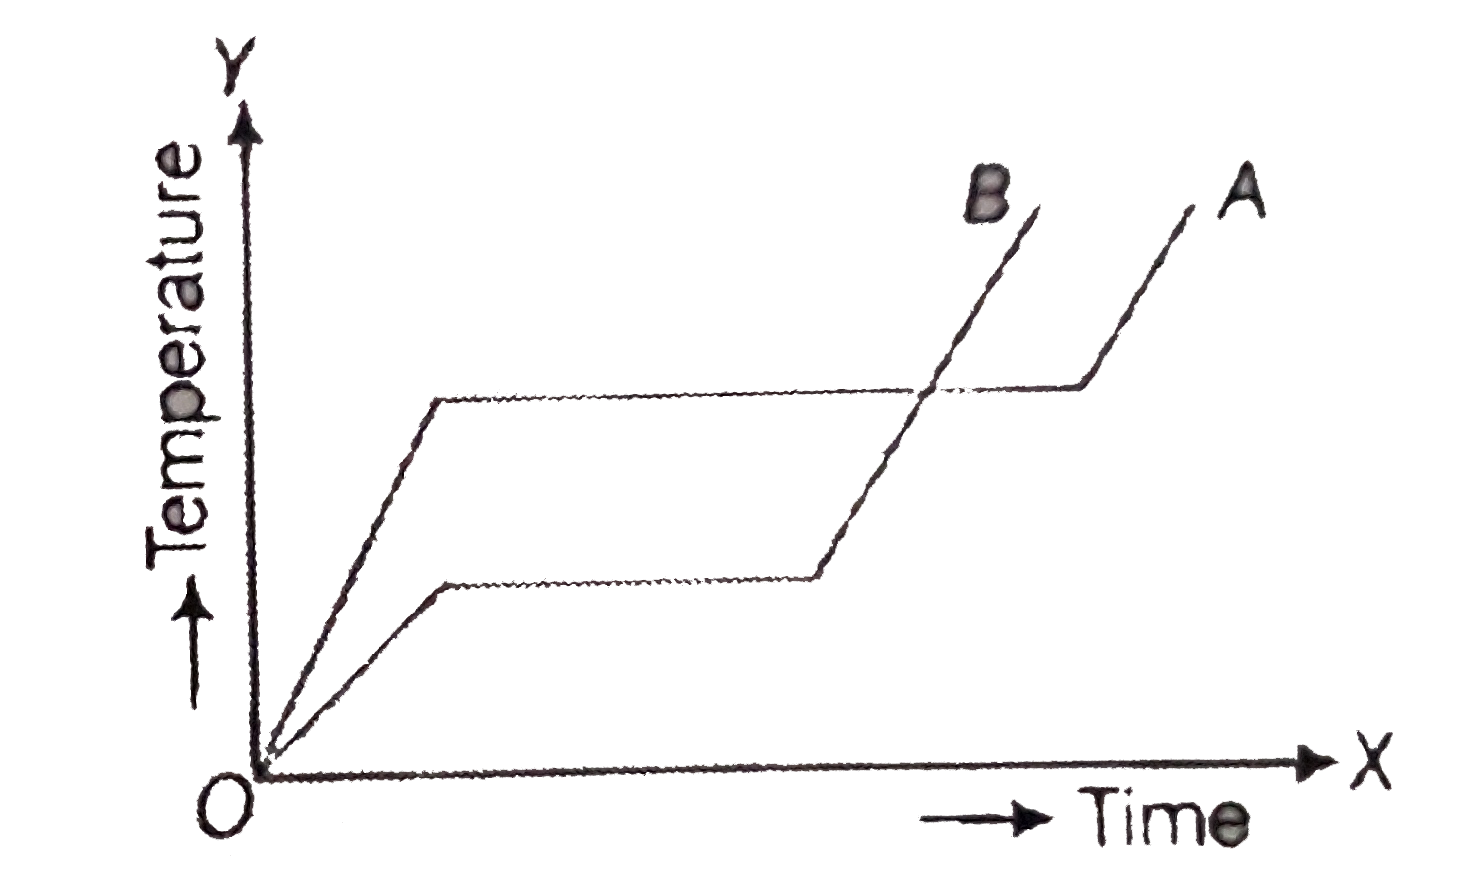
Equal masses of two liquids A and B contained in vessels of negligible heat capacity are supplied heat at the same rate. The temperature-time graphs for the liquids are shown in the figure. If S represents specific heat and L represents latent heat of liquid, then
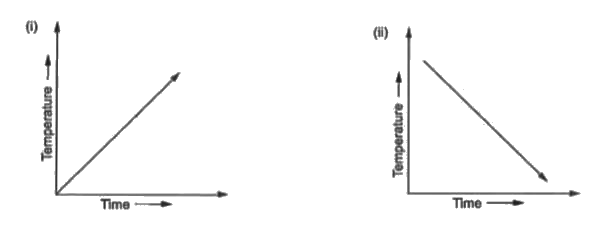
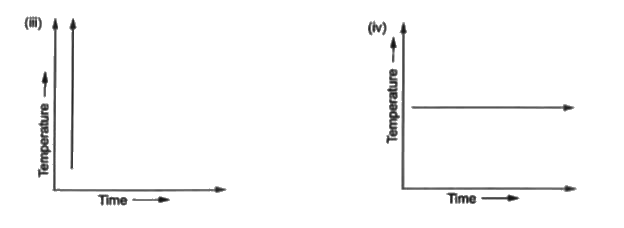
View SolutionCan there be a temperature- time graph as follows ? Justify your answer.
View Solution
Knowledge Check
For the following temperature-time graph, in which region the state of material changes
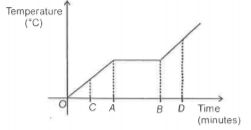 AOCBABCBODCA
The temperature-time graph obtained when hot water is allowed to cool resembles the graph given in one of the following figures. The correct figure is:
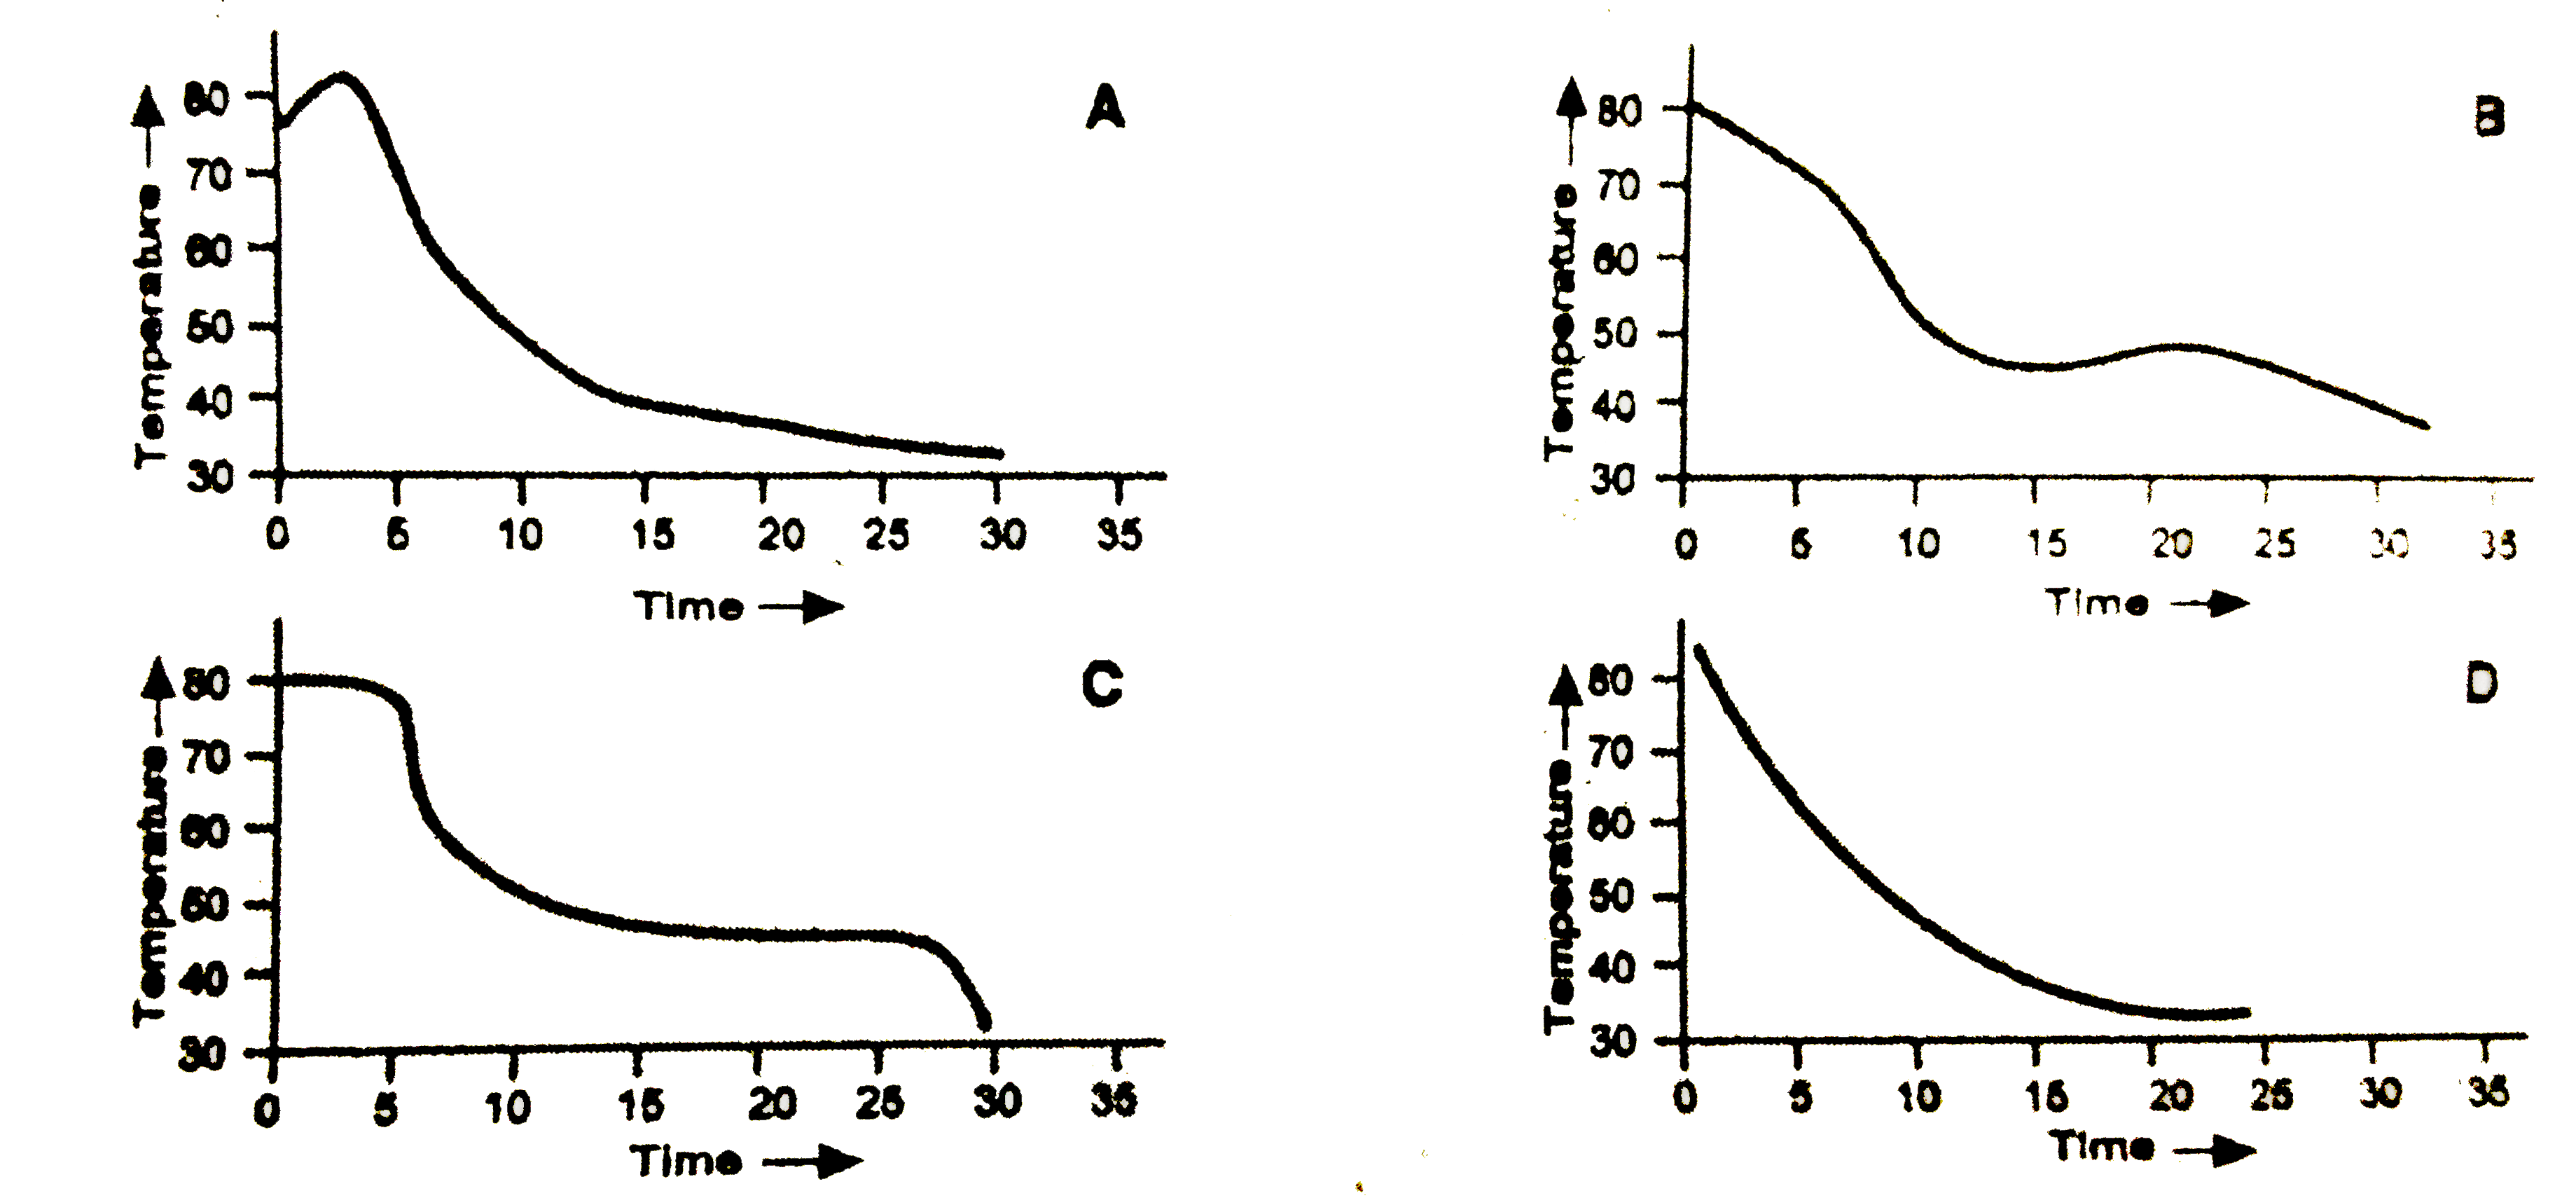 AABBCCDD
A well insulated substance in solid state is heated at a constant rate until it vaporizes completely. The temperature-time graph of the substance is shown below . Which of the following statements is//are true?
_E01_077_Q01.png) AThe specific heat capacity of the substance in solid state is greater than that of the substance in liquid state.BThe specific latent heat of fusion of the substance is greater than the specific latent heat of vaporization of the substance.CIf the rate of heating increases, the slope of AB will be increased but the length of BC remains unchanged.DIf the mass of the substance is doubled, the length of DE is also doubled but the slope of CD is halved.
AThe specific heat capacity of the substance in solid state is greater than that of the substance in liquid state.BThe specific latent heat of fusion of the substance is greater than the specific latent heat of vaporization of the substance.CIf the rate of heating increases, the slope of AB will be increased but the length of BC remains unchanged.DIf the mass of the substance is doubled, the length of DE is also doubled but the slope of CD is halved.
Draw the temperature-time graph in each of the following cases: Time (in hours:), 7:00, 9:00, 11:00, 13:00, 15:00, 17:00, 19:00, 21:00 Temperature 0F) ∈ , 100, 101, 104, 102, 100, 99, 100, 98 (ii) Time (in hours), 8:00, 10:00, 12:00, 14:00, 16:00, 18:00, 20: Temperature ( 0F) in, 100, 101, 104, 103, 99, 98, 100
View SolutionThe temperature of patient, admitted in a hospital with typhoid fever, taken at different times of the day are given below. Draw the temperature-time graph to represent the data: Time (in hours), 6:00, 8:00, 10:00, 12:00, 14:00, 16:00, 18:00 Temp. (in 0F): , 102, 100, 99, 103, 100, 102, 99
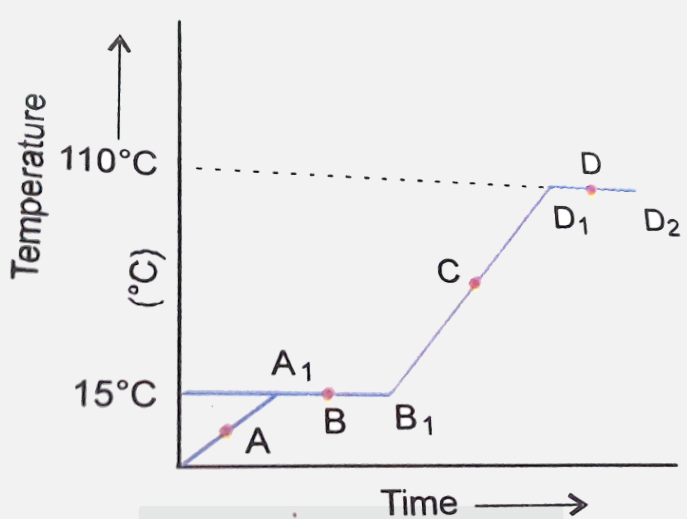
View SolutionThe temperature-time graph below shows the heating curve for pure wax. From the graph answer the following :
(a) What is the physical state of the substance at the points A, B, C and D ?
(b) What is the melting point of the substance ?
(c ) What is its boiling point ?
(d) Which portions of the graph indicates that change of state is taking place.
(e ) Name the terms used for heat absorbed during change of states involved in above processes.
View SolutionThe maximum temperature on 10 days of June, 2002, in Delhi is given below:

Draw a temperature-time graph for the above data
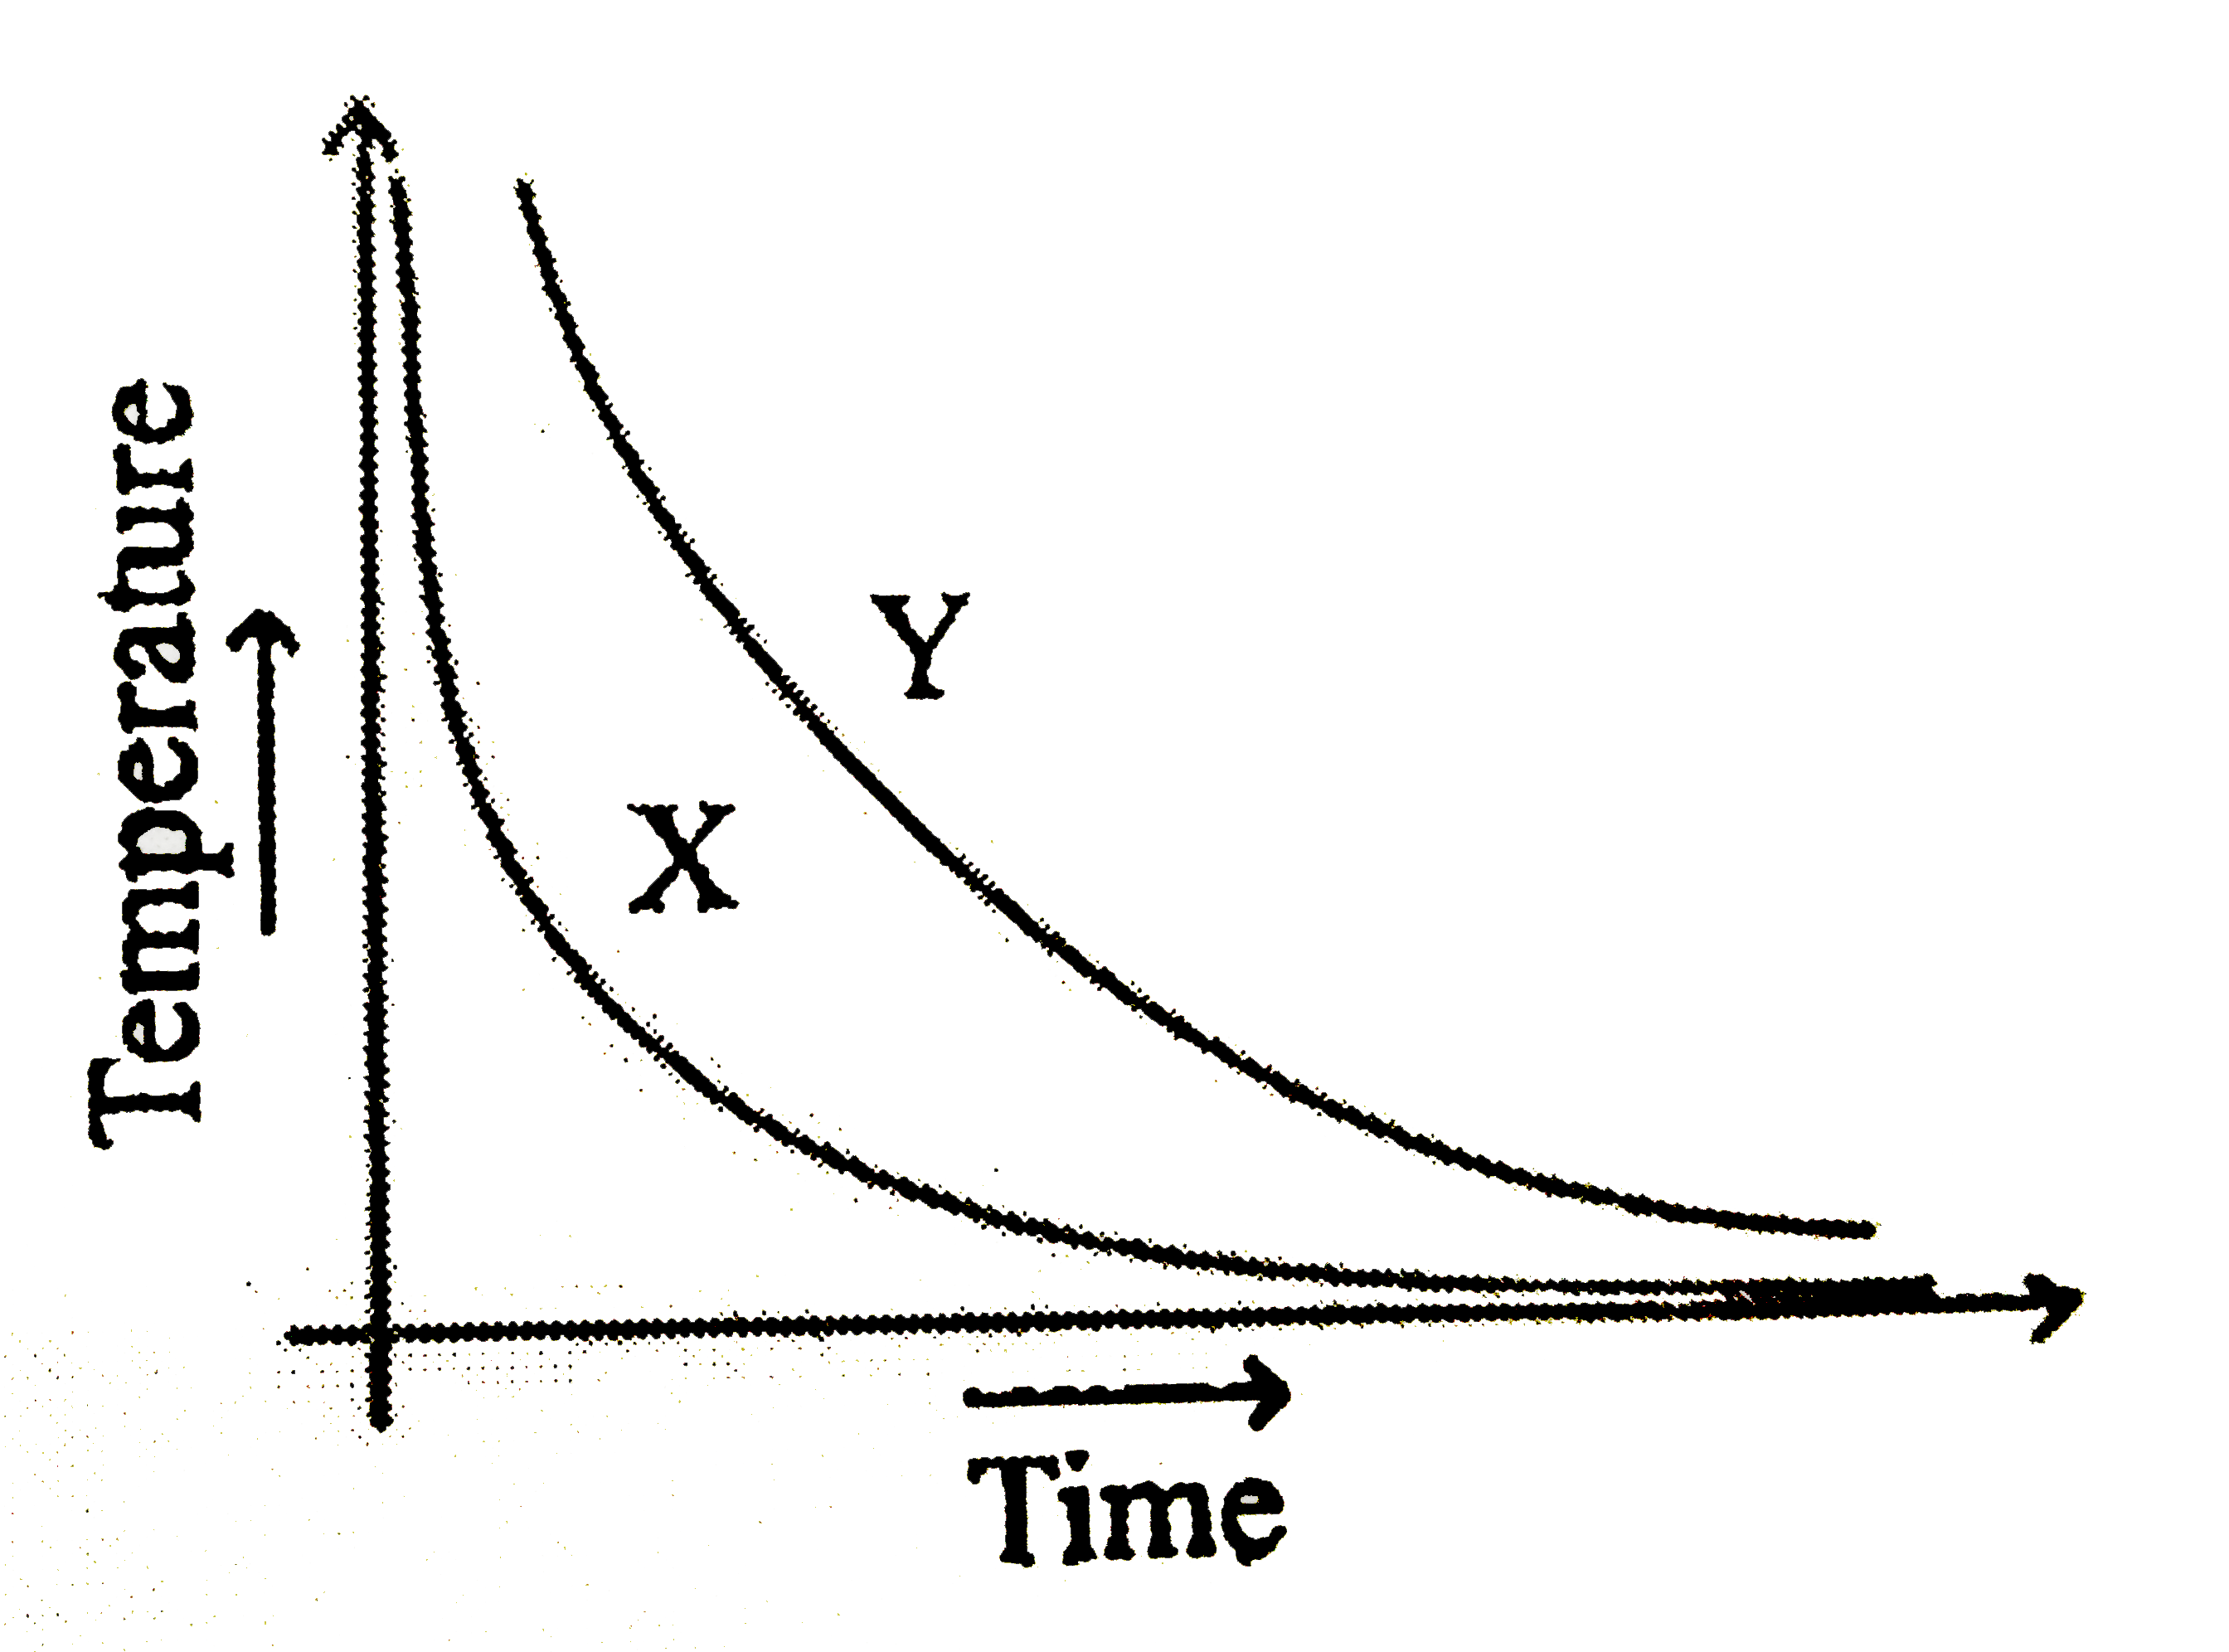
View SolutionTwo students X and Y have to do their experiment on plotting the temperature-time graph for a hot body as it cools to room temperature. They do their experiments in the same lab, using completely identical apparatus, take equal amounts of tap water heated up to the same temperature, start their observations simultaneously and note the temperature values at identically spaced intervals of time. Their temperature-time graphs, plotted on a given graph paper, with the same given choices of scales along the axis, are however, as shown: The following could be the reason for this difference:
(A) Use of an overhead fan by student X.
(B) Use of an overhead fan by student Y.
(C) Less frequent stirring of water by student X.
(D) Less frequent stirring of water by student Y.
The most likely reason is:
View Solution
