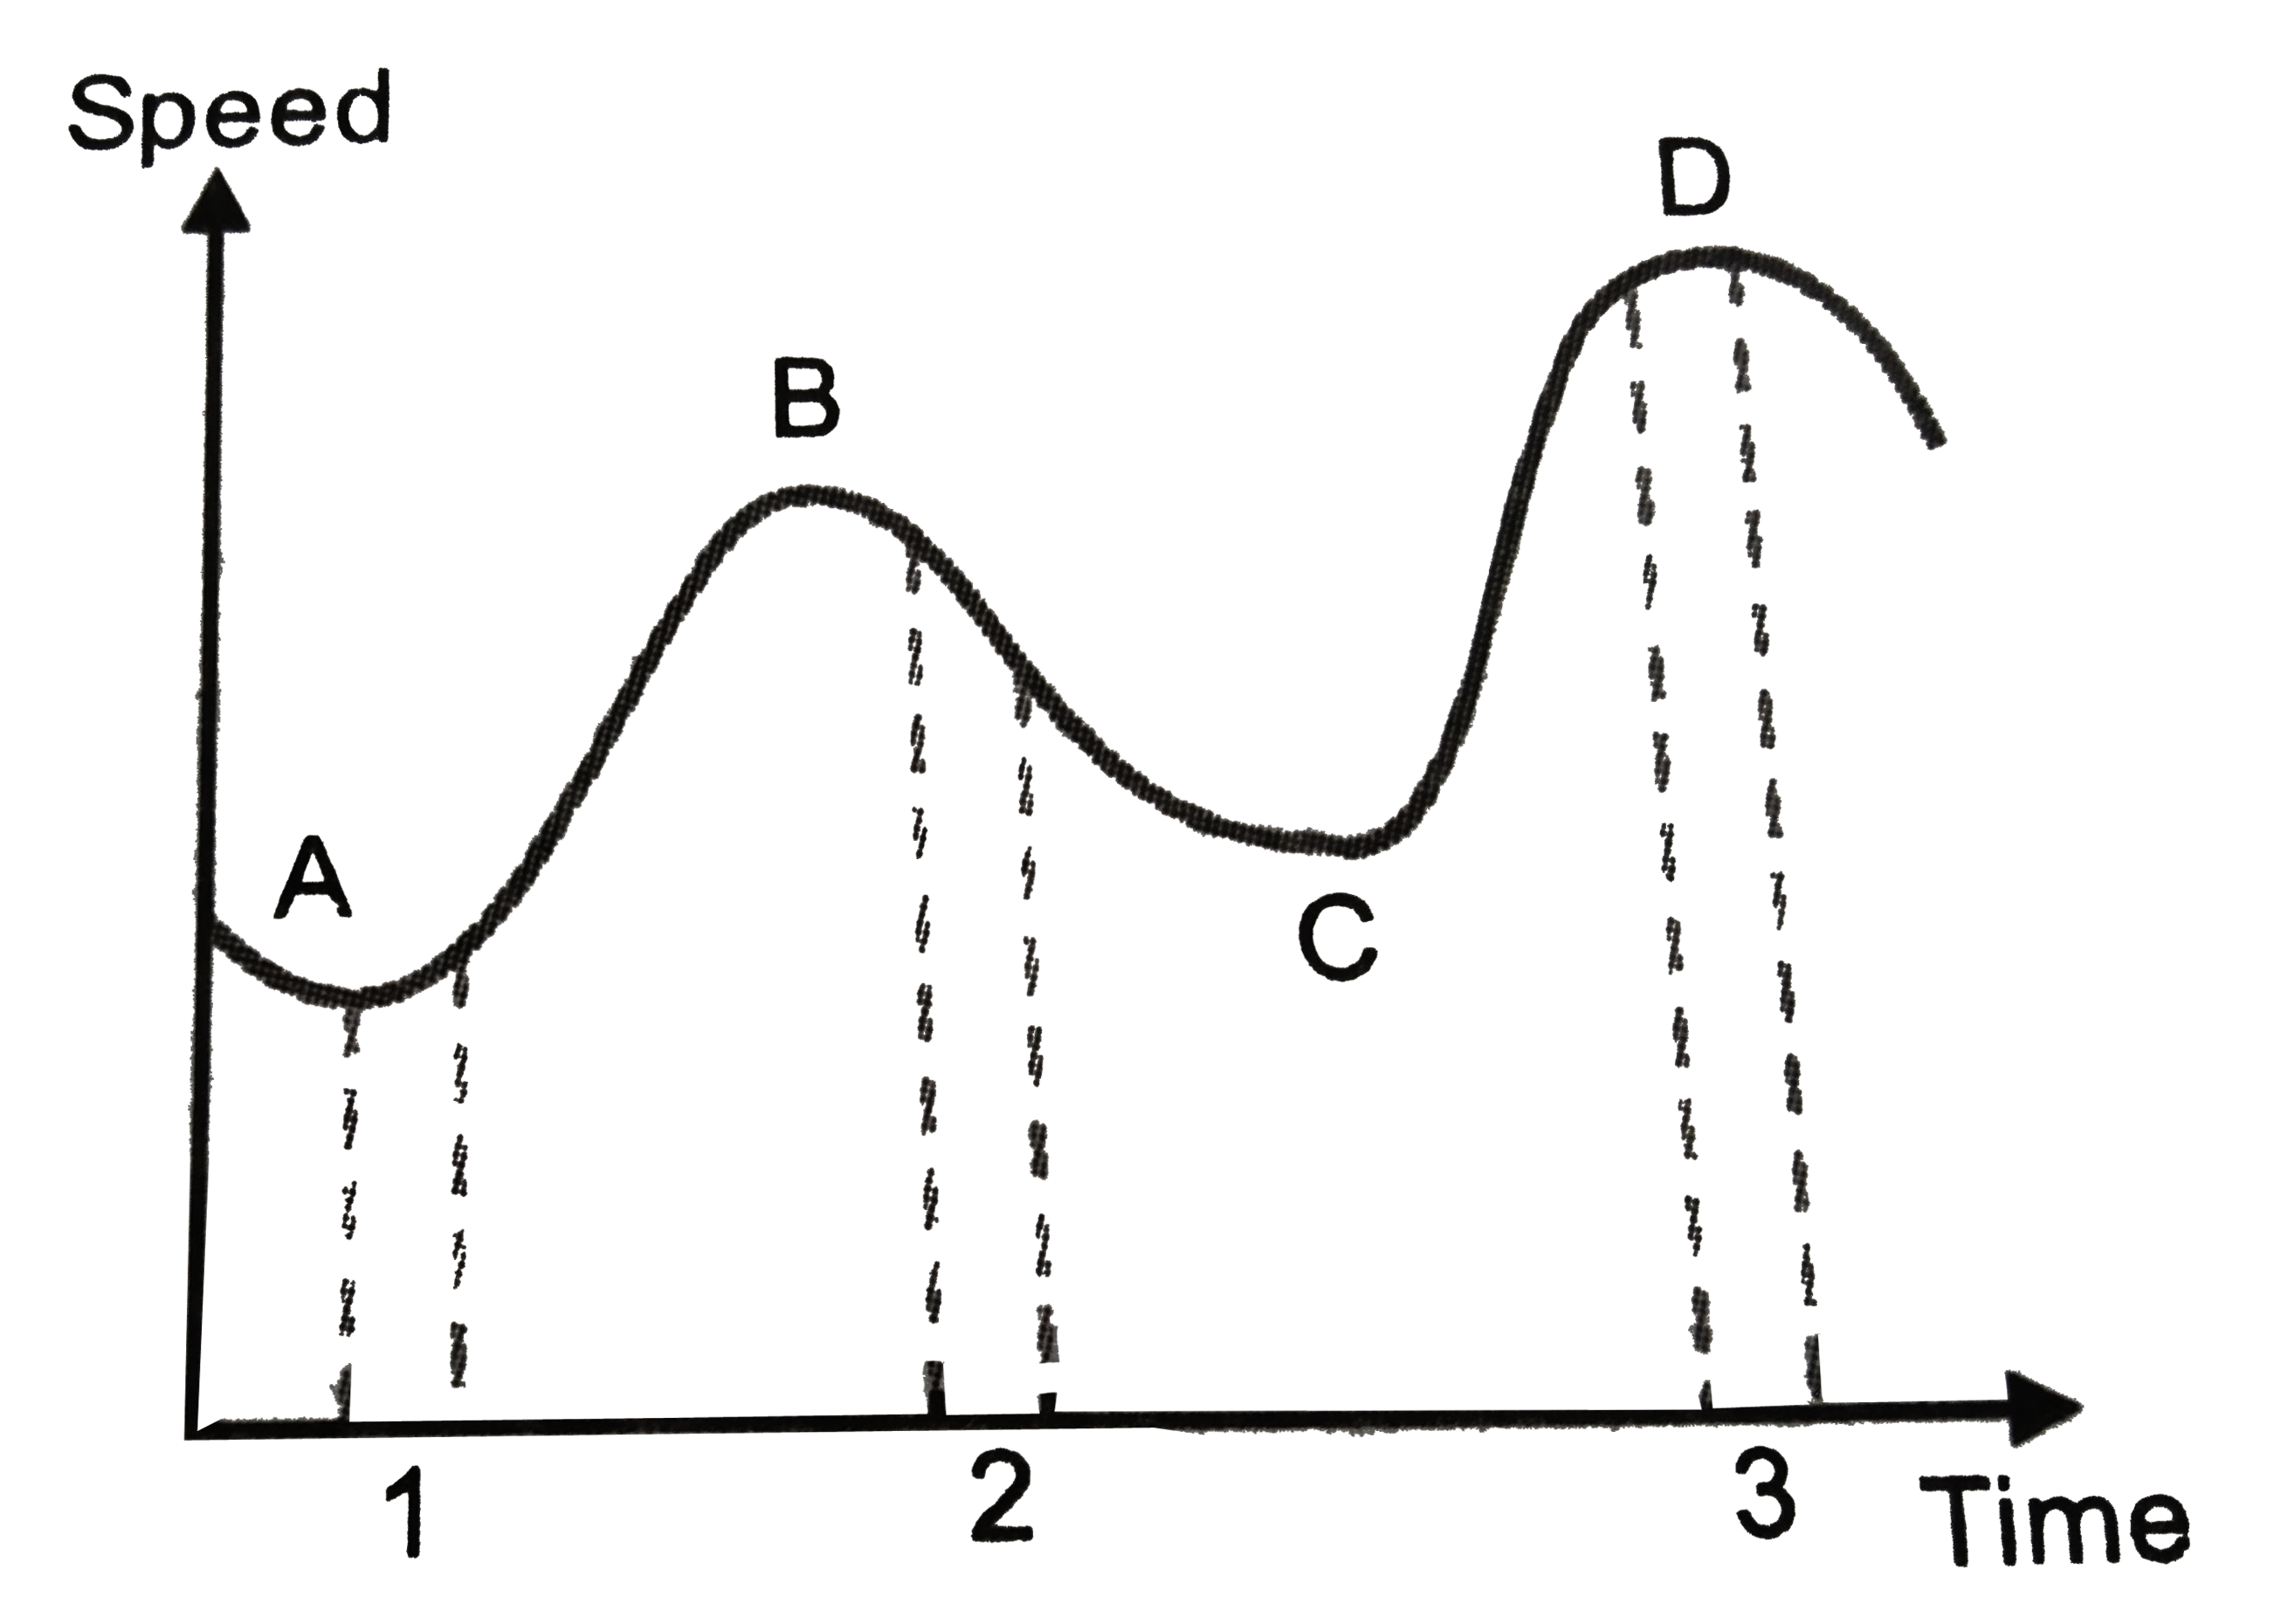
Figure 1.68 gives the speed -time graph of a particle in motion along a constant direction. Three equal intervals of time are shown. In which interval is the average acceleration greatest in magnitude ? In which interval is the average speed greatest? Choosing the positive direction as the constant direction of motion give the signs of v and a in the three intervals. What are the acceleration at the points A,B,C and D?

Acceleration magnitude greatest in 2, Speed greatest in 3, in 1,2,3, in 2, a =0 at A,B,C and D.
Topper's Solved these Questions
- ONE - DIMENSIONAL MOTION Book:CHHAYA PUBLICATIONChapter:ONE - DIMENSIONAL MOTION Exercise:ENTRANCE CORNER (Assertion-reason type )
Explore 12 Videos
- ONE - DIMENSIONAL MOTION Book:CHHAYA PUBLICATIONChapter:ONE - DIMENSIONAL MOTION Exercise:ENTRANCE CORNER (Multiple correct answers type )
Explore 10 Videos
- ONE - DIMENSIONAL MOTION Book:CHHAYA PUBLICATIONChapter:ONE - DIMENSIONAL MOTION Exercise:Problem Set - II ( Miscellaneous)
Explore 6 Videos
- NEWTONIAN GRAVITATION AND PLANETARY MOTIONBook:CHHAYA PUBLICATIONChapter:NEWTONIAN GRAVITATION AND PLANETARY MOTIONExercise:CBSE SCANNER
Explore 19 Videos
- QUESTION PAPERS OF NEET -2017Book:CHHAYA PUBLICATIONChapter:QUESTION PAPERS OF NEET -2017Exercise:QUESTION
Explore 32 Videos
Similar Questions
Given a speed-time graph of a particle in motion along a constant direction. Three equal intervals of time are shown. In which interval is the average acceleration greatest in magnitude? In which interval is the average speed greatest? Choosing the positive direction as the constant direction of motion, give the signs of v and a in the three intervals. What are the accelerations at the points A,B,C and D ?
 .
.
View SolutionFig. 2 (NCT). 10 . Give a speed-tiem graph of a particle in one dimenstional motion. Three different equal intervals of time are shwon. In which interval is the average acceleration graeatest in magnitude ? In which interval is the average speed greatest ? Choosing the positive direction as the constant direction of motion, give the signs of u and a in the three intervals. What are the acclerations at teh points A,B,C and D ?
 .
.
View Solution
Knowledge Check
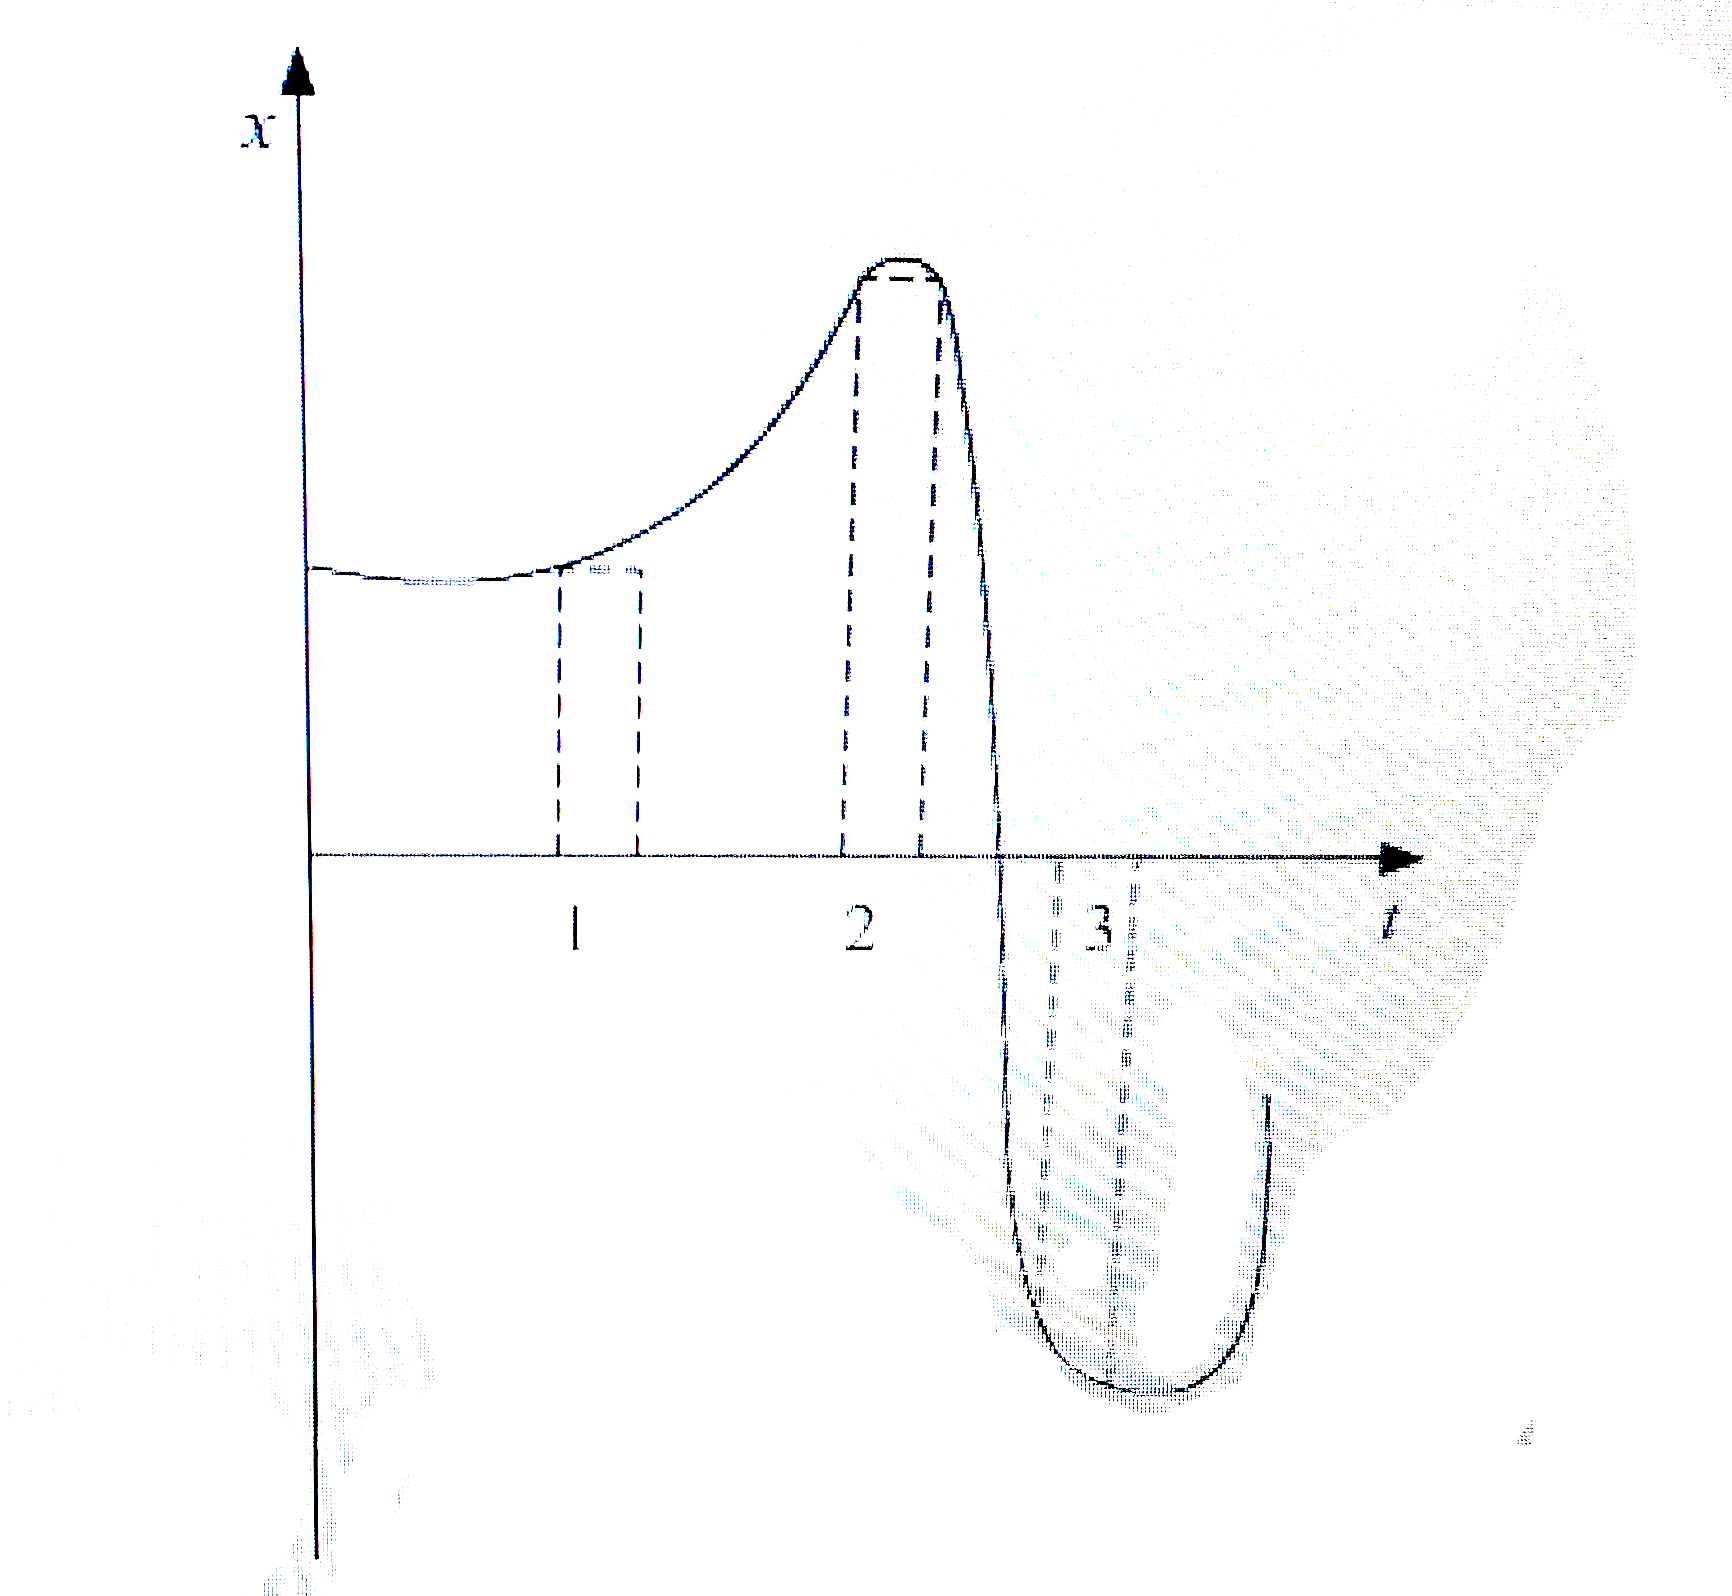
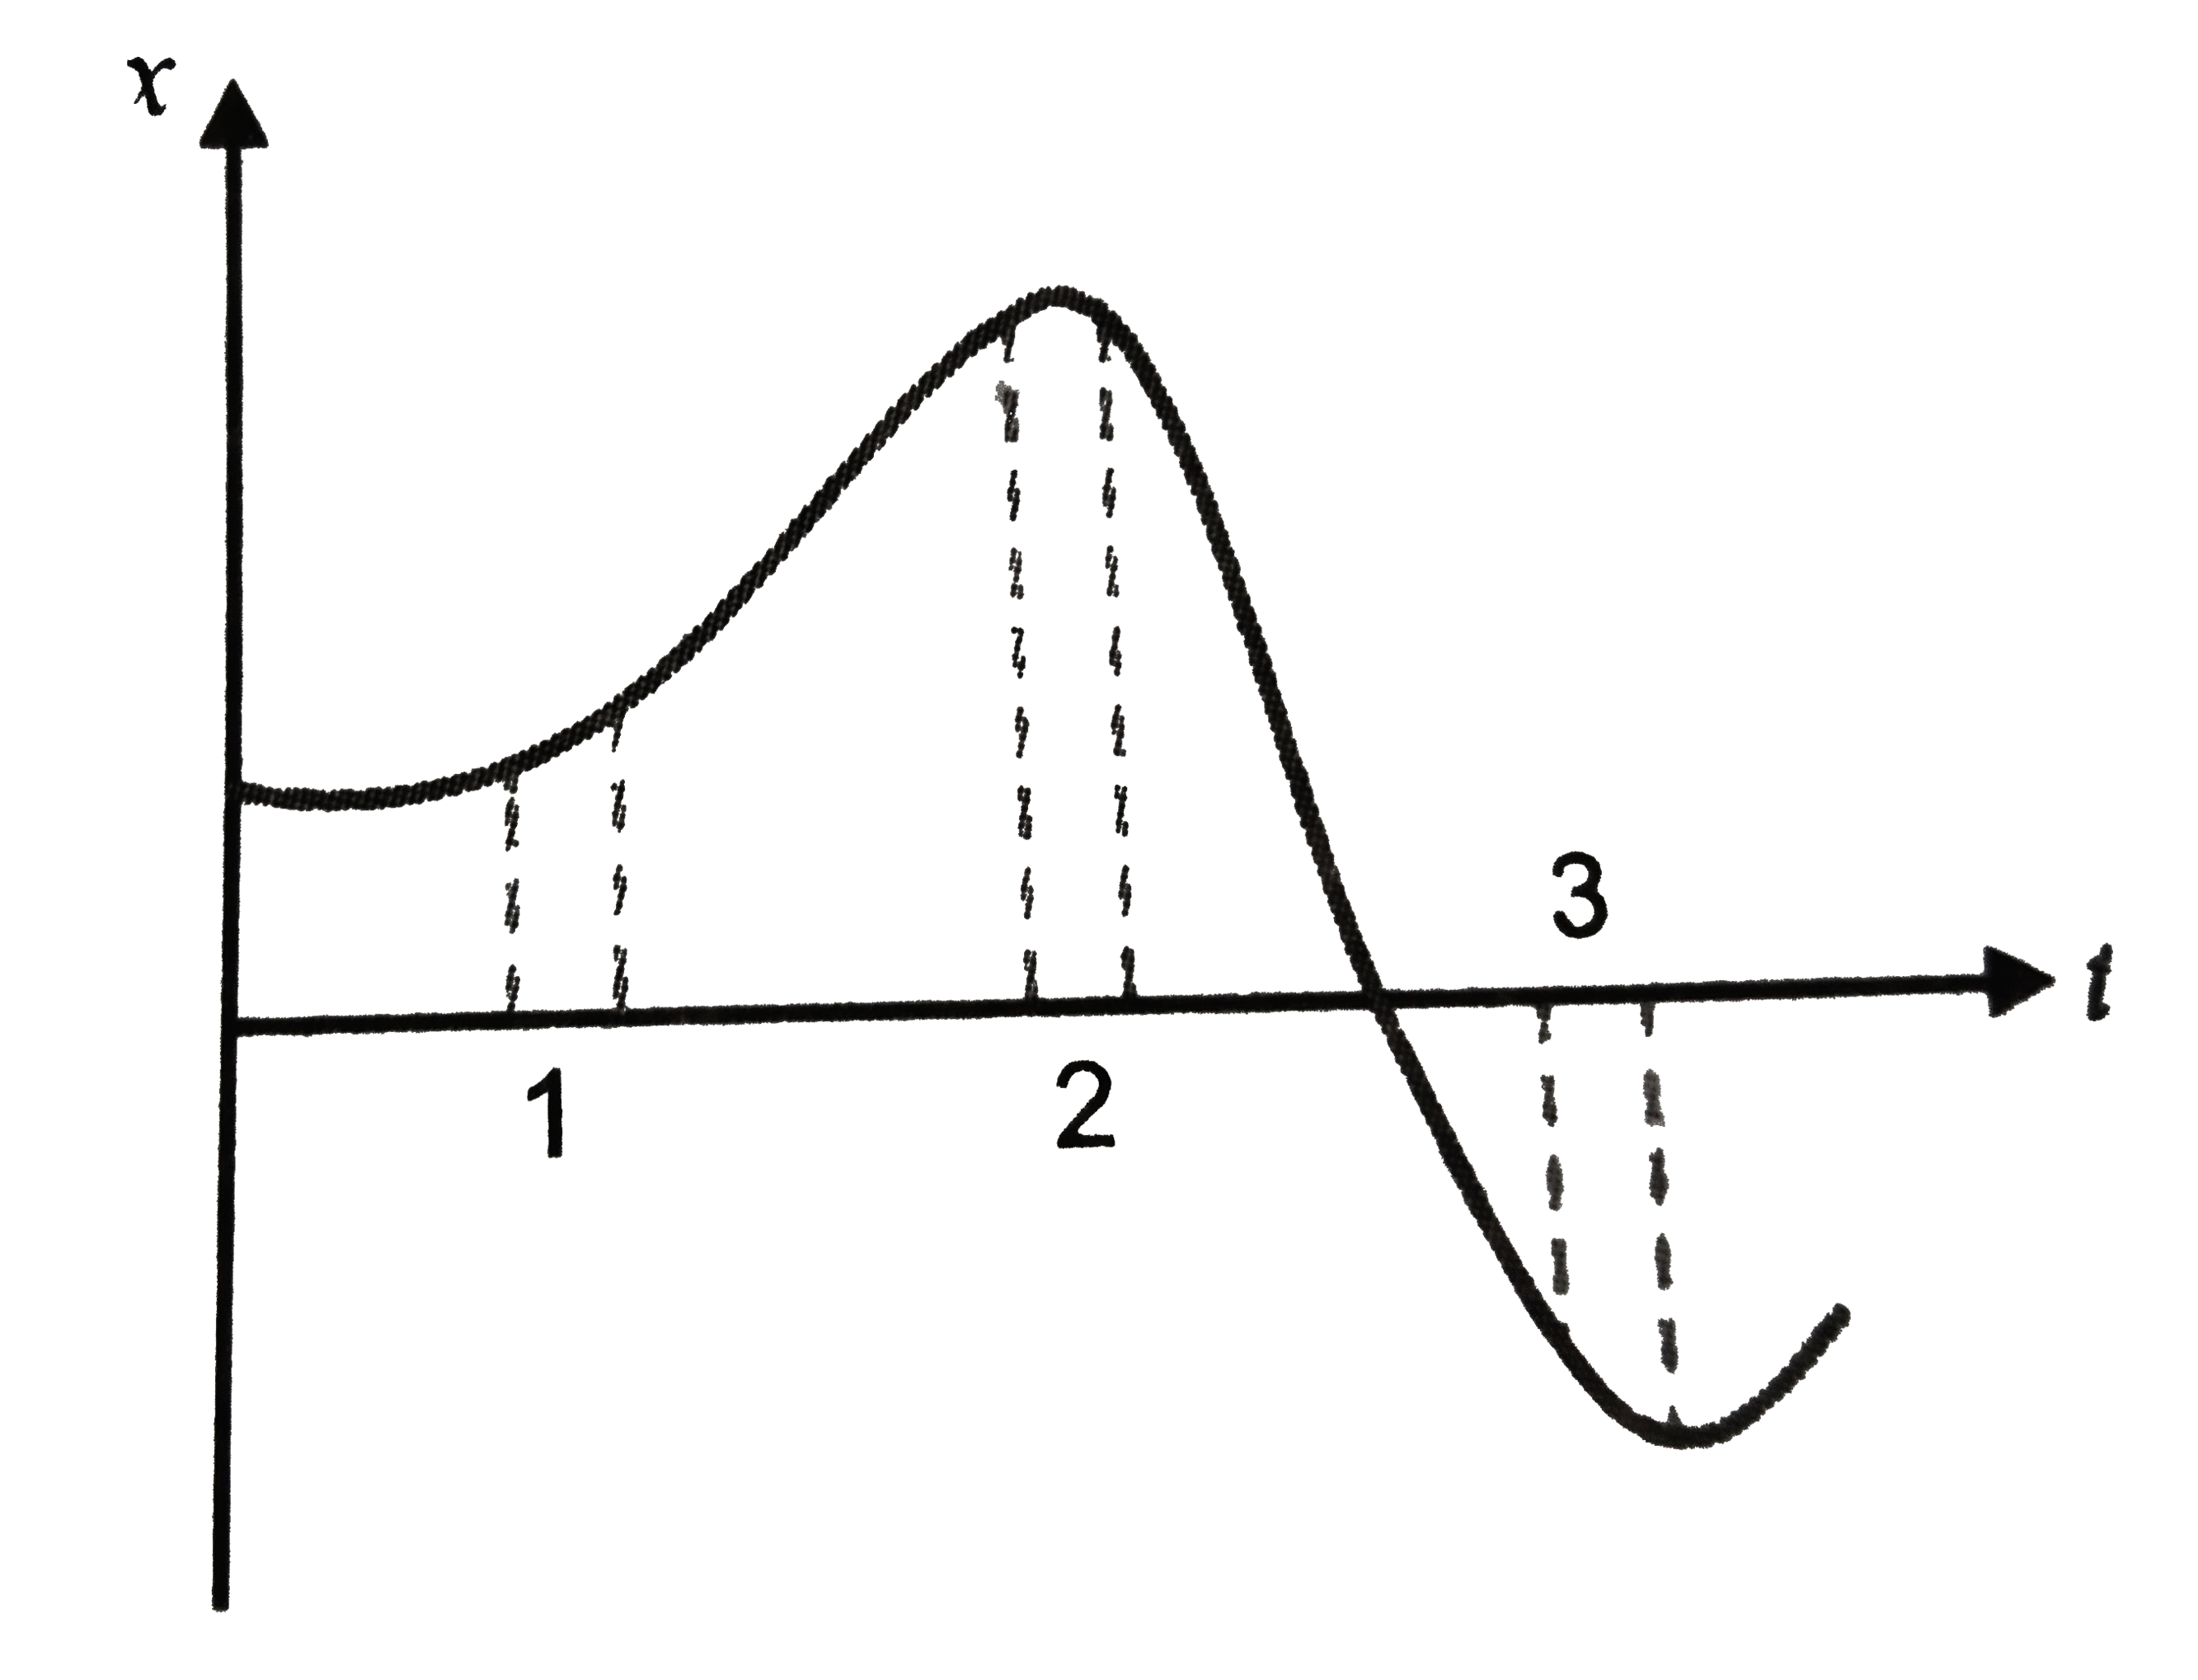
Figure 3.24 gives the x−t plot of a particle in one-dimensional motion. Three different equal intervals of time are shown. In which interval is the average speed greatest, and in which is it the least ? Give the sign of average velocity for each interval.
 Aν1 gt ν2Bν2>ν1Cν1=ν2Ddata is insufficient
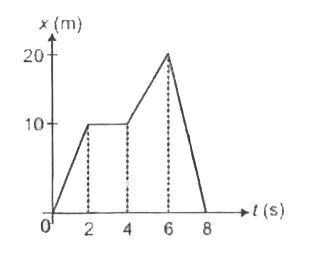
The position (x) - time (t) graph for a particle moving along a straight line is shown in figure. The average speed of particle in time interval t = 0 to t = 8 s is
 AZeroB5 m/sC7.5 m/sD9.7 m/s
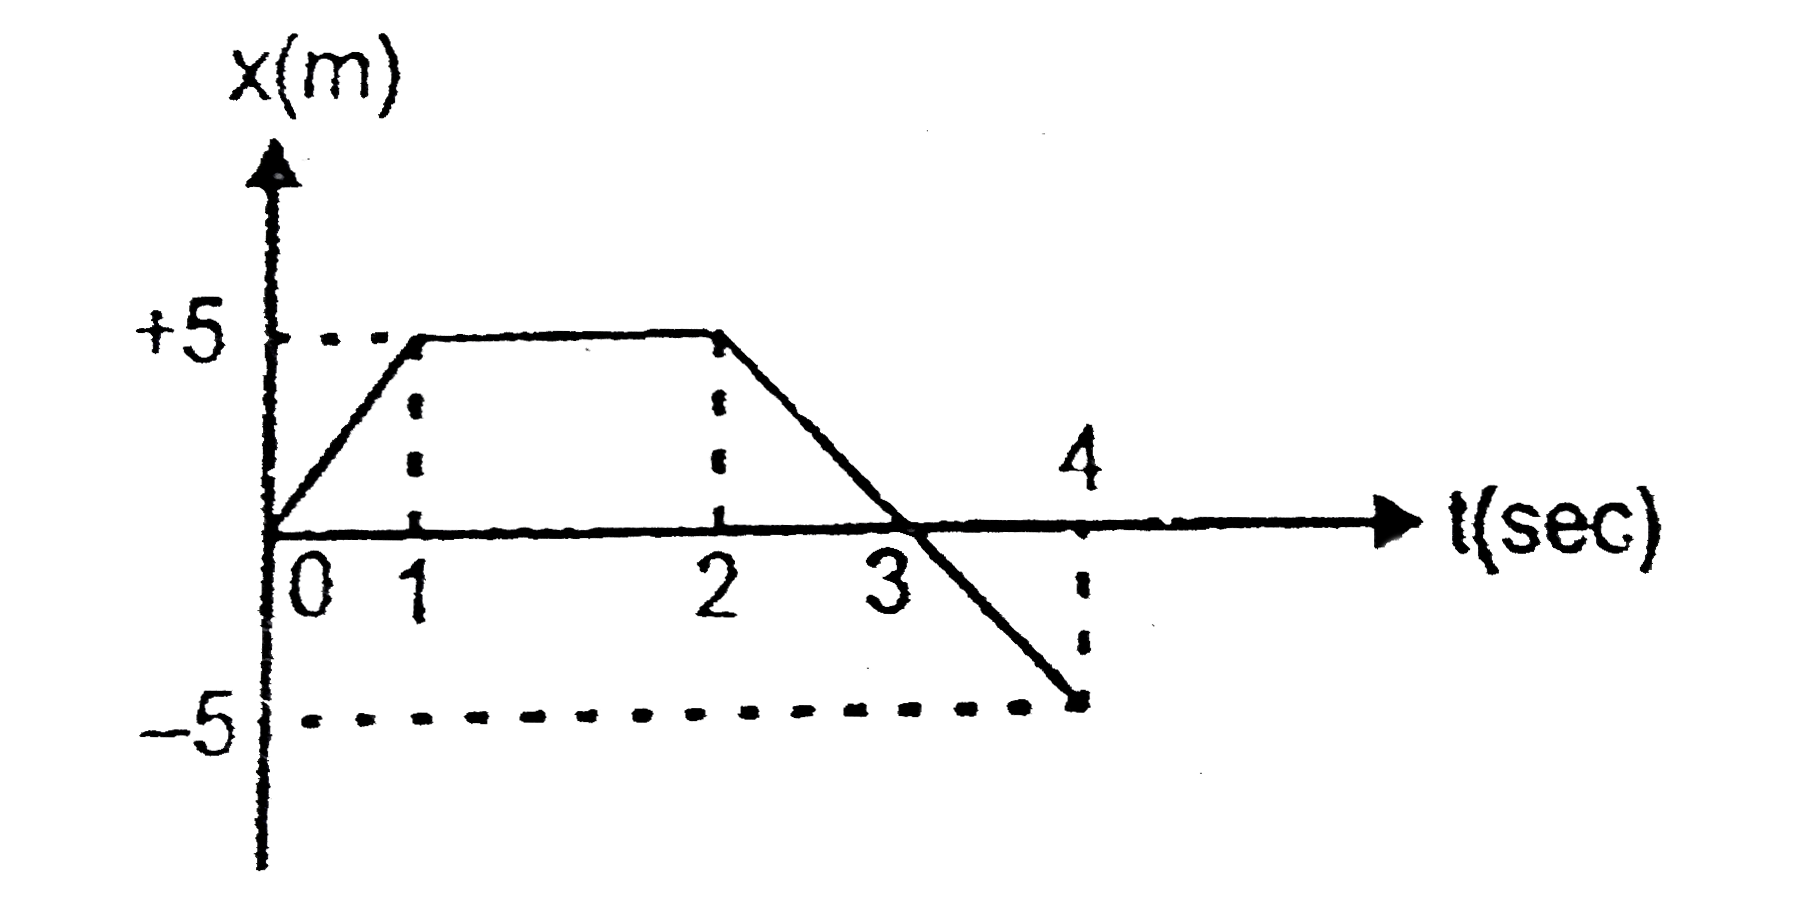
Position-time graph for a particle moving along x− direction is as shown in the figure. Average speed of the particle from t=0 to t=4 is :
 A154m/sB103m/sC52m/sD54m/s
Fig. show the x−t plot of a particle in one dimensional motion. Three different equal intervals of time are shown. In which interval the average speed is greatest and in which it is the least? Give the sign of average speed for each interval.
 .
.
View SolutionFig. 2 (NCT).9 show the x−t plot of a particle in one dimensional motion. Three different equal intervals of time are shown. In which interval the average speed is greatest and in which it is the least ? Give the sign of average speed for each interval.
 .
.
View SolutionThe speed-time graph of a particle moving along a fixed direction is shown in the Fig. The distance traversed by the particle between (a) t=0s→10s .
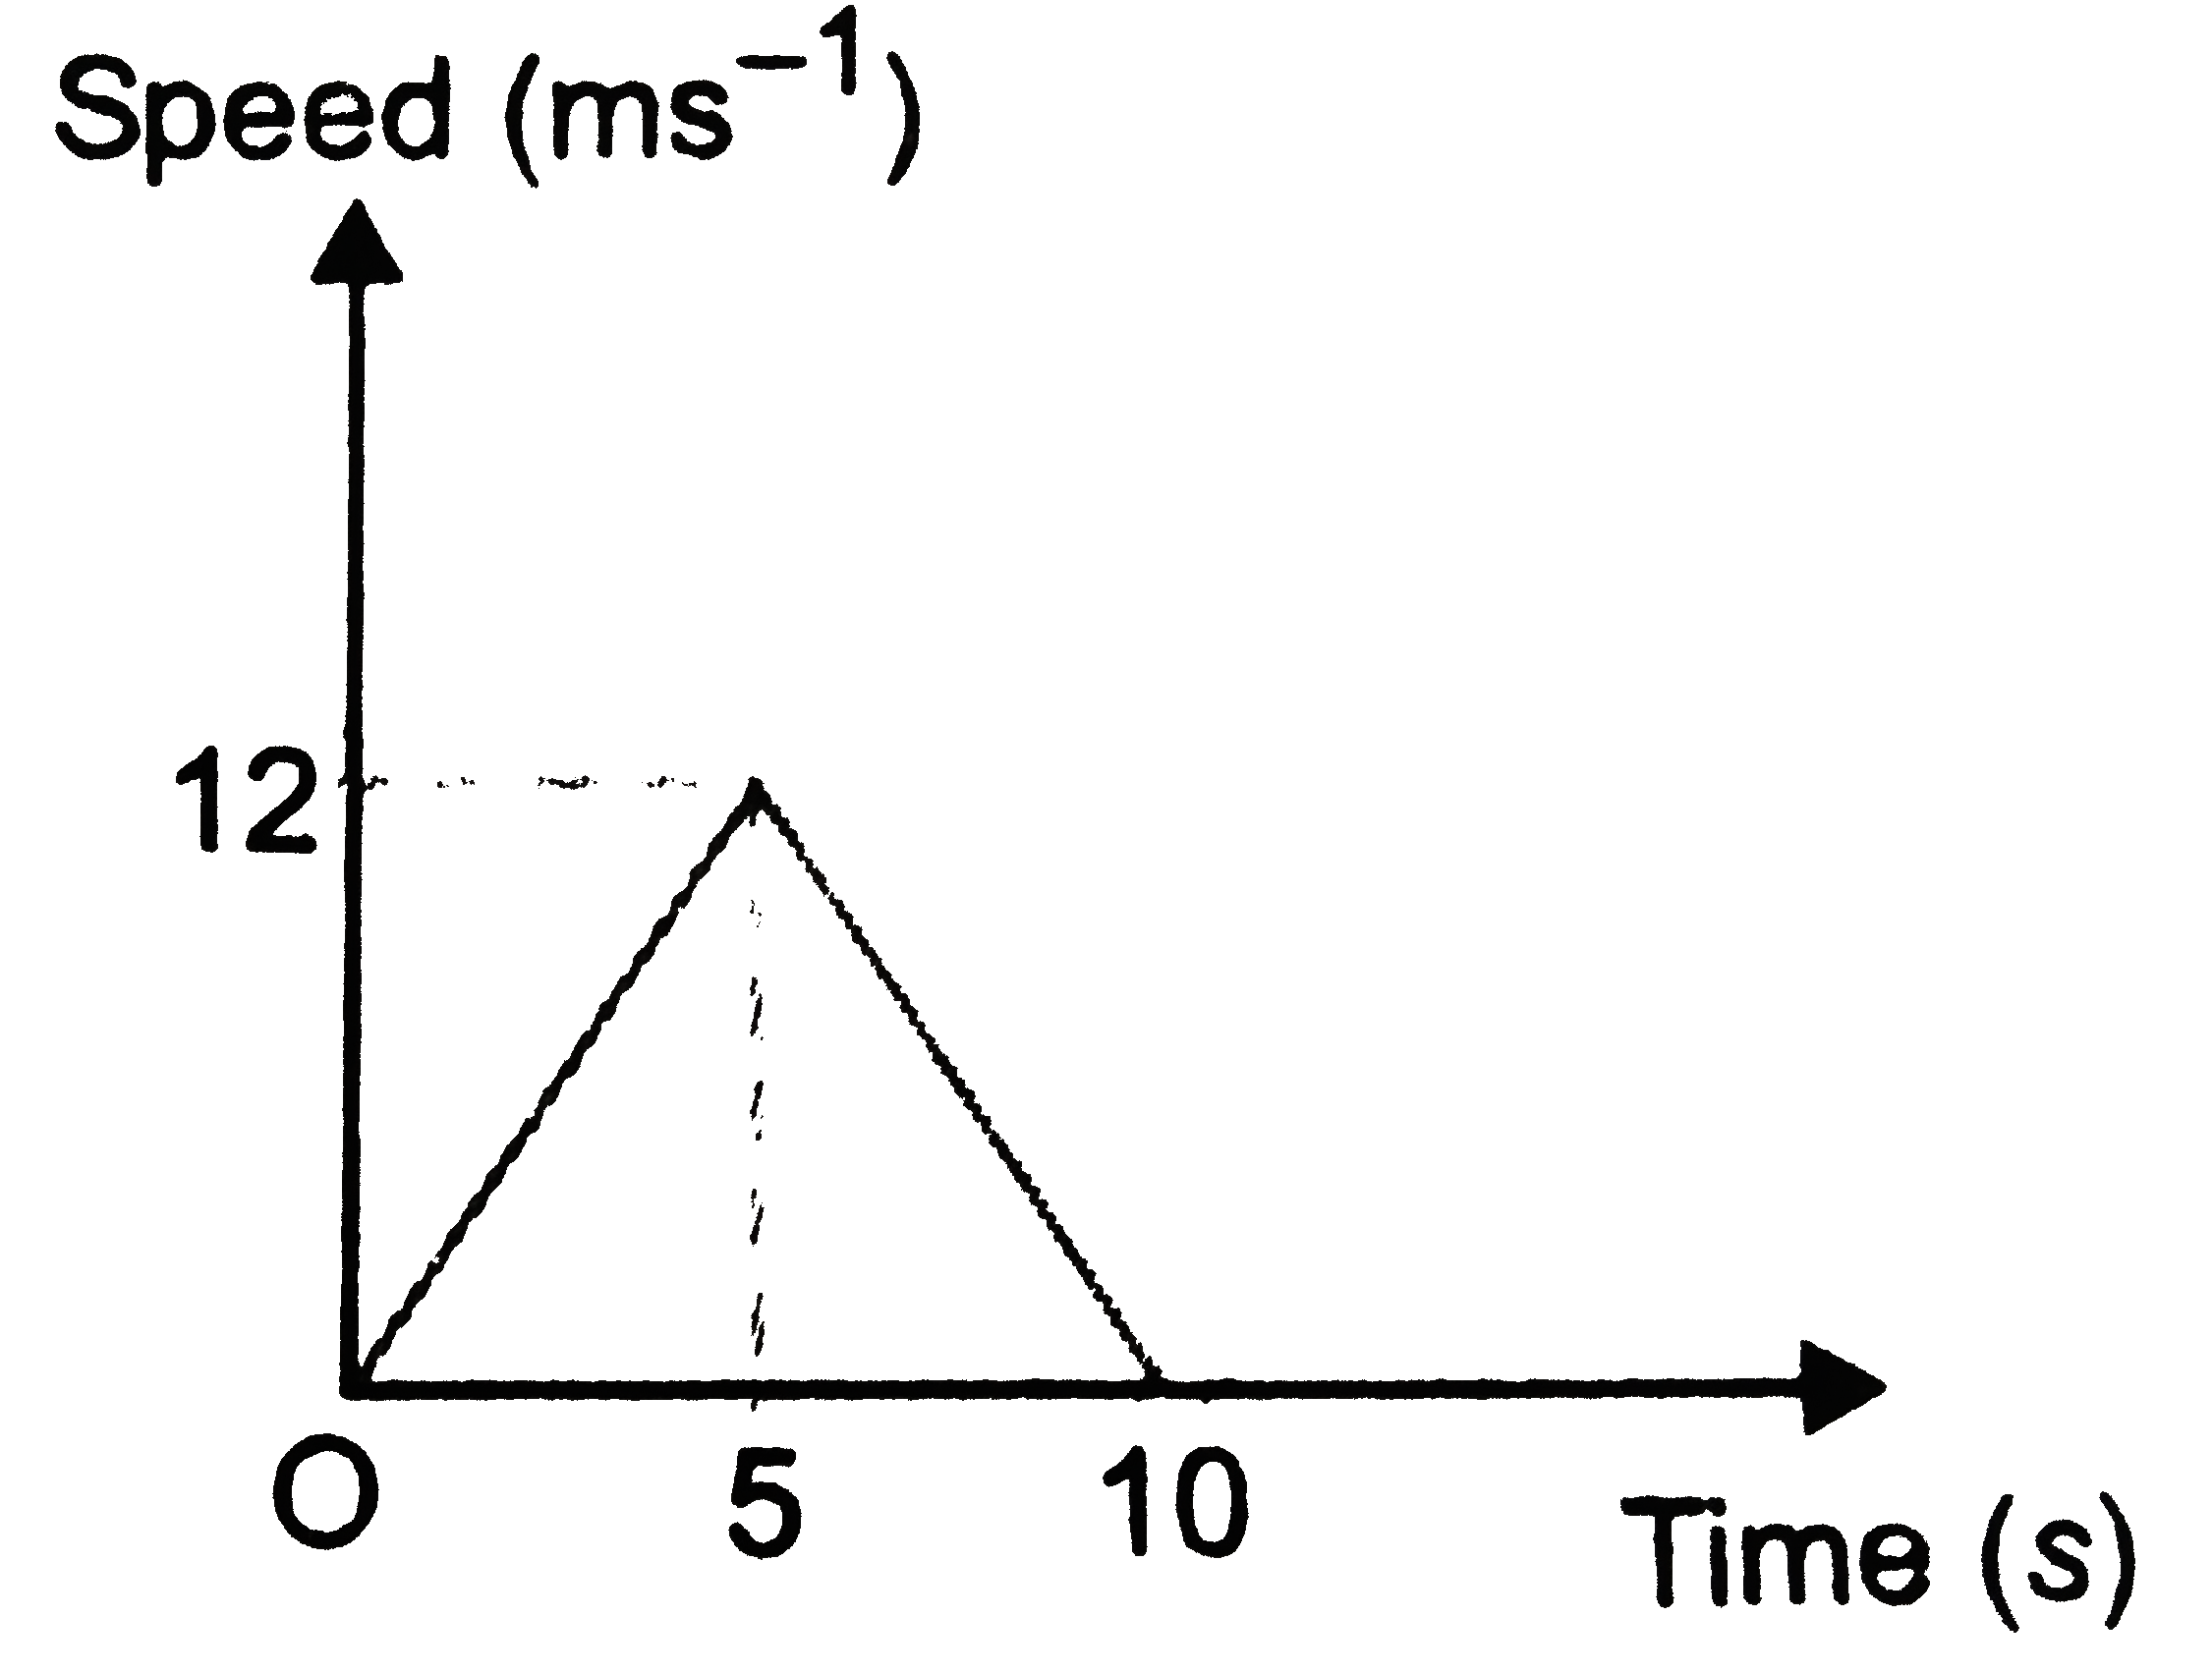 .
what is the average speed of the particle over the intervals?
View SolutionThe speed-time graph of a particle moving along a fixed direction is shown in figure. Obtain the distance traversed by the particle between (a)t=0s to 10s(b)t=2s to 6s
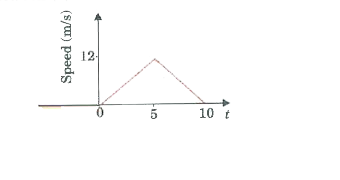
What is the average speed of the particle over the intervals in a and b?
View SolutionThe position (x) - time (t) graph for a particle moving along a straight line is shown in figure. The average speed of particle in time interval t = 0 to t = 8 s is

View Solution
