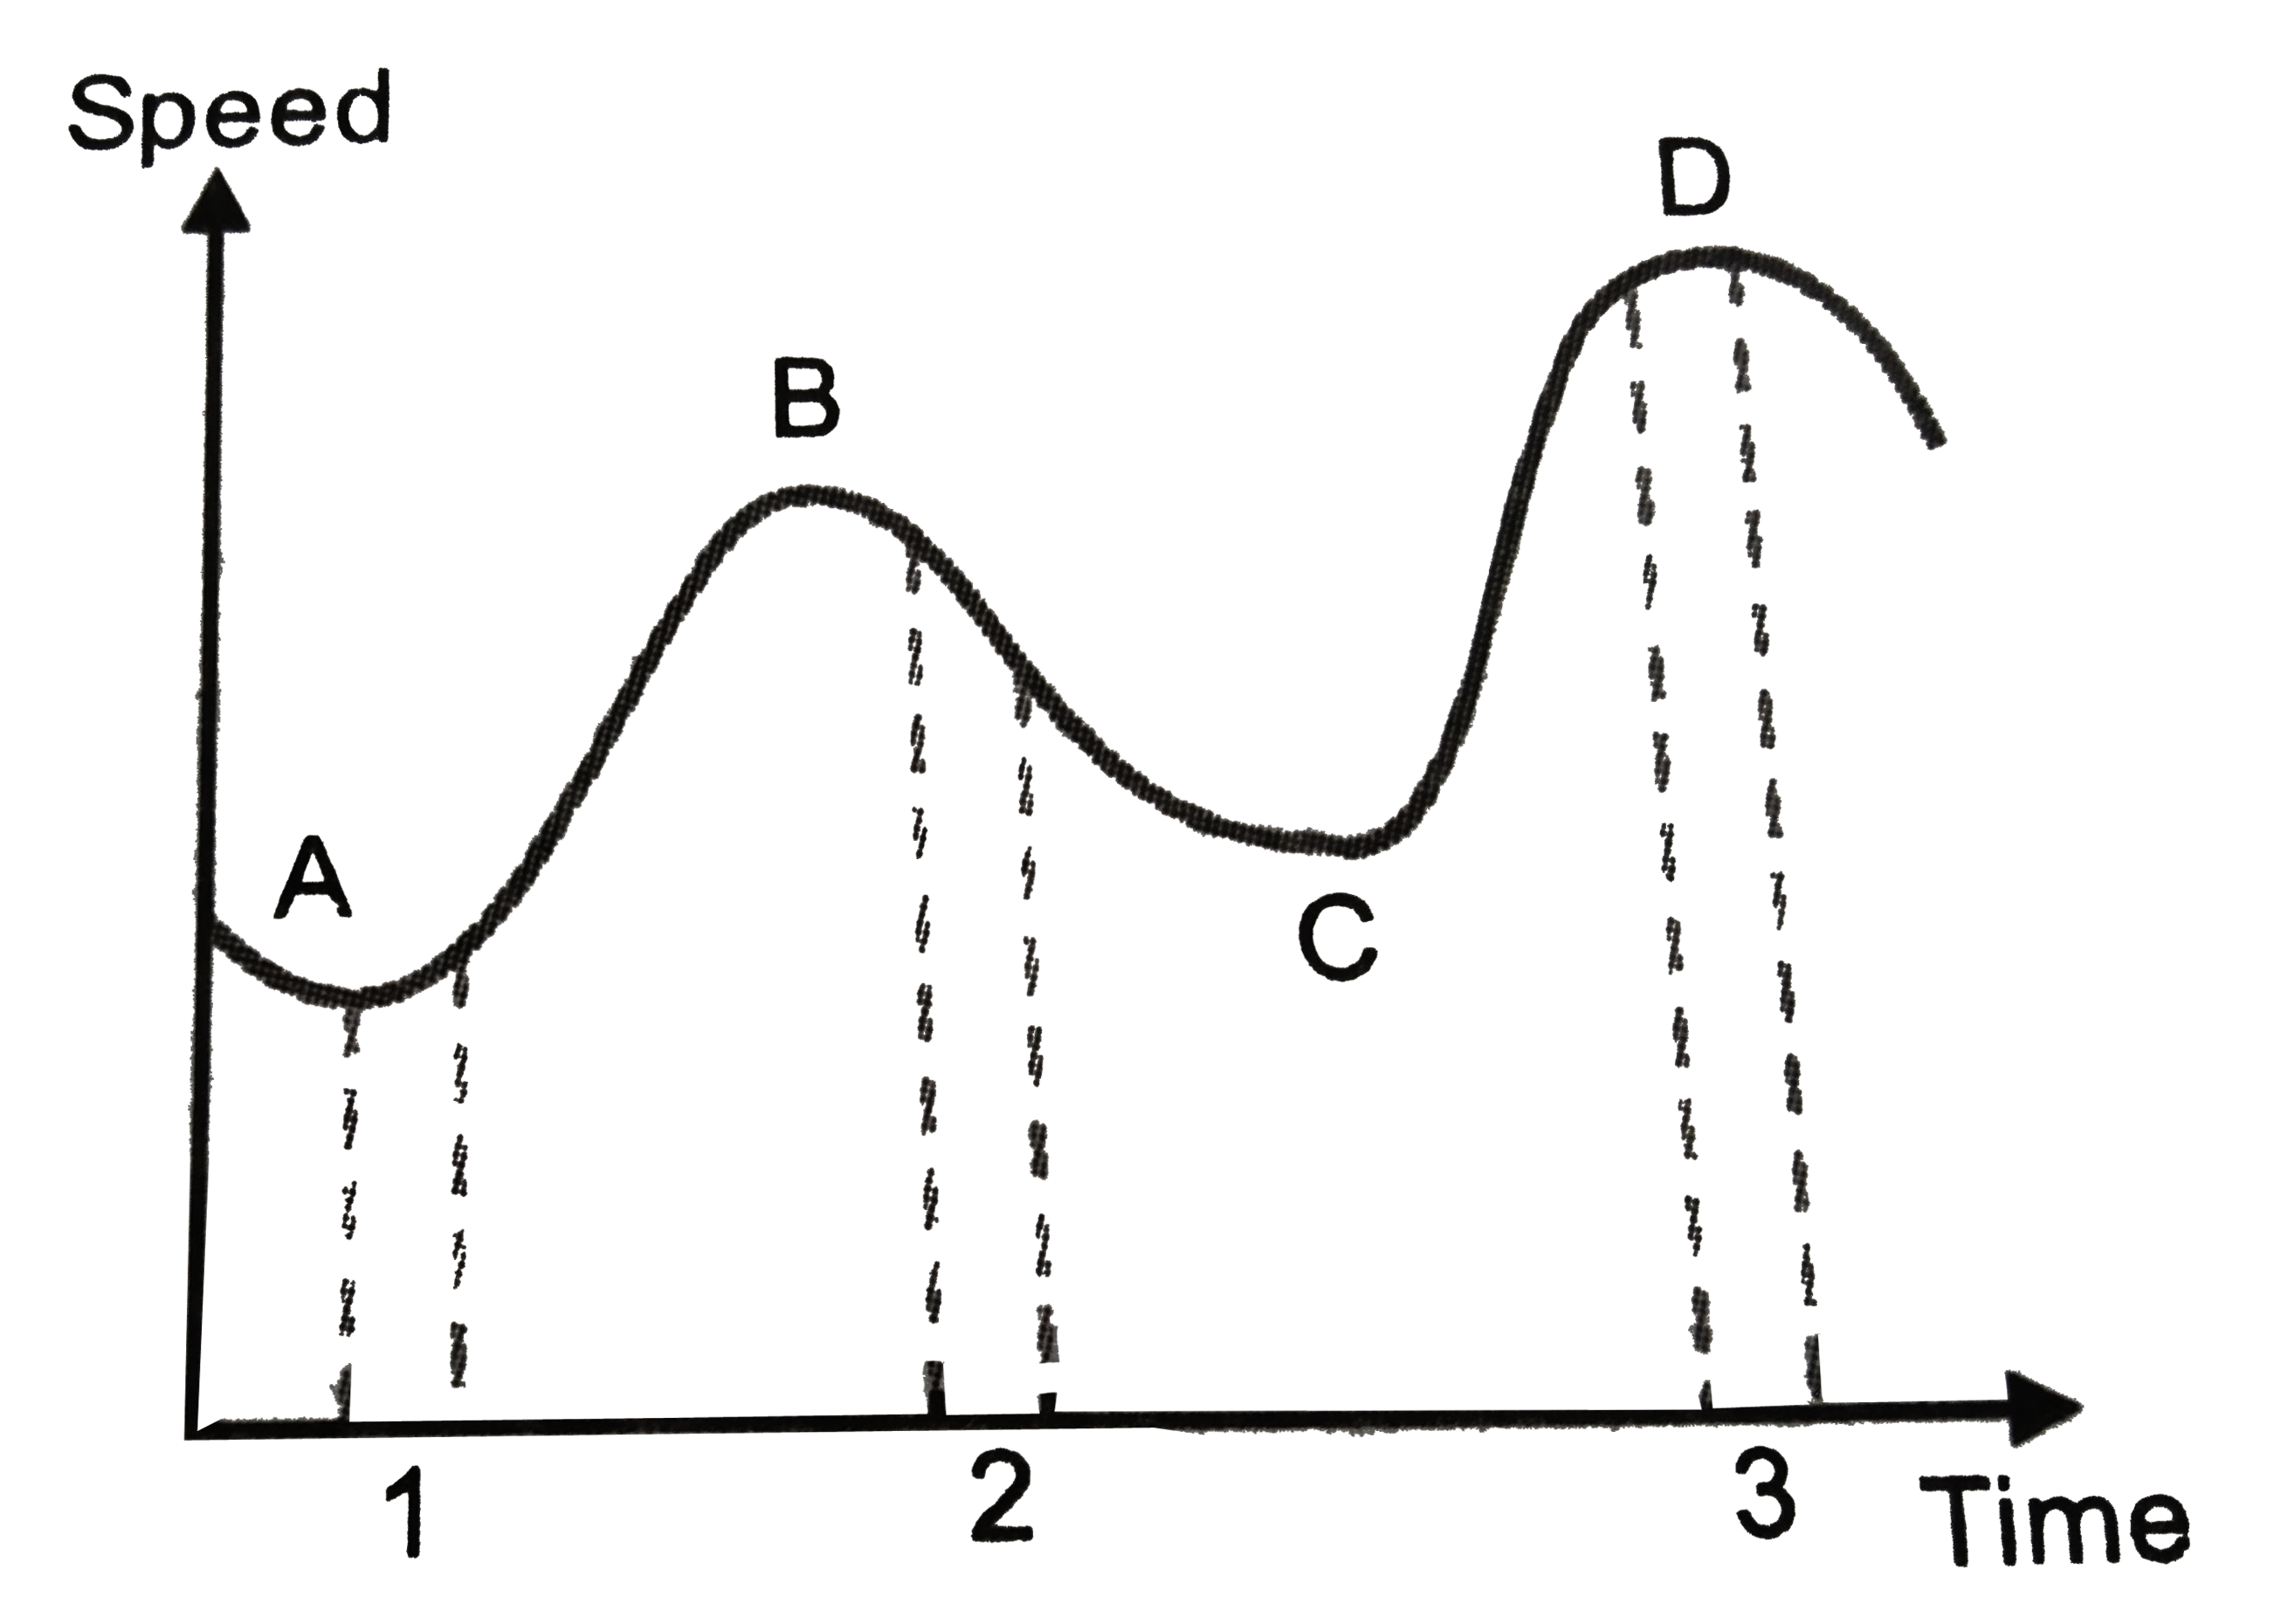
Fig. 2 (NCT). 10 . Give a speed-tiem graph of a particle in one dimenstional motion. Three different equal intervals of time are shwon. In which interval is the average acceleration graeatest in magnitude ? In which interval is the average speed greatest ? Choosing the positive direction as the constant direction of motion, give the signs of u and a in the three intervals. What are the acclerations at teh points A,B,C and D ?
 .
.
We know that average acceleration in a small interval of time is equal to slope of velocity-time graph in that interval .as the slope of velocity-time graph is maximum in interval 2 as compared to other intervals 1 and 3, hence the magnitude of average accelration is greatest in interval 2.
The average speed is greatest in interval 3 for obvious reasons.
In interval 1, the slope of verlocity-time graph is positive, hence accelration a is positive, the speed (u) is positive in this interval due to obvious reasons.
In niterval 2, the slope of velocity-tiem graph is negative, hence acceleration 9a) is negative, The speed (u) is positive in this interval dueto obvious reasons . ltbgt In interval , the velocity-time graph is parallelto time axis, therefore accelration 9a0 zero in this interval but (v) is positive due to obvious reasions.
AT points A,B and C the velocit-time graph is parallel to time axis . Therefore accelration (a0 iszero at all the four points.
Topper's Solved these Questions
- BOOK - PRADEEPCHAPTER - KINEMATICSEXERCISE - Additional Exercises13videos
KINEMATICS
- BOOK - PRADEEPCHAPTER - KINEMATICSEXERCISE - Motion25videos
KINEMATICS
- BOOK - PRADEEPCHAPTER - KINEMATICSEXERCISE - Advanced Problems20videos
KINEMATICS
- BOOK - PRADEEPCHAPTER - GRAVIATIONEXERCISE - Assertion-Reason Type Questions19videos
GRAVIATION
- BOOK - PRADEEPCHAPTER - LAWS OF MOTIONEXERCISE - Assertion- Reason Type Questions17videos
LAWS OF MOTION
Similar Questions
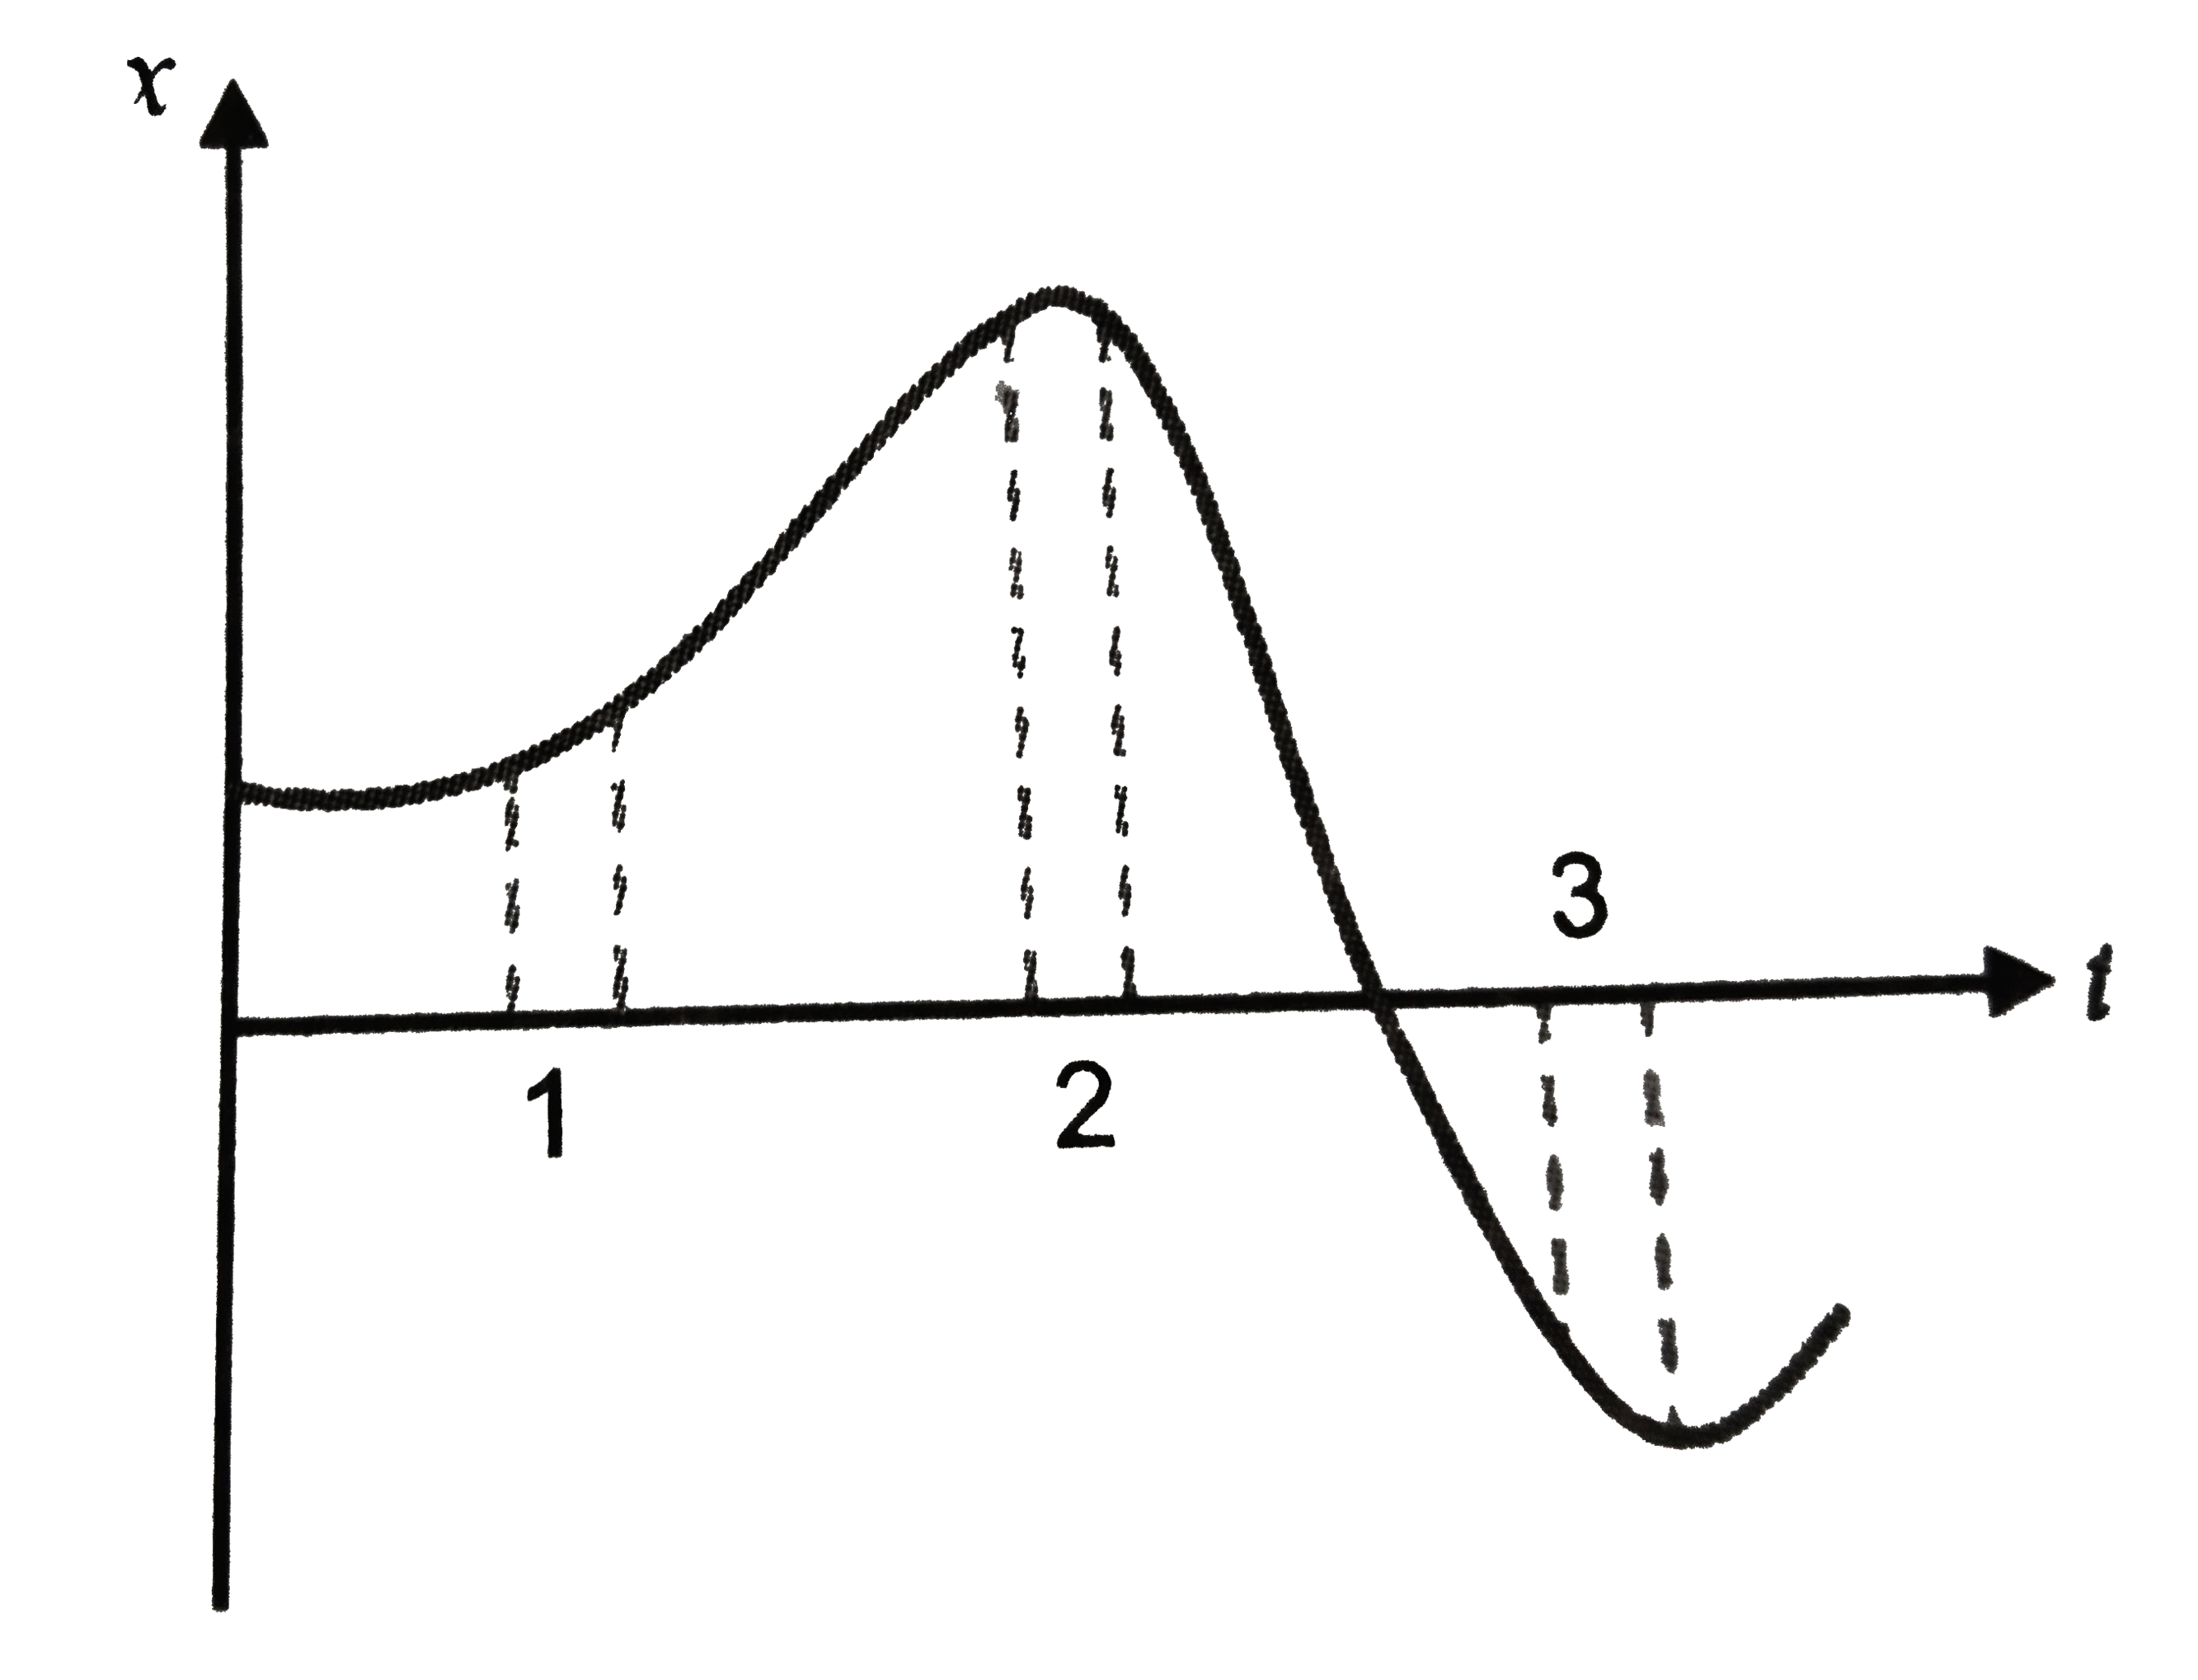
Fig. 2 (NCT).9 show the x−t plot of a particle in one dimensional motion. Three different equal intervals of time are shown. In which interval the average speed is greatest and in which it is the least ? Give the sign of average speed for each interval.
 .View Solution
s-t graph of a particle in motion is shown in Fig. Calculate
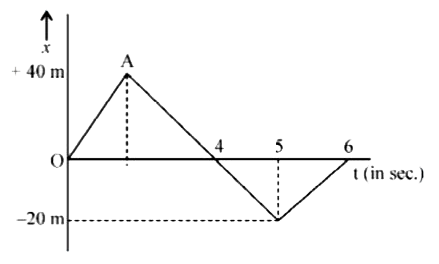
Average speedView Solution
Knowledge Check
- Question 1 - Select One
The motion that is repeated at regular interval of time is
Avibratory motionBlinear motionCrandom motionDnone of these. - Question 2 - Select One
Veolocity-time graph of a particle undergoing rectilinear motioin is plotted upto t=t4 as shown in the figure. Average acceleration of the particle is zero in the time internal between
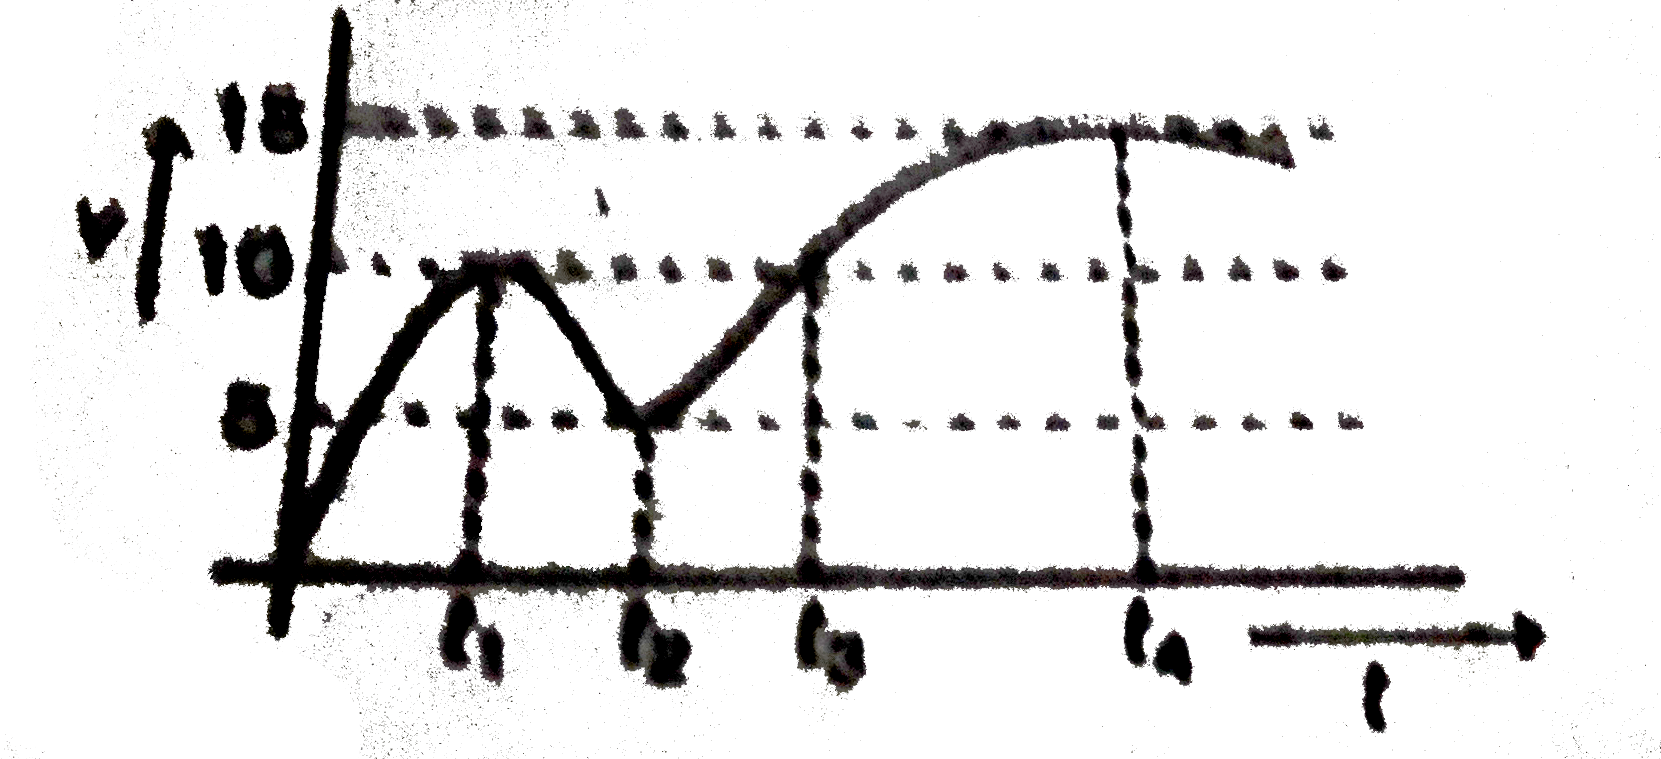 A0 and t1Bt1 and t2Ct1 and t3Dt2 and t4
 - Question 3 - Select One
The velocity-time graph of a particle in one-dimensional motion is shown in the figure. Which of the following formulae is correct for describing the motion of the particle over the time interval t1 to t2?
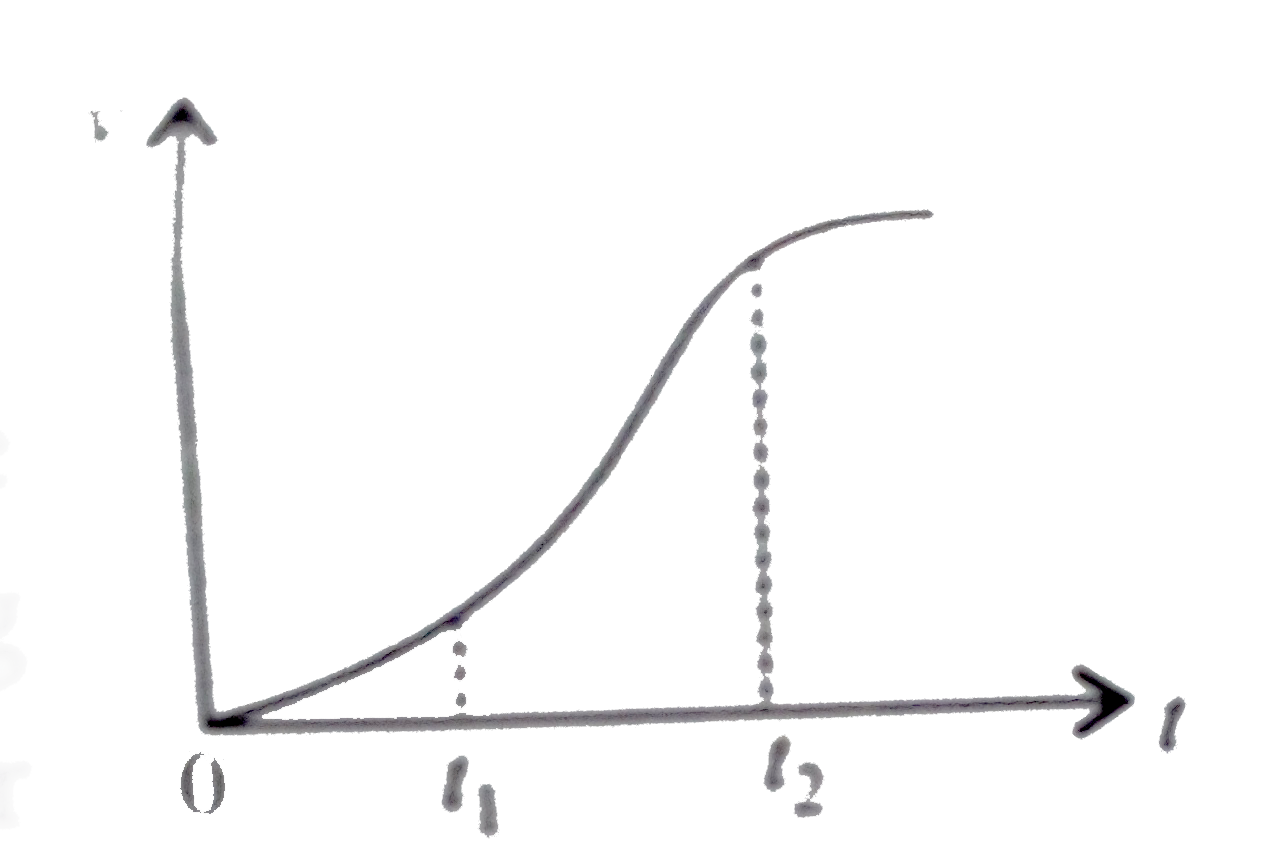 Ax(t2)=x(t1)+v(t1)(t2−t1)+(12)a(t2−t1)2Bv(t2)=v(t1)+a(t2−t1)Cvaverage=x(t2)+x(t1)t2−t1Daaverage=v(t2)−v(t1)t2−t1
Fig. 3.39 shows the acceleration - time graph for a particle in rectilinear motion. Find the average acceleration in first 20 s.
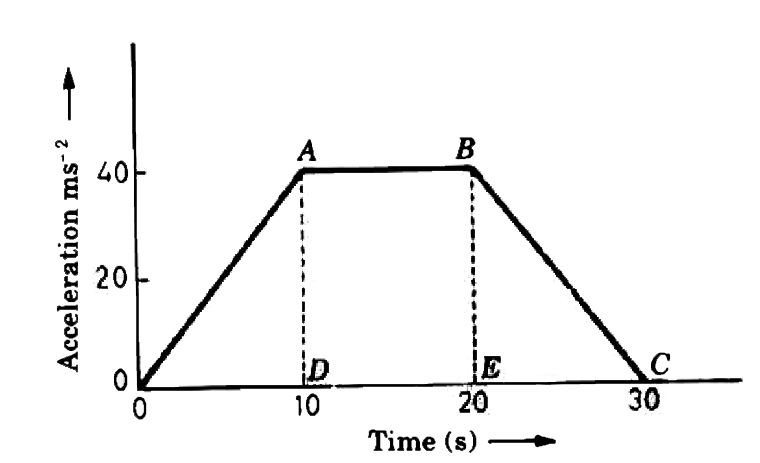 View Solution
The v-t graph for a particle moving along x-axis is shown in the figure, find
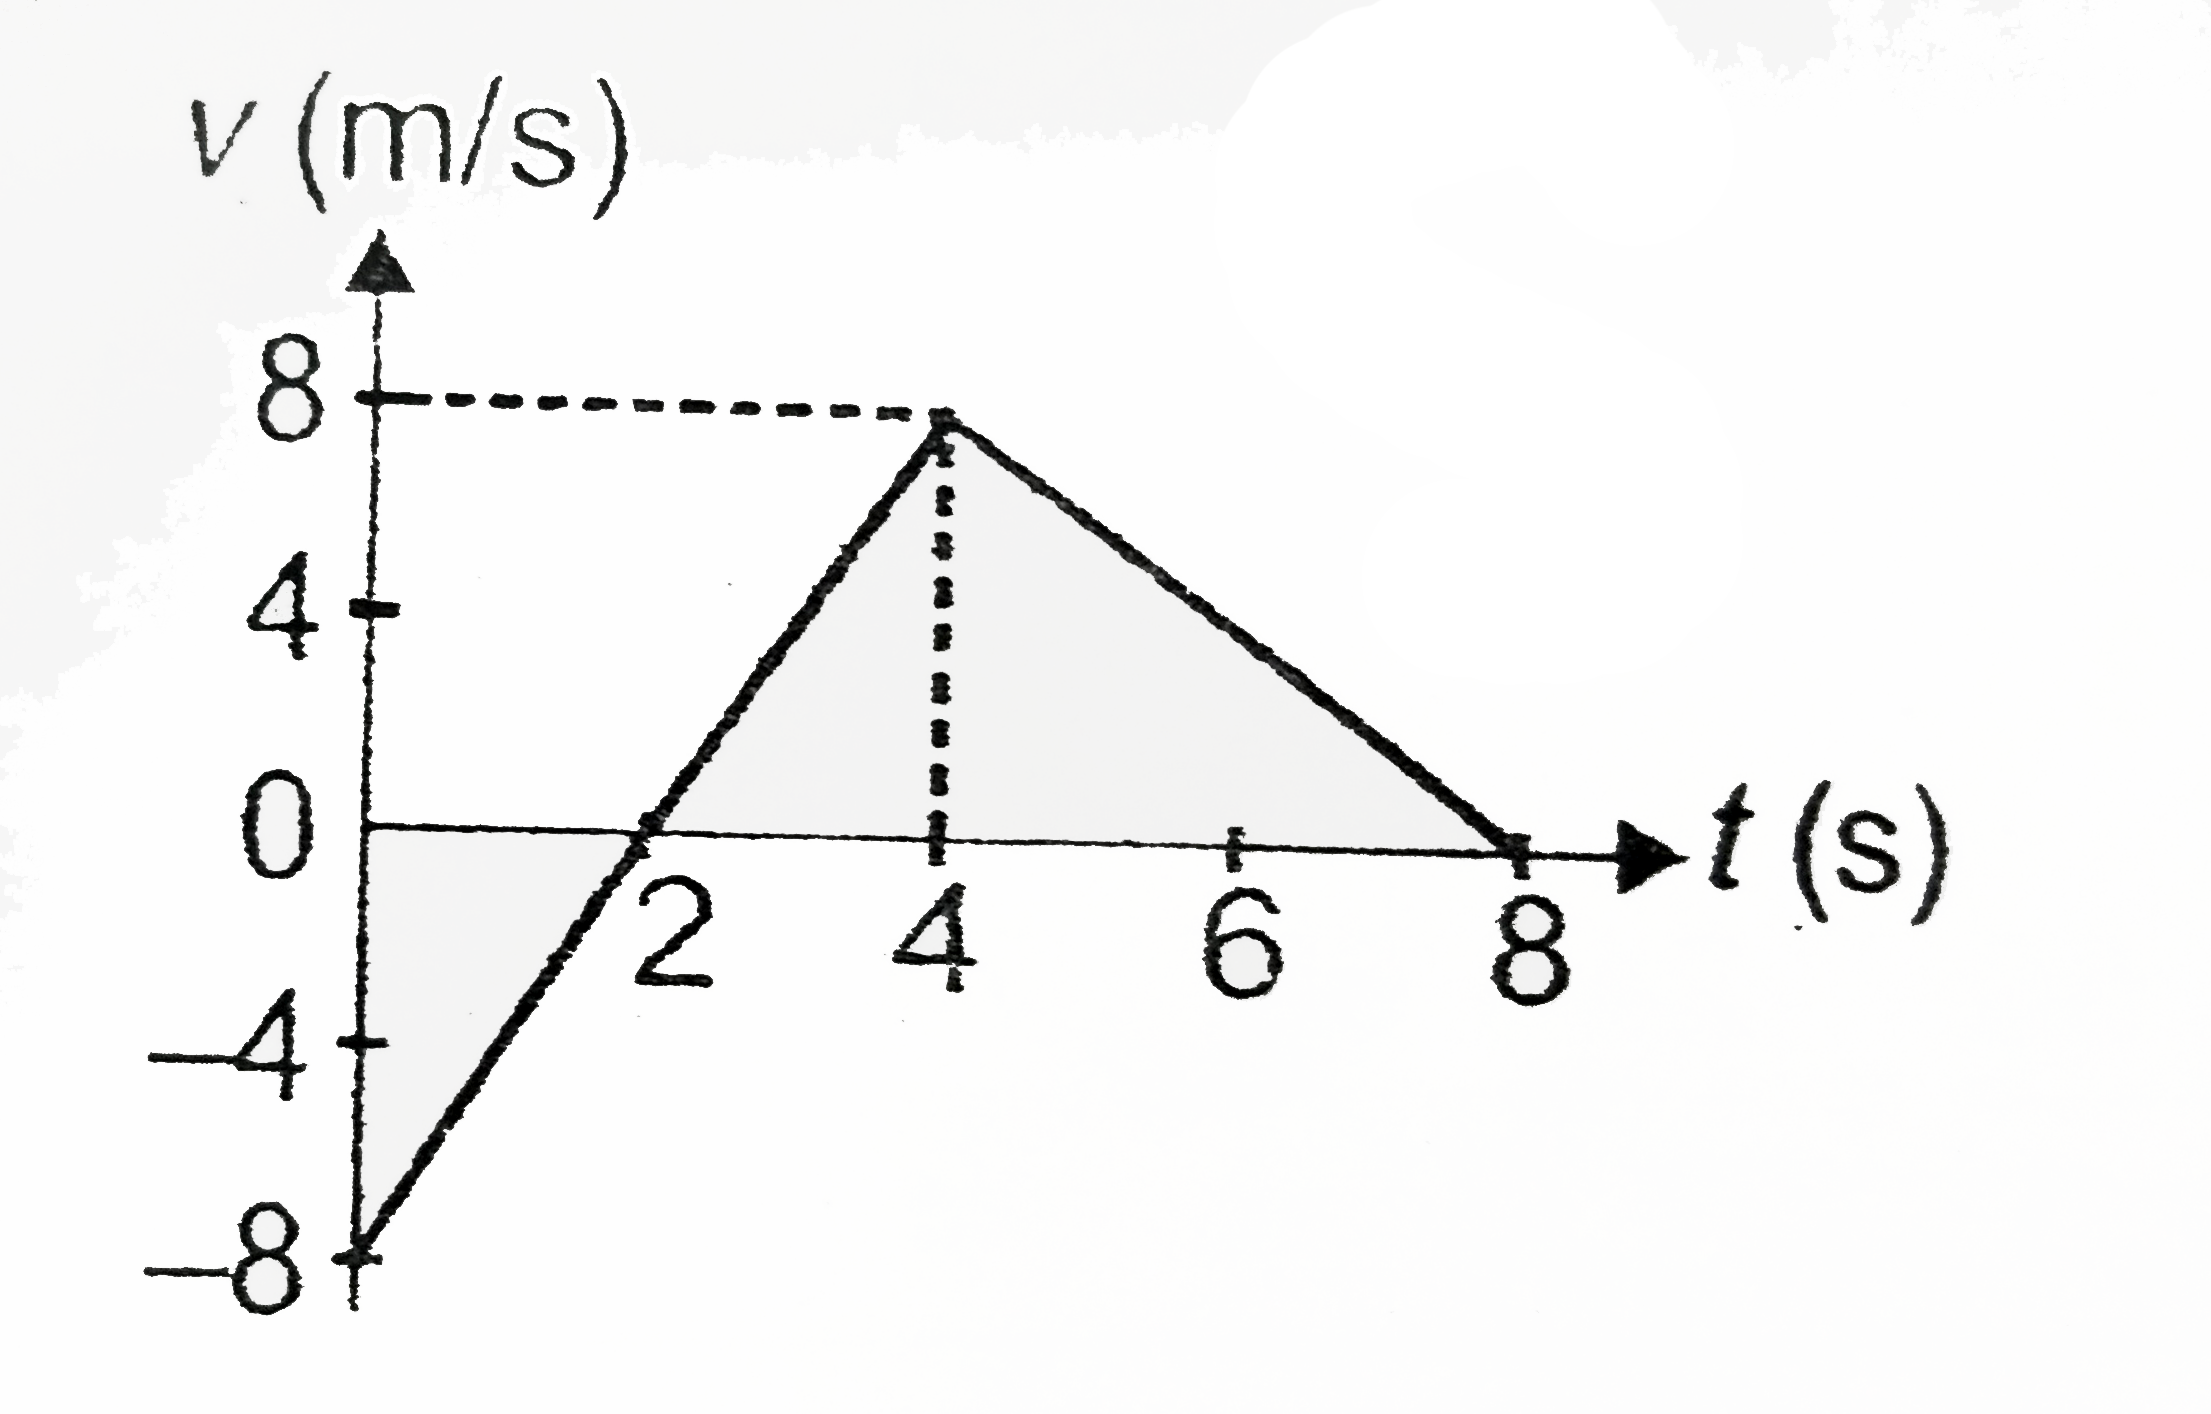
(a) Average velocity in the interval 0 to 8 s.
(b) Average speed in the interval 0 to 8 s.
(c) Average acceleration in the interval 0 to 4 s.
(d) Instantaneous acceleration at t = 2.5 s.View SolutionThe velocity-time graph of an object is given below. Calculate the average acceleration of the object in the time interval of 4 s to 6 s.
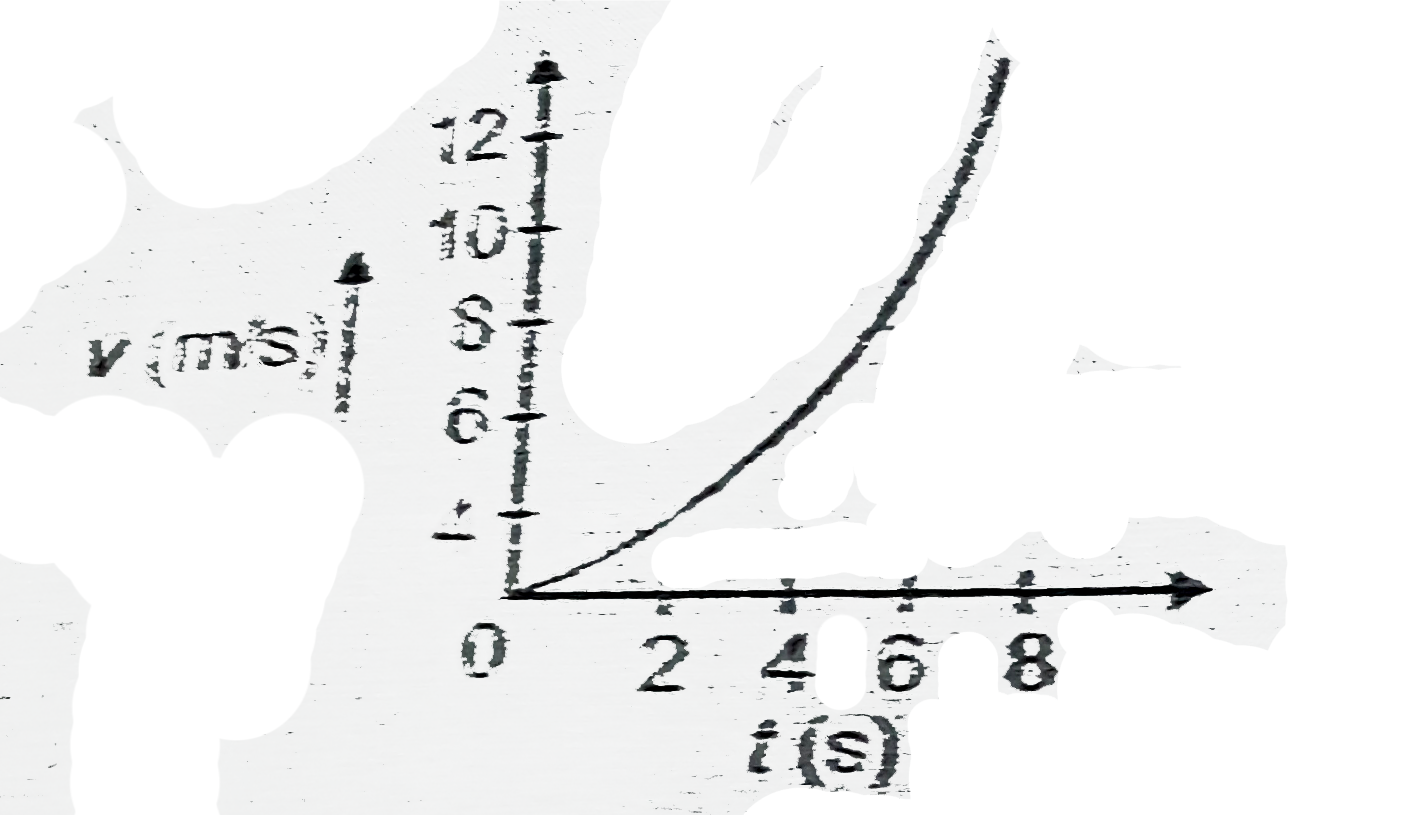 View Solution
When an object travels equal distances in equal intervals of time, it moves with ______ speed.
View SolutionMenstrual cycle is repeated at an average interval of:
View Solution
