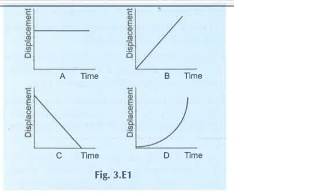
figure 3.E1 shows the displacement -time graphs for the four particles, A, B,C and D. An unbalanced force is acting on the particle
A
A
B
B
C
C
D
D
Text Solution
The correct Answer is:D
|
Topper's Solved these Questions
Similar Questions
Knowledge Check
Figure show the displacement - time graph of a particle moving on the x-axis
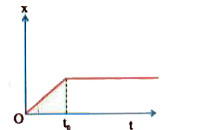 Athe particle is continuously going in positive X directionBthe particle is at restCthe velocity increases up to a time t0 and then becomes constant.Dthe particle moves at constant velocity up to a time t0 and then stops.
Figure shows the displacement of a particle going along the X-axis as a function of time. The force acting on the particle is zero in the region
 AABBBCCCDDDE
Figure shows the displacement of a particle going along the X-axis as a function of time. The force acting on the particle is zero in the region
 AABBBCCCDDDE
Figure shows the displacement-time graph of a particle moving on the X-axis
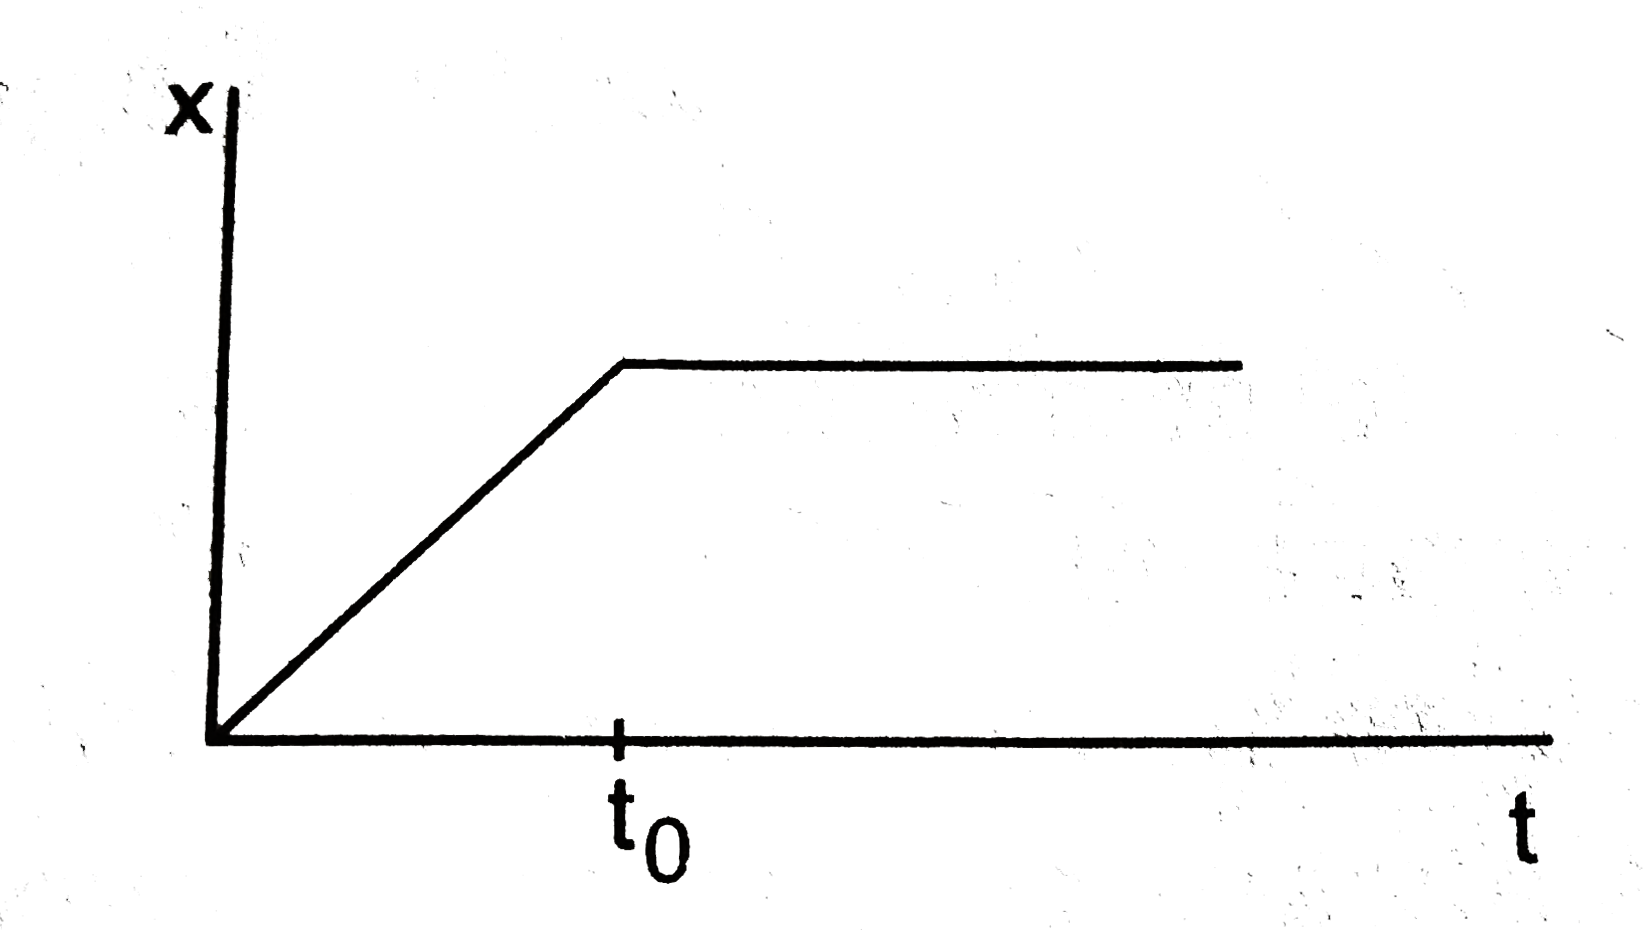
View SolutionFigure shows the displacement (x)-time (f) graph of a particle moving on the X-axis.
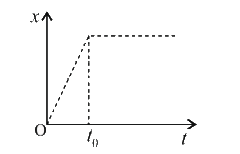
View Solution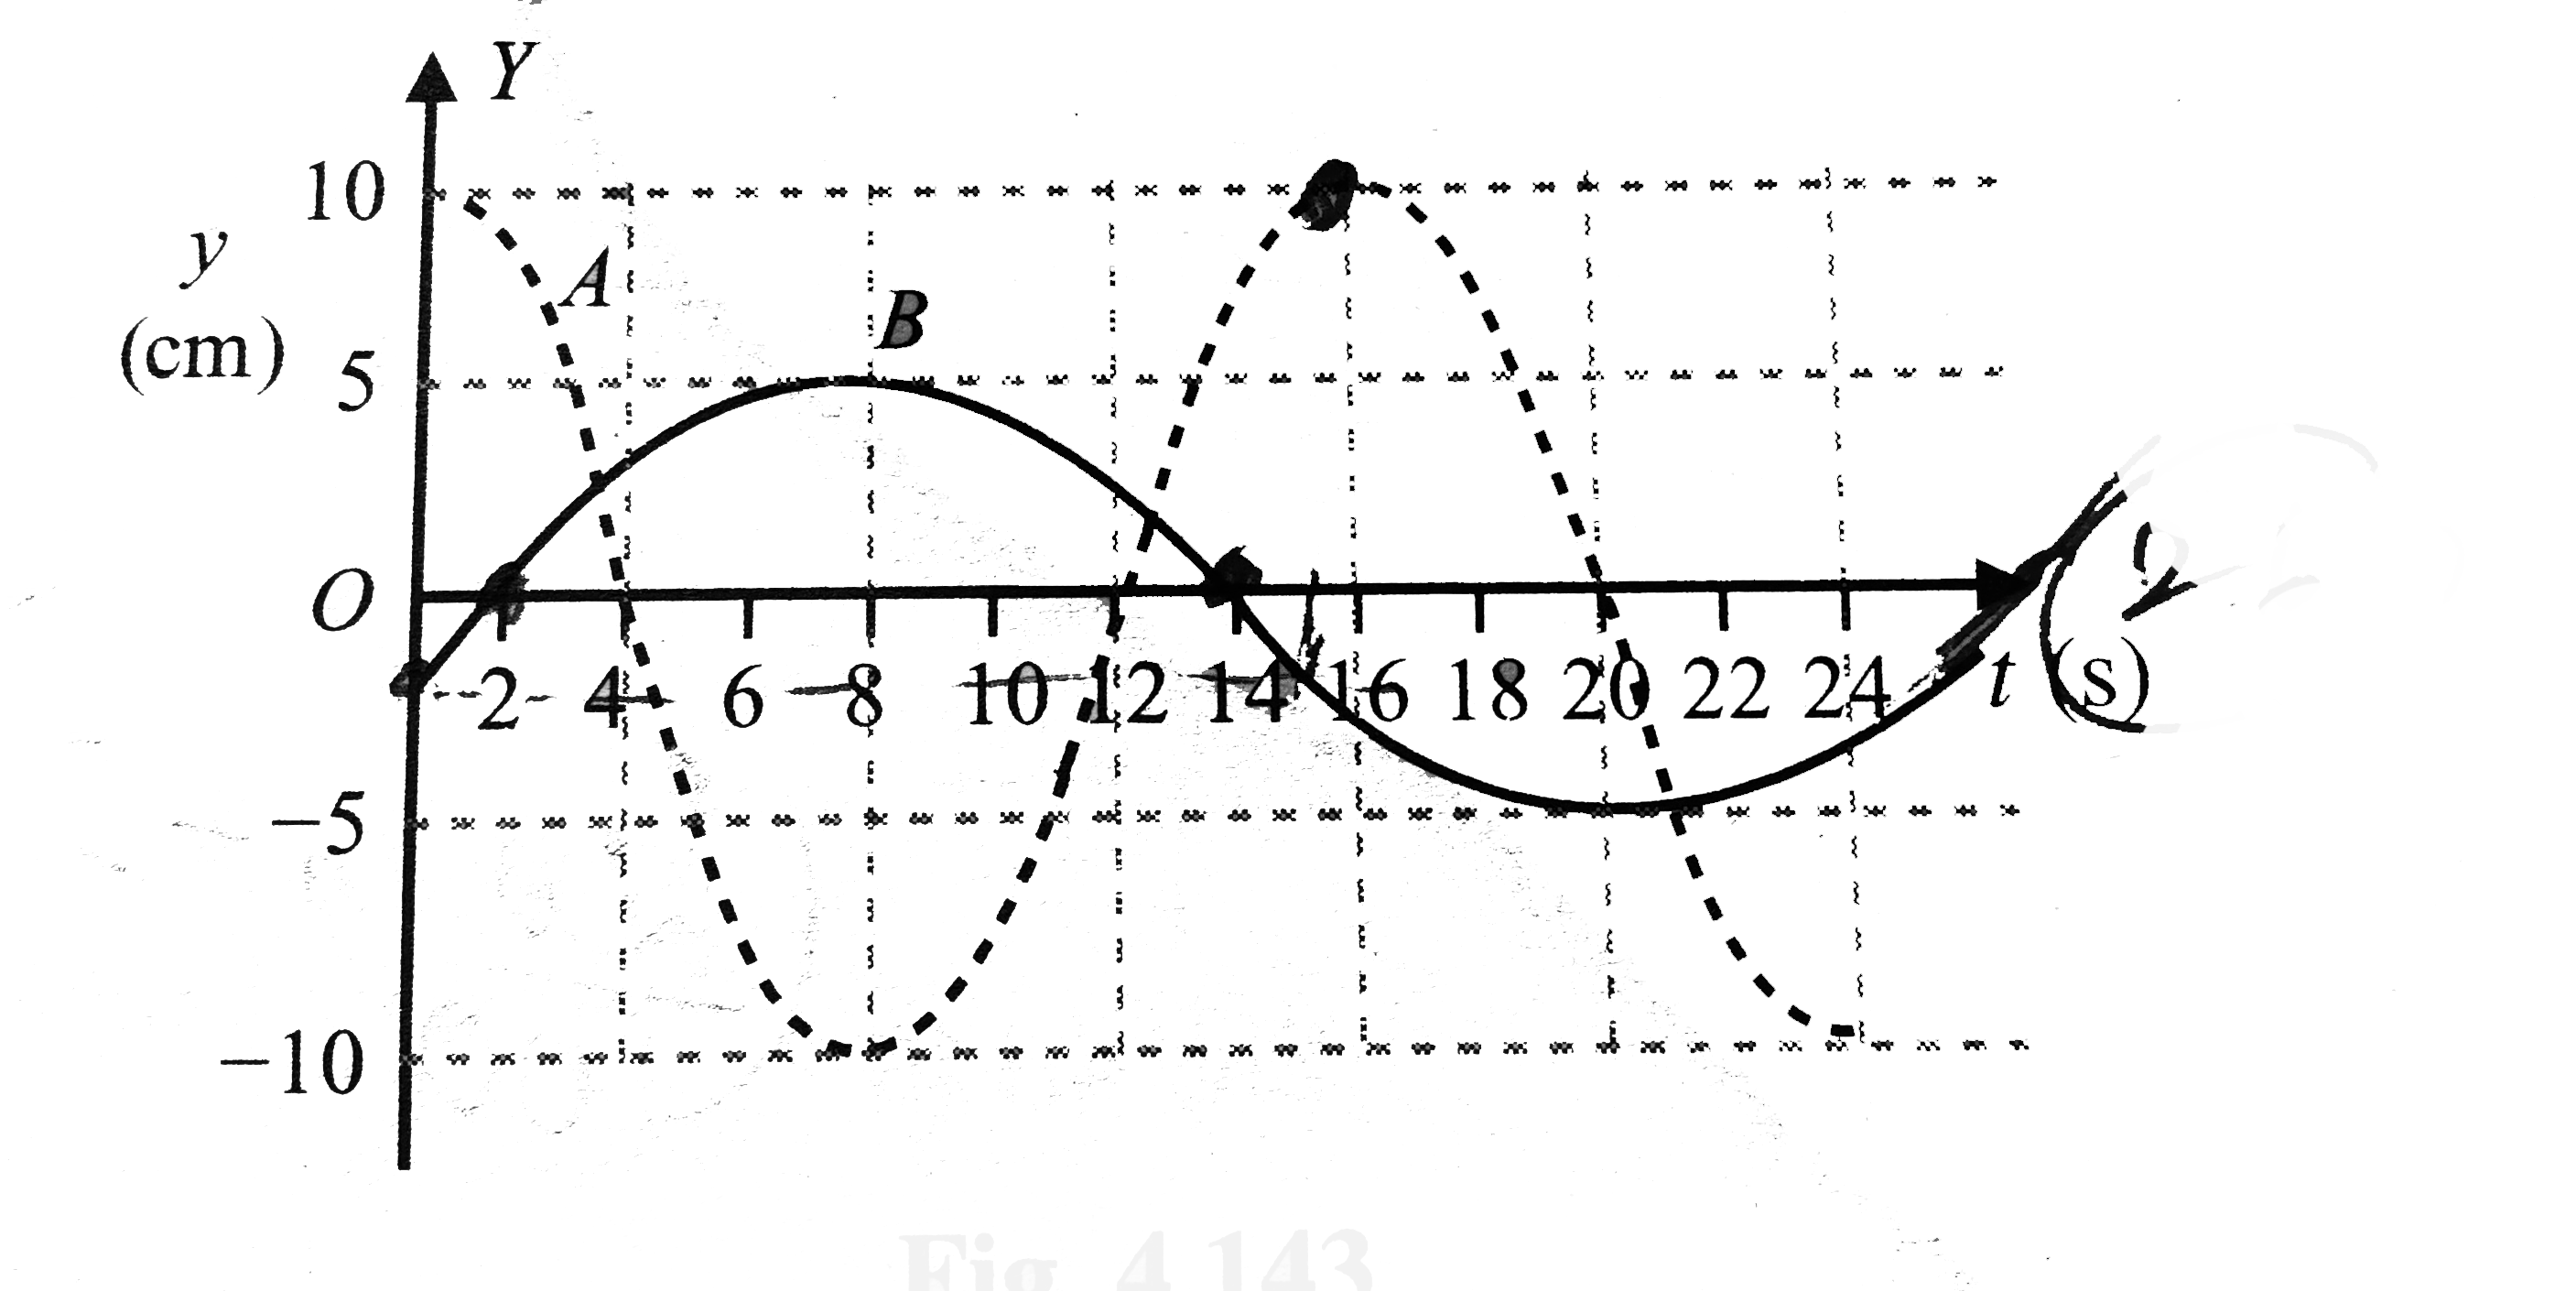
The following figure shows the displacement versus time graph for two particles A and B executing simple harmonic motions. The ratio of their maximum velocities is
View Solution
The following figure shows the displacement versus time graph for two particles A and B executing simple harmonic motions. The ratio of their maximum velocities is
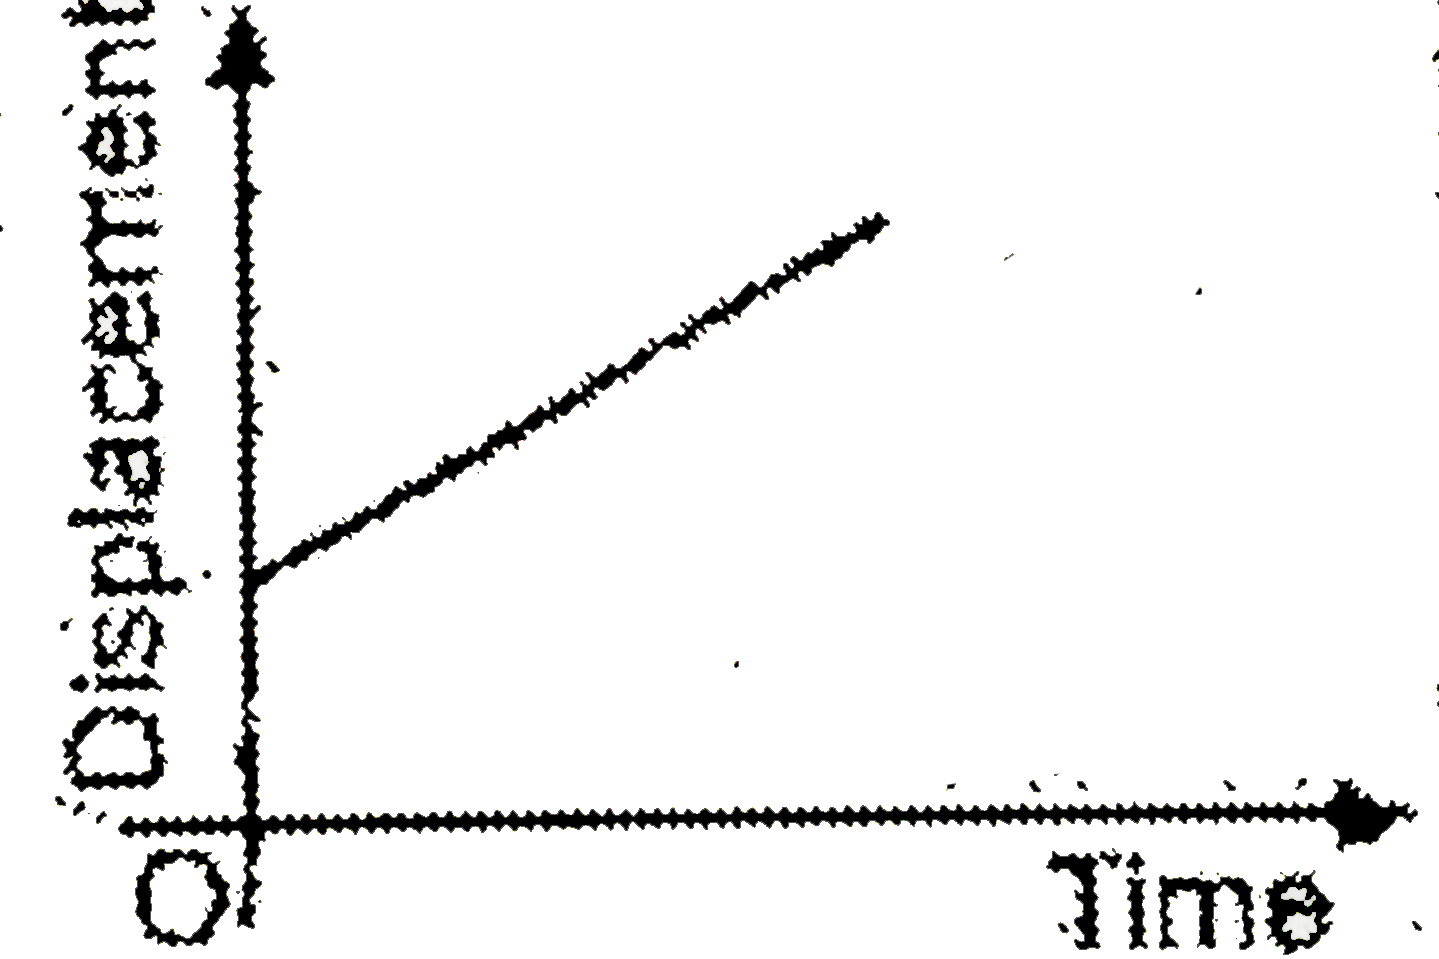
View SolutionThe displacement time curve of a particle is shown in the figure. The external force acting on the particle is :
View Solution
