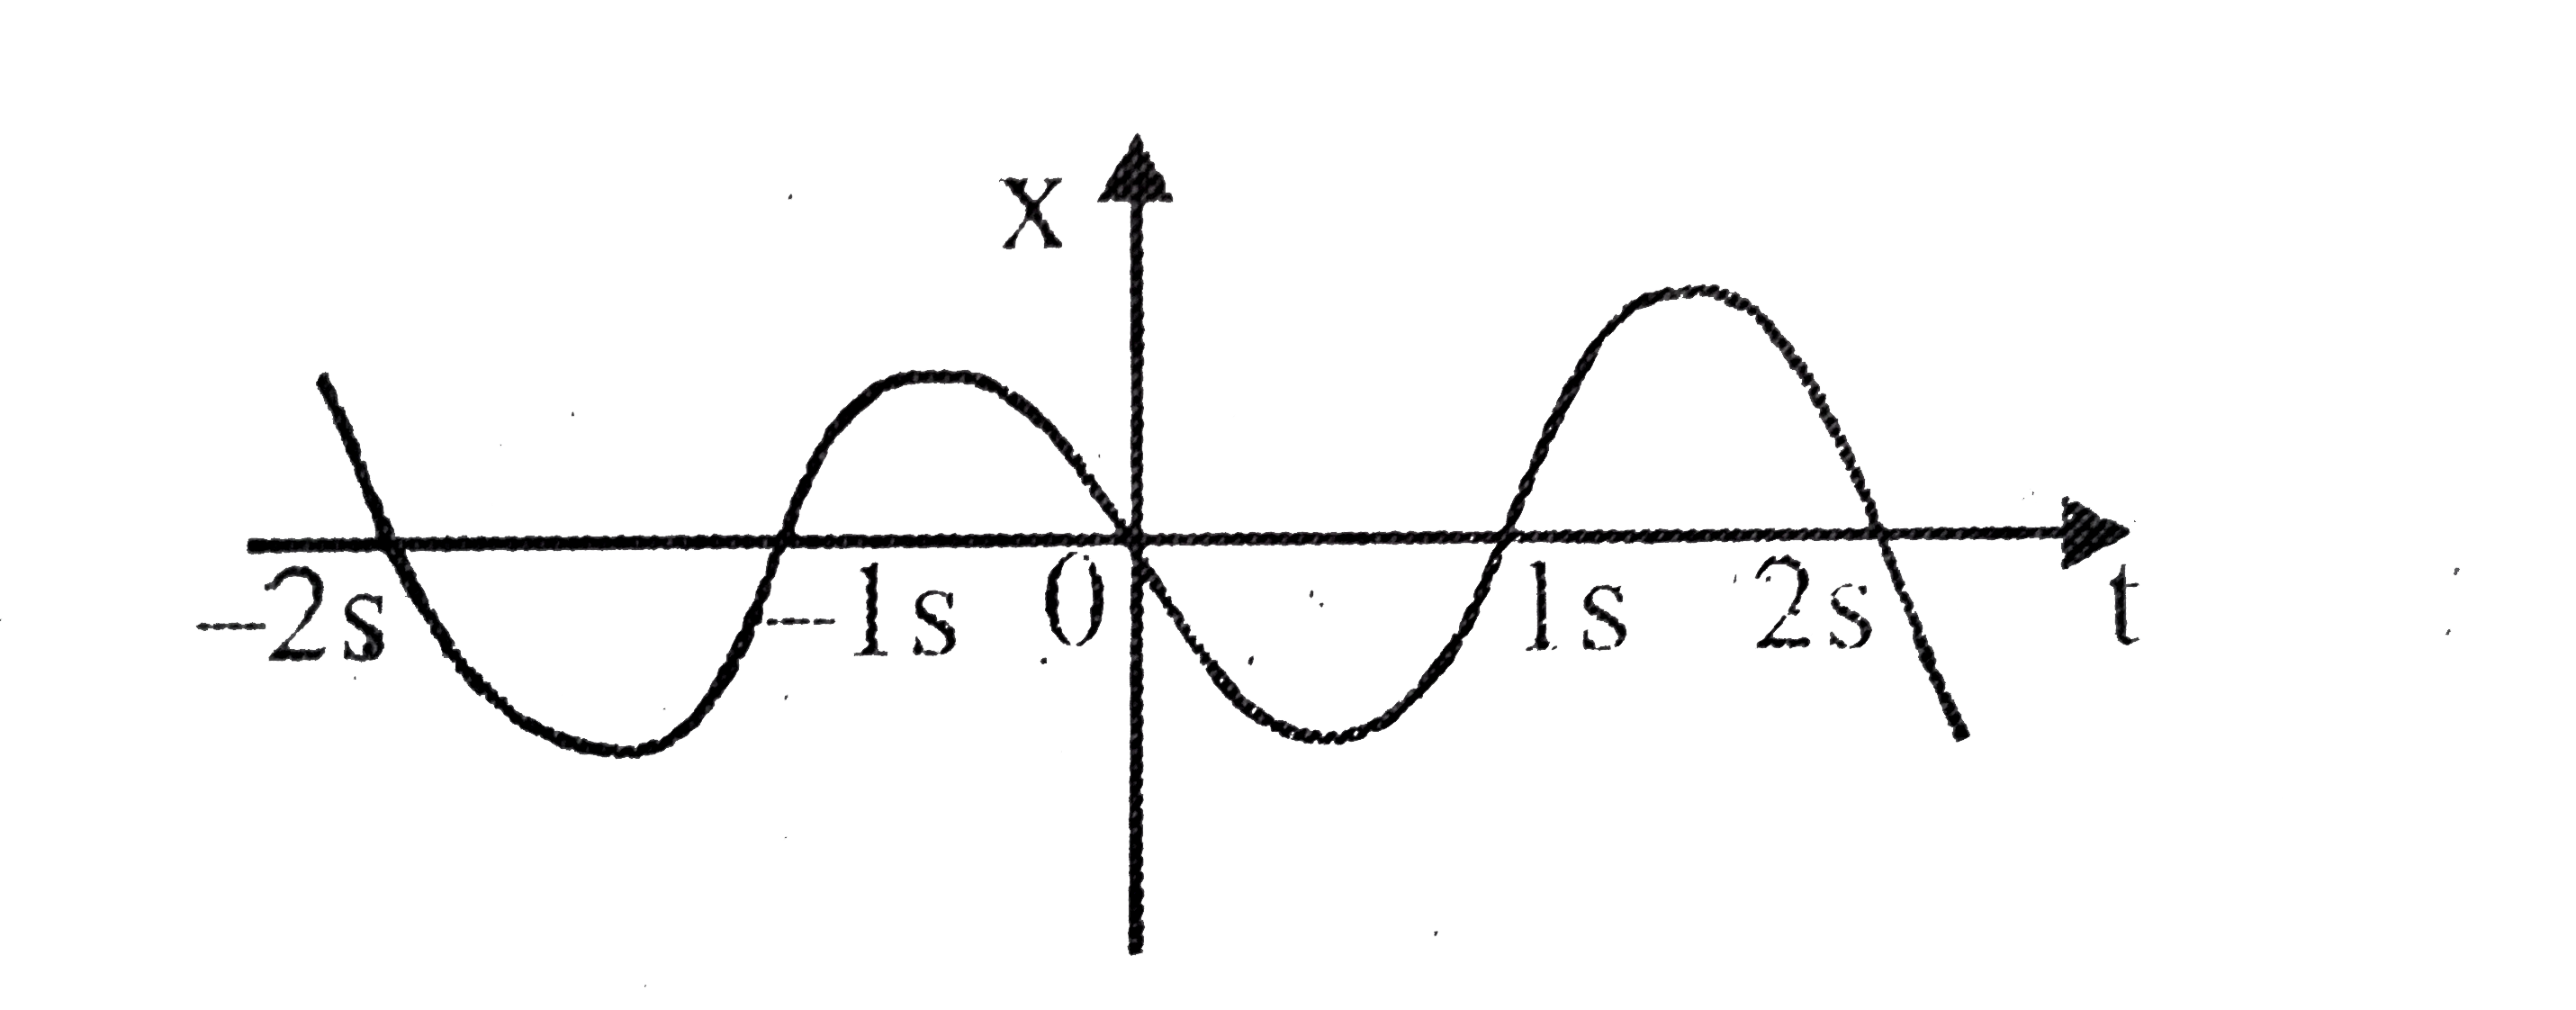
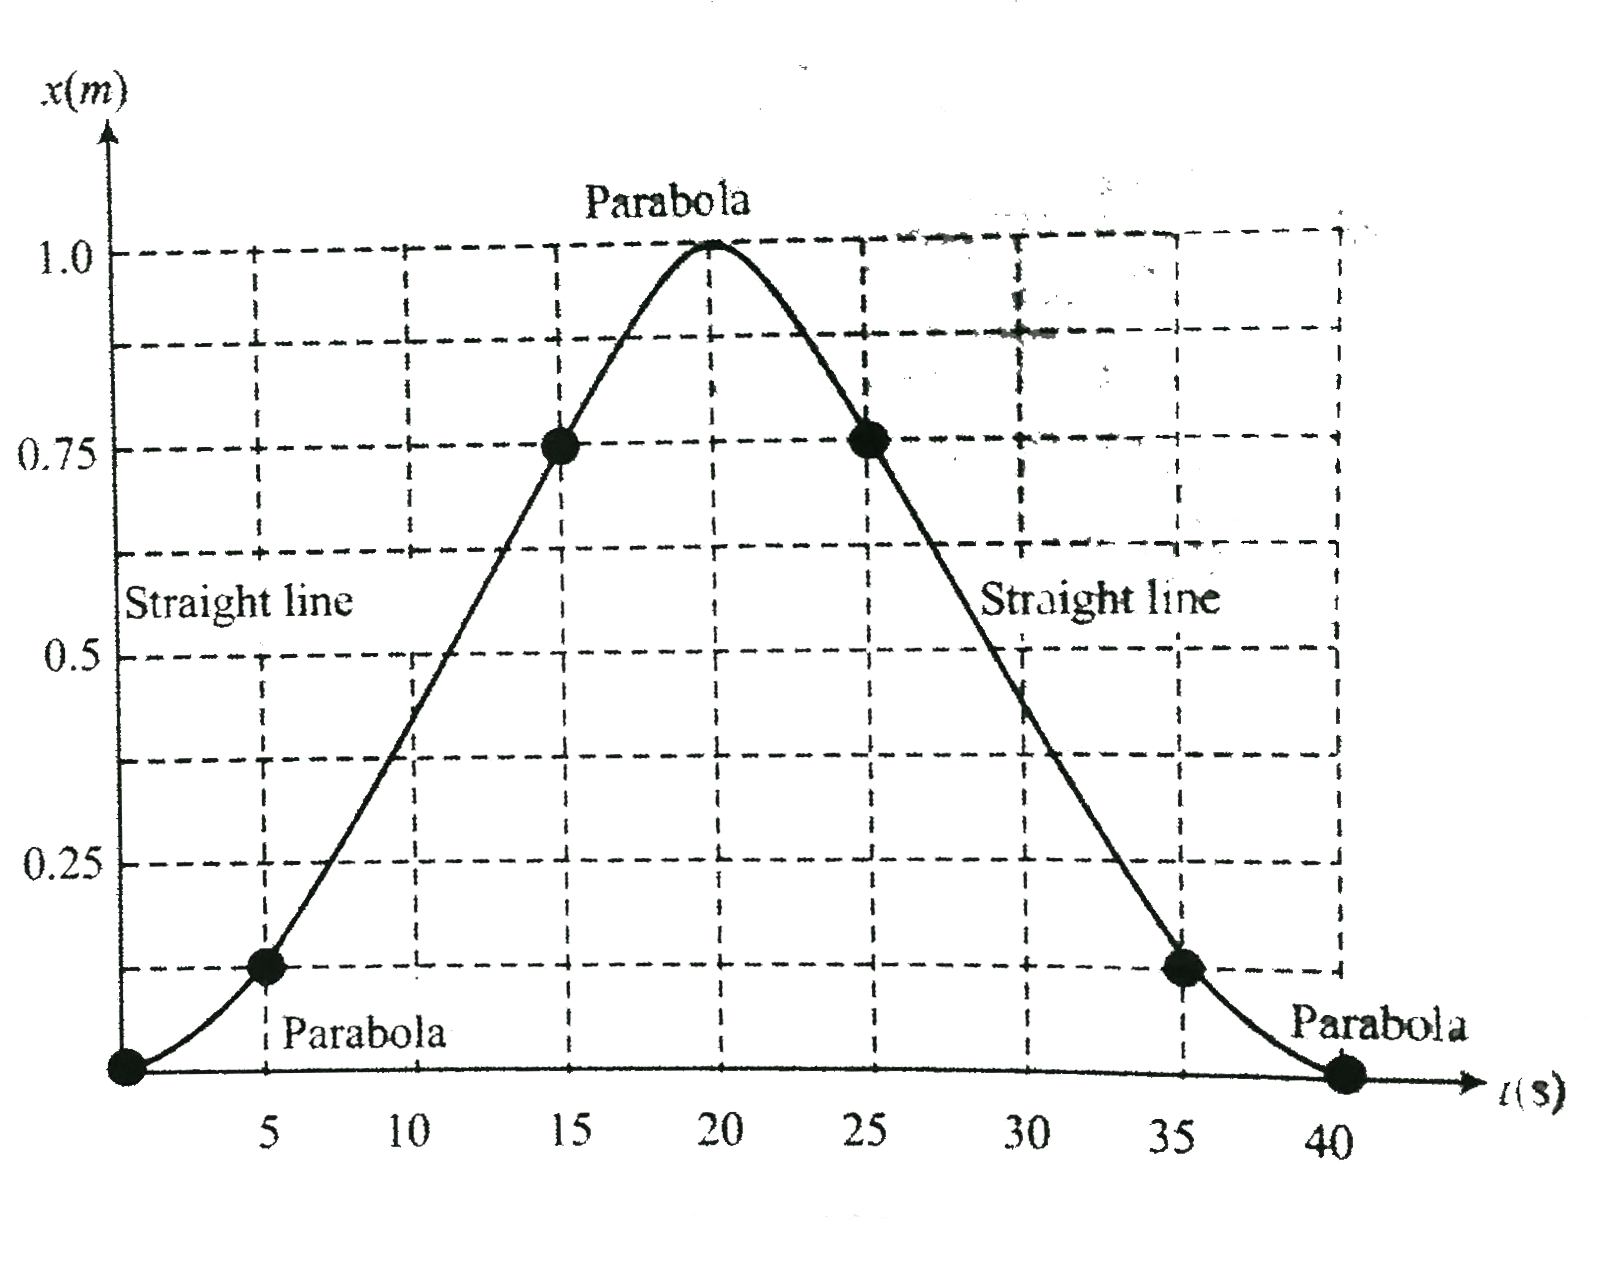
Figure is a graph of the coordinate of a spider crawling along the x-axis. (a) Fraph tis velocity and acceleration as functionsof time. (b) In a motion diagram, show the position, velocity, and acceleration of the spider at the five times: t=2.5s, t=10 s, t=20 s, t=30 s,
 .
.
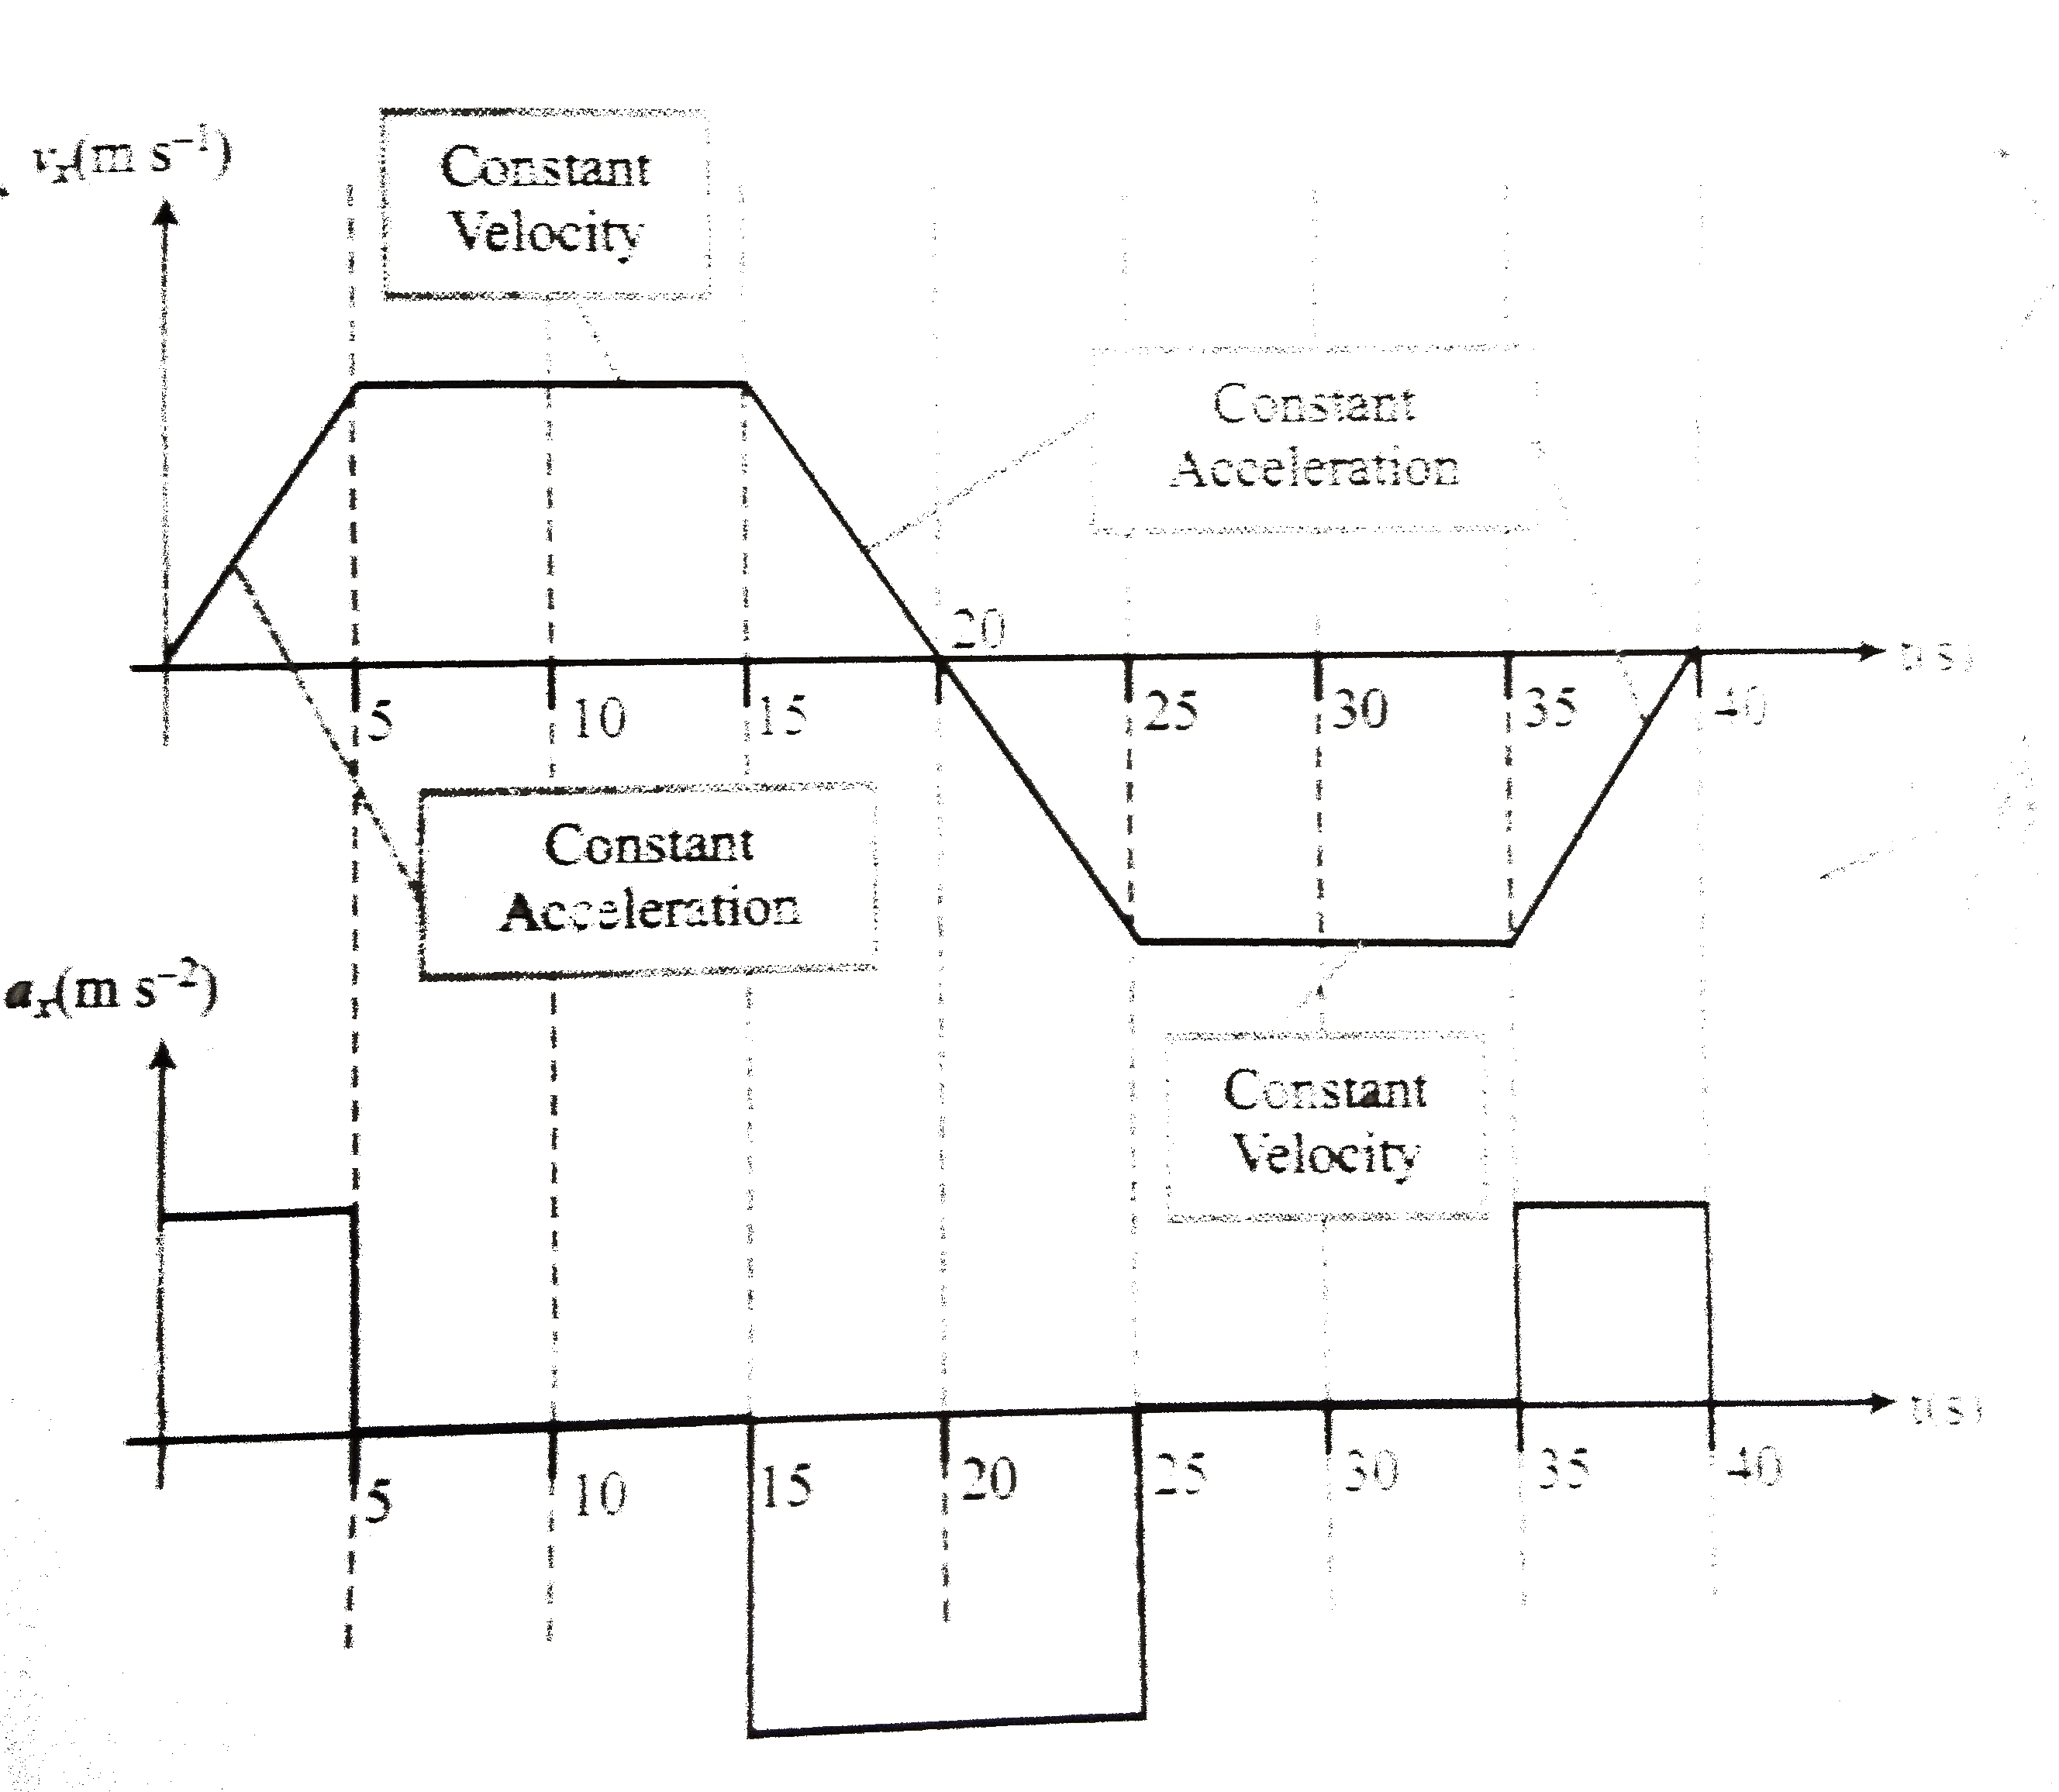
a. vx is the slope of the x versus t curve and ax is the slope of the vx versus t curve.
t=O to t=5s: x versus t is a parabola, so ax versus t is The curvature s positive so ax is positive vx versus t is a straight line with positive slope. vx=0.
t=5s to t=25s: x versus t is a straight line, so vx is constant and 0. ax=0. The slope of x versus t is positive, so vx is positive.
t=15s to t=25s: x versus t is a parabola with negative curvature, so ax is constant and negative, vx versus t is a straight line with negative slope. The velocity is zero at 20s, positive to 15s to 20s, and negative to 20s to 25s. t=25s to t=35s: x versus t is a straight line, so vx is constant and ax=0. The slope of x versus t is negative, so vx is negative.
t=35s to t=40s: x versus t is a parabola with positive curvature, so ax is constant and positive.
vx versus t is a straight line with positive slope. The velpcoty reaches zero at t=40s
The graphs of vx(t) are sketched in
 .
.
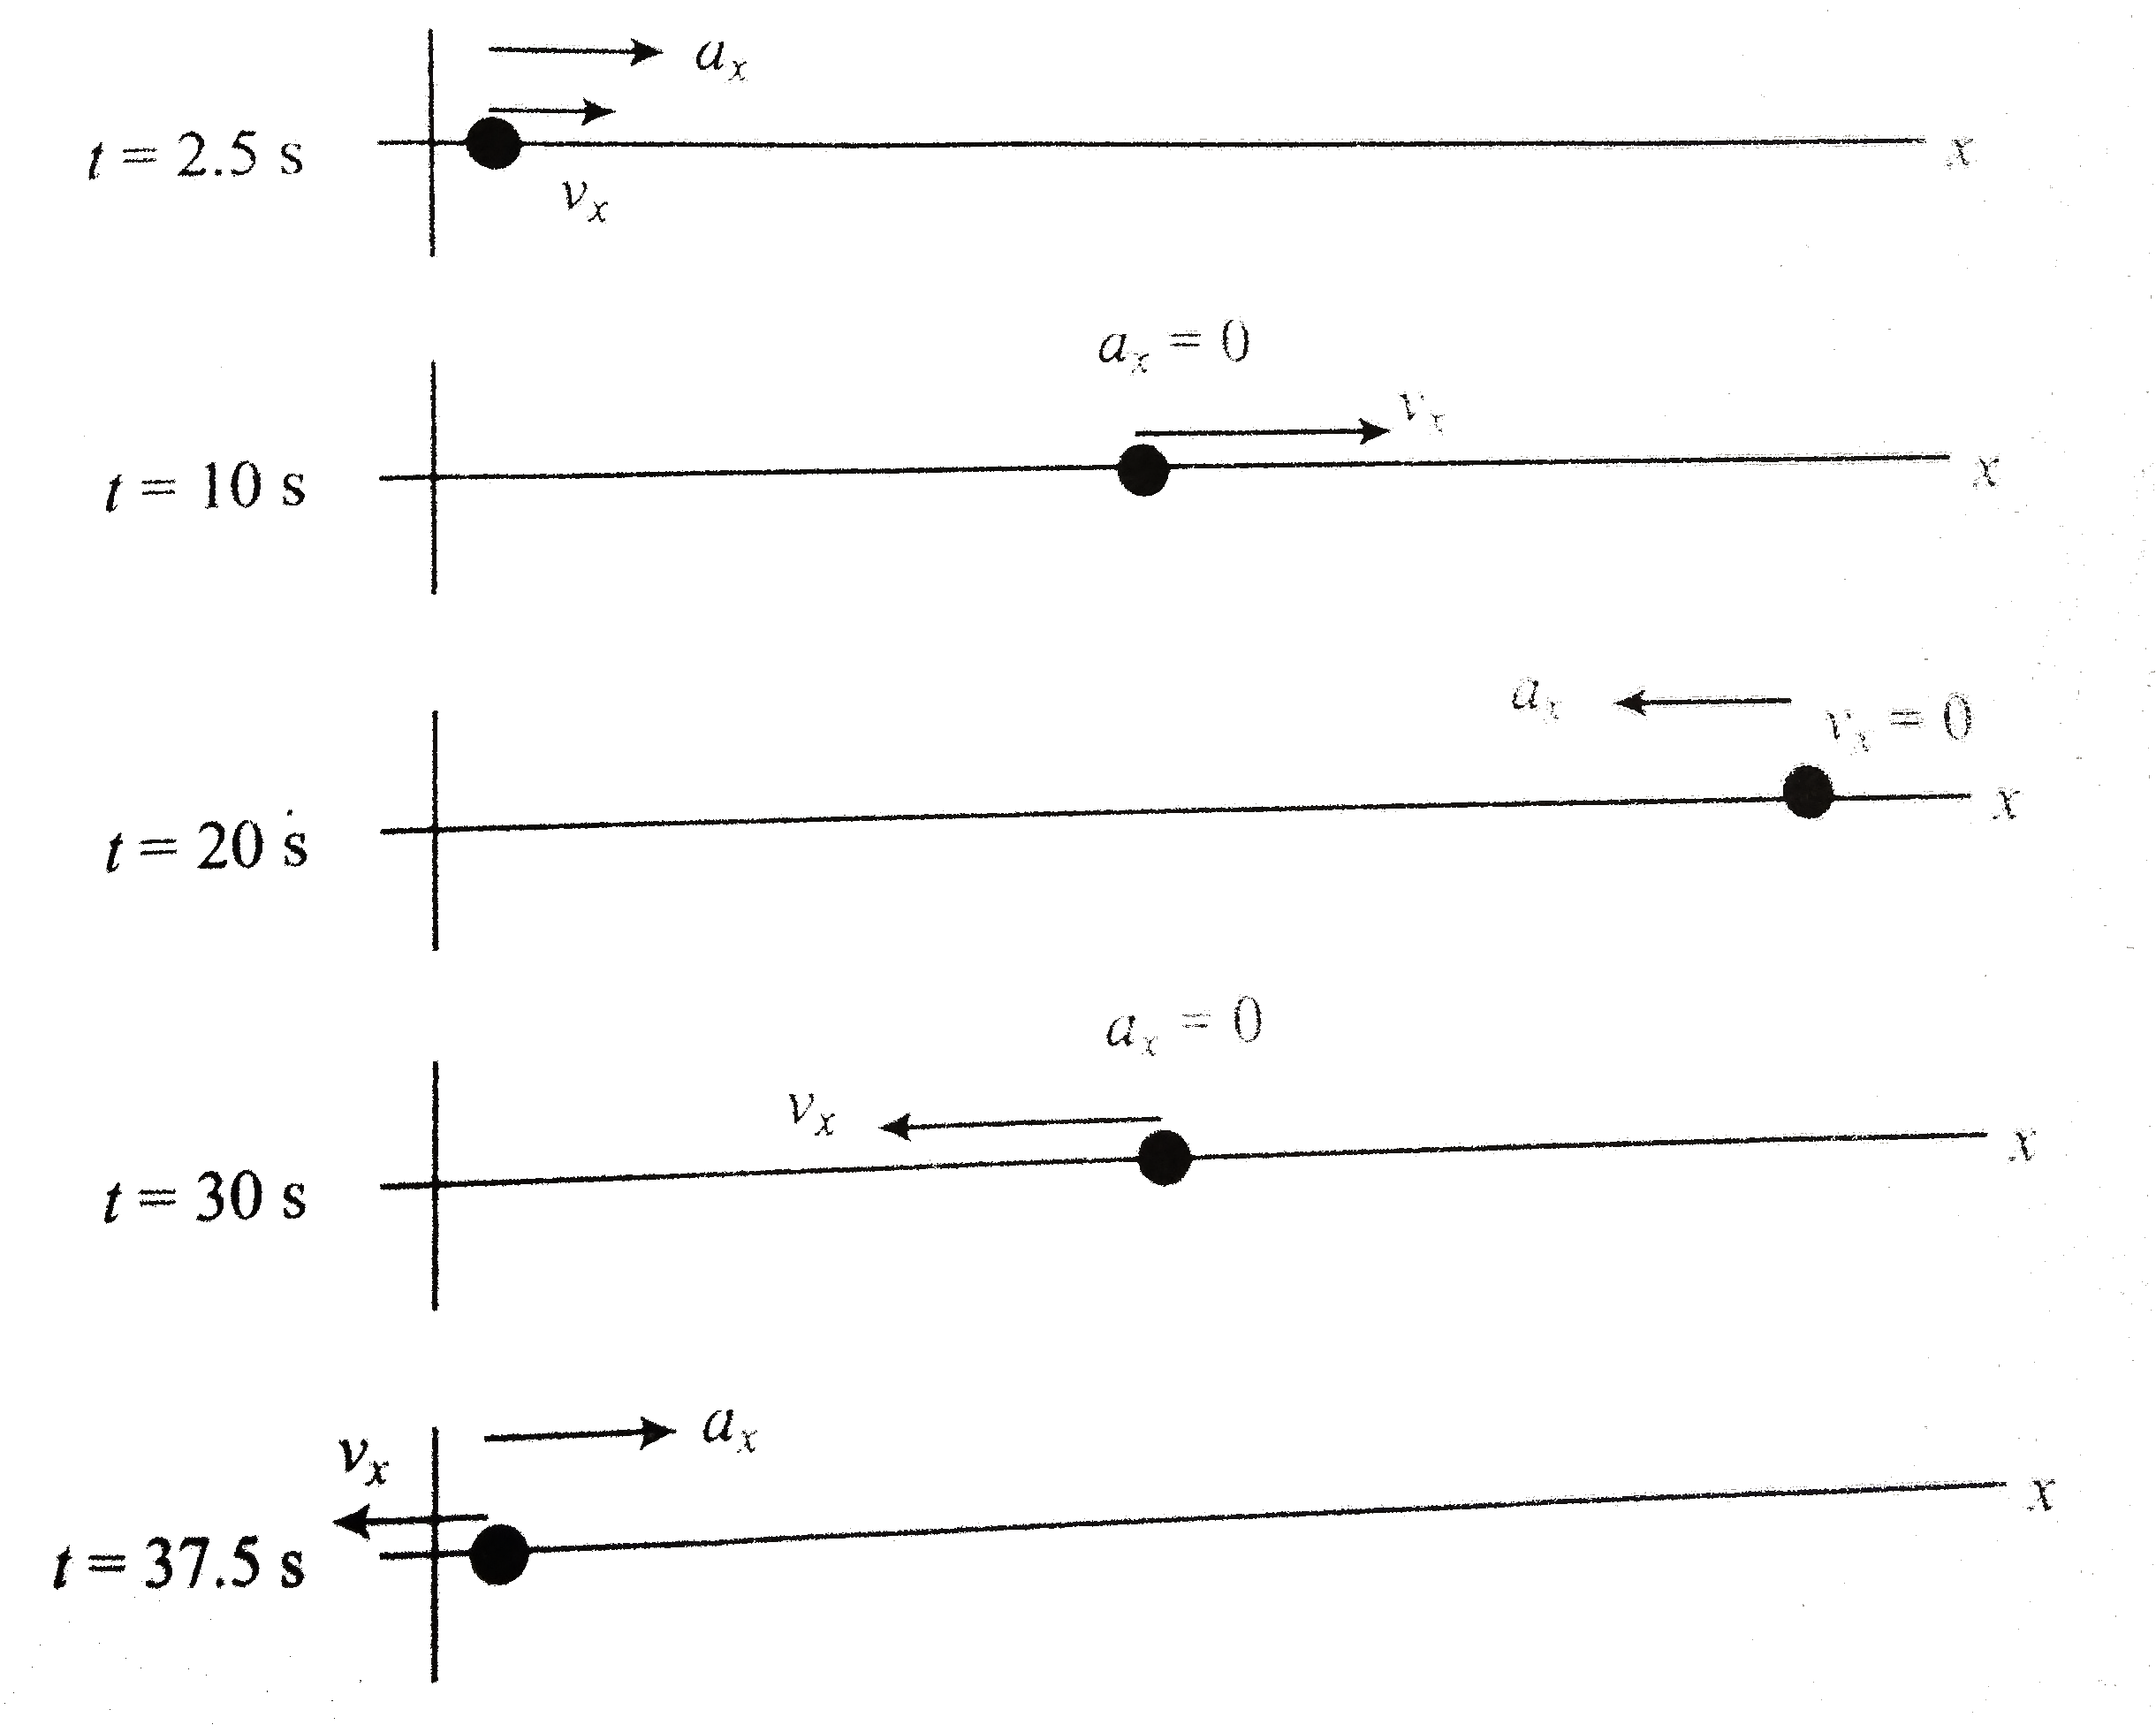
b. The motions diagrams are skerched in
 .
.
The spider speeds up for the first 5s, since vx and ax are both positive. Starting at t=5s, the spider starts to slow down stops momentarily at t=20s, and then moves in the opposite direction. At t=35s, the spider sarts in the opppsits direction .At t=35s, the spider starts to slow down again and stops at t=40.
Topper's Solved these Questions
- KINEMATICS-1BOOK - CENGAGE PHYSICSCHAPTER - KINEMATICS-1EXERCISE - Solved Examples
9 Videos
- KINEMATICS-1BOOK - CENGAGE PHYSICSCHAPTER - KINEMATICS-1EXERCISE - Exercise 4.1
17 Videos
- GRAVITATIONBOOK - CENGAGE PHYSICSCHAPTER - GRAVITATIONEXERCISE - INTEGER_TYPE
1 Videos
- KINEMATICS-2BOOK - CENGAGE PHYSICSCHAPTER - KINEMATICS-2EXERCISE - Exercise Integer
9 Videos
Similar Questions
Knowledge Check
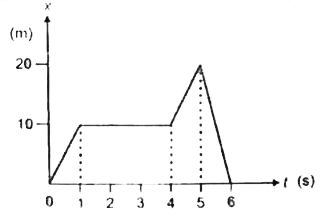
Figure shows the graph of x - coordinate of a particle moving along x - axis as a function of time. Average velocity during t = 0 to 6 s and instantaneous velocity at t = 3 s respectively, will be
 A10m/s,0B60m/s,0C0,0D0,10m/s
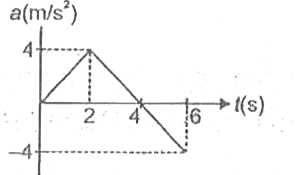
For the acceleration - time (a - t) graph shown in figure, the change in velocity of particle from t = 0 to t = 6 s is
 A10 m/sB4 m/sC12 m/sD8 m/s
The motion of a particle along a straight line is described by the function x=(2t−3)2, where x is in metres and t is in seconds. Find
(a) the position, velocity and acceleration at t=2s.
(b) the velocity of the particle at the origin .A1 , 0 , 4B1 , 4 , 0C10 , 14 , −34D10 , −1 , 0
If the motion of aparticle is governed by the equation, s=2t3−3t2+2t+2, find the poswition, velocity and acceleration of the particle at time t=2s.
View SolutionA particle starts from the origin at time t = 0 and moves along the positive x-axis. The graph of velocity with respect to time is shown in figure. What is the position of the particle at time t = 5s ?

View SolutionThe displacement s of a particle at a time t is given bys=t3−4t2−5t. Find its velocity and acceleration at t = 2.
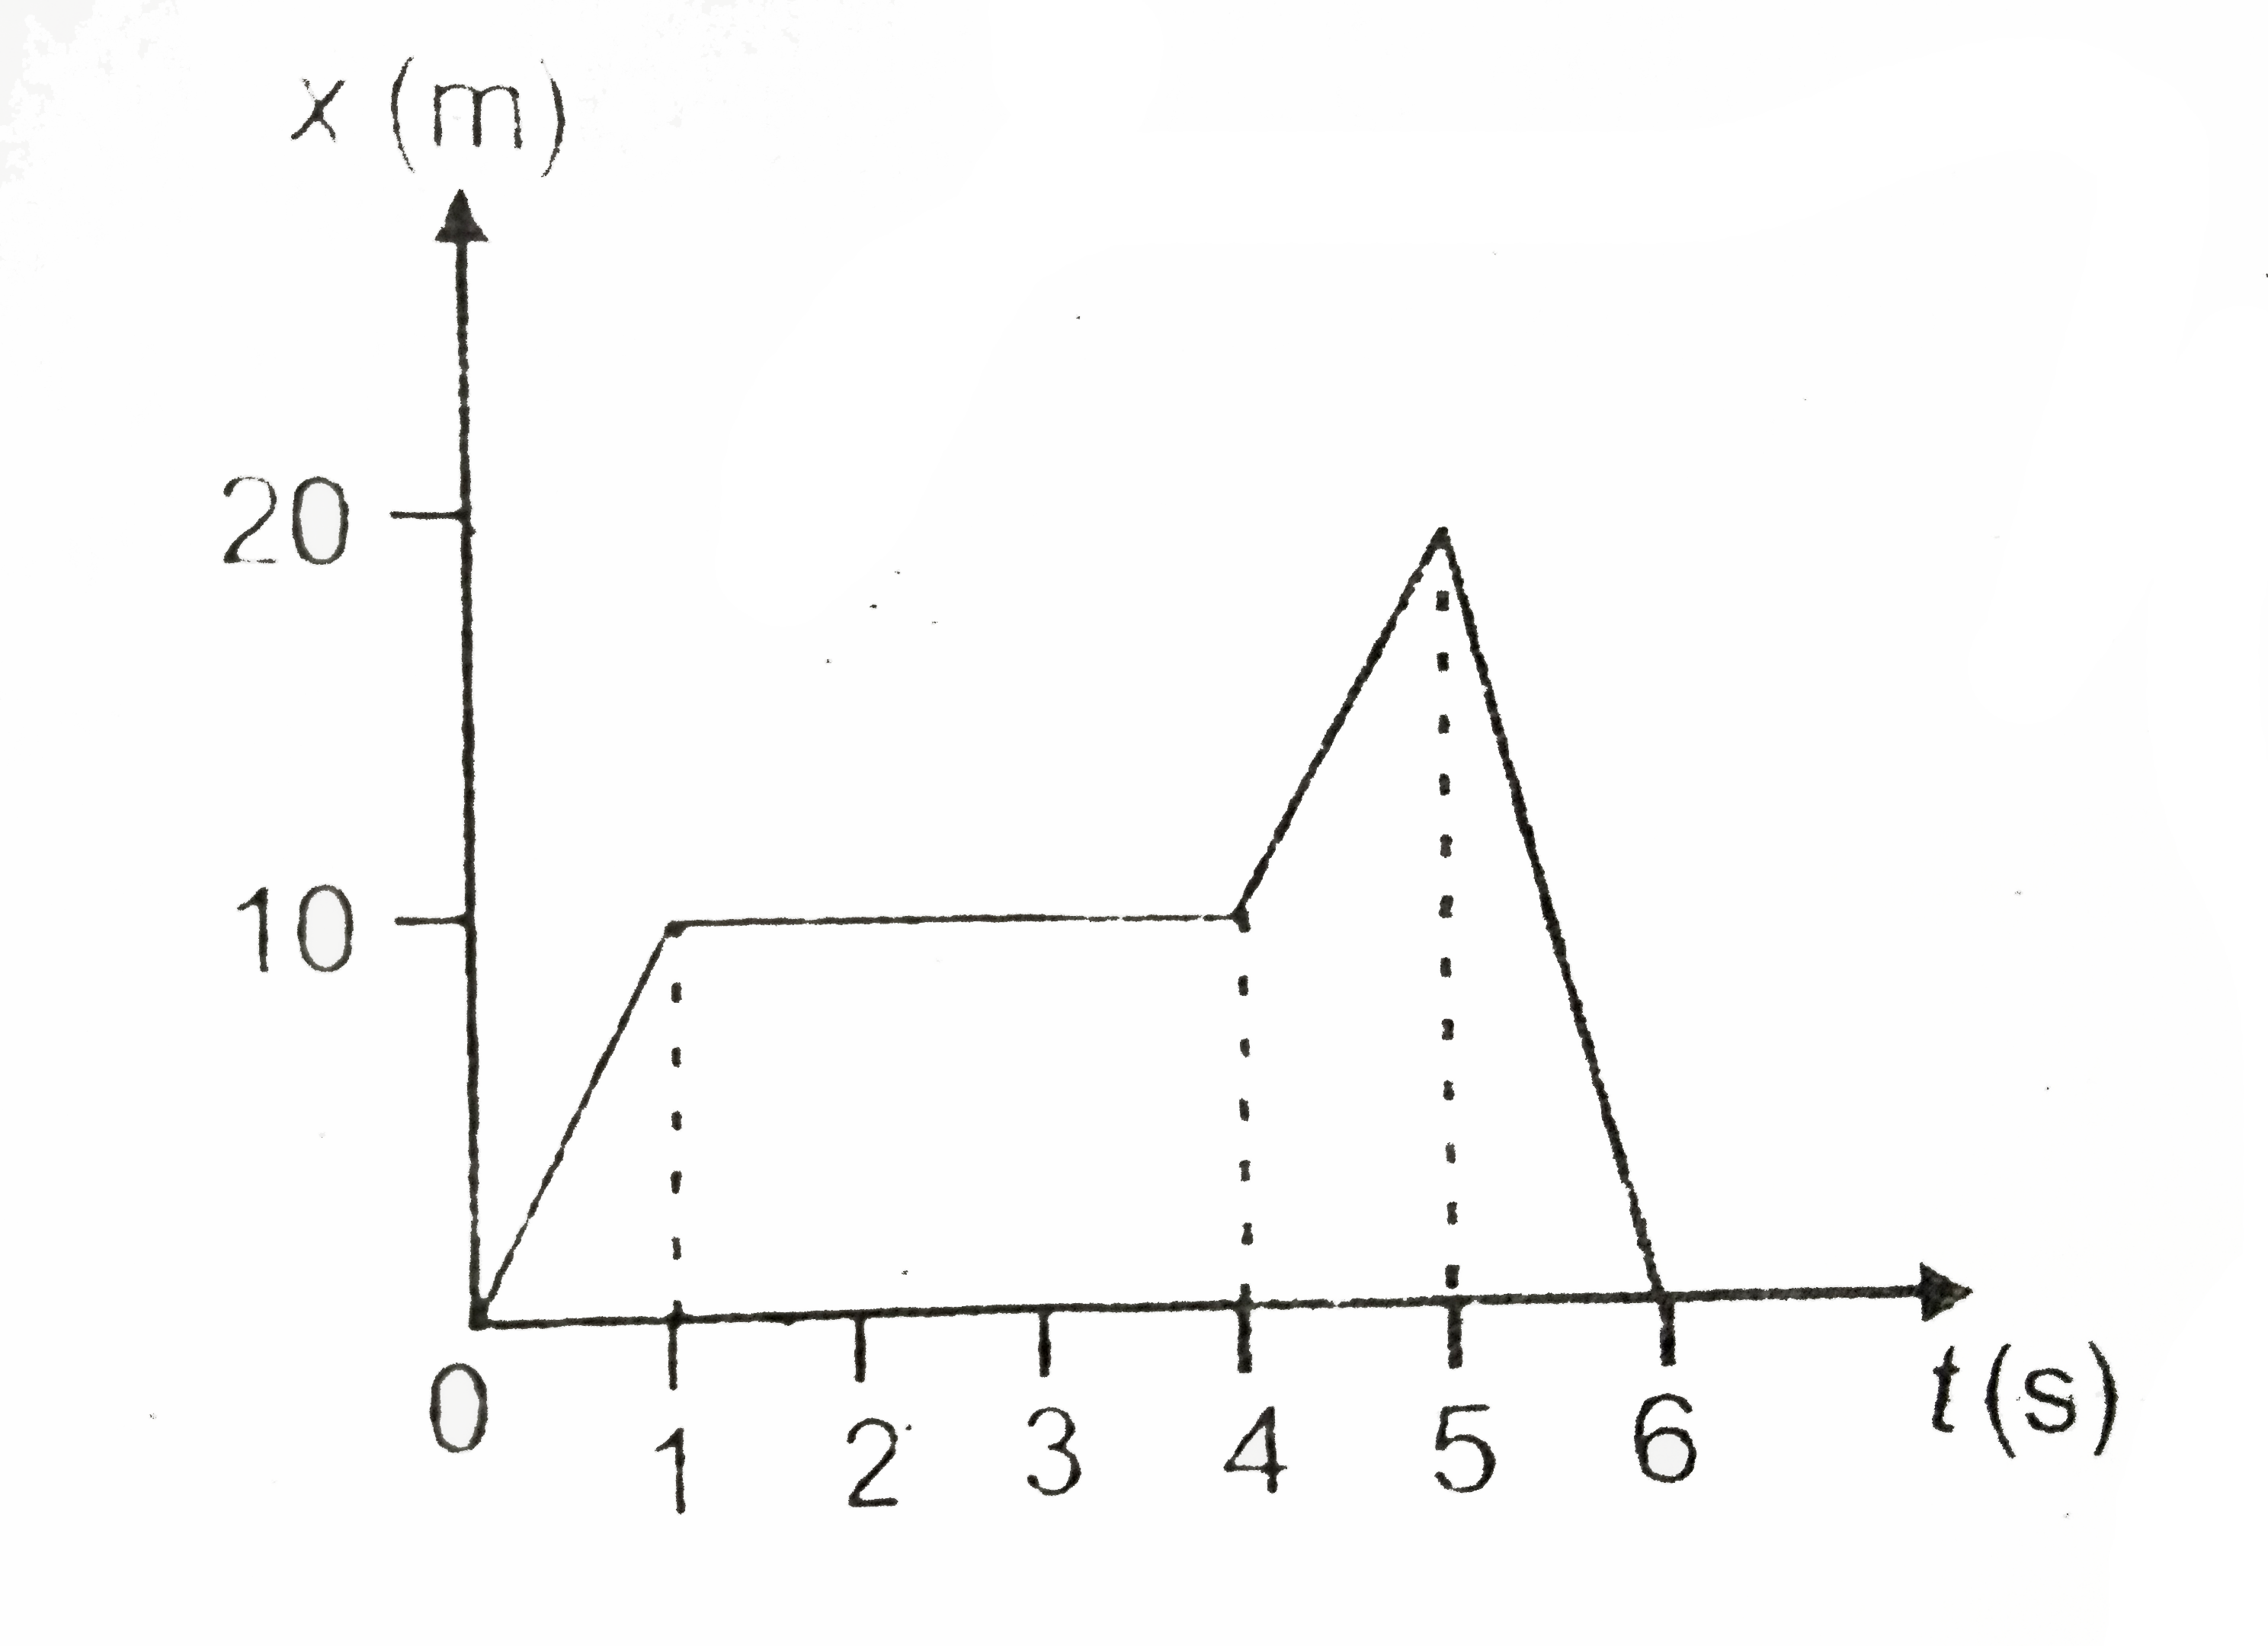
View SolutionFigure shows the graph of x-coordinate of a particle moving along x-axis as a function of time. Average velocity during t = 0 to 4 s and instantaneous velocity at t = 4.113 s respectively will be
View SolutionThe velocity-time graph of a moving particle is given below. The acceleration of the particle at t = 5 s will be
View Solution

