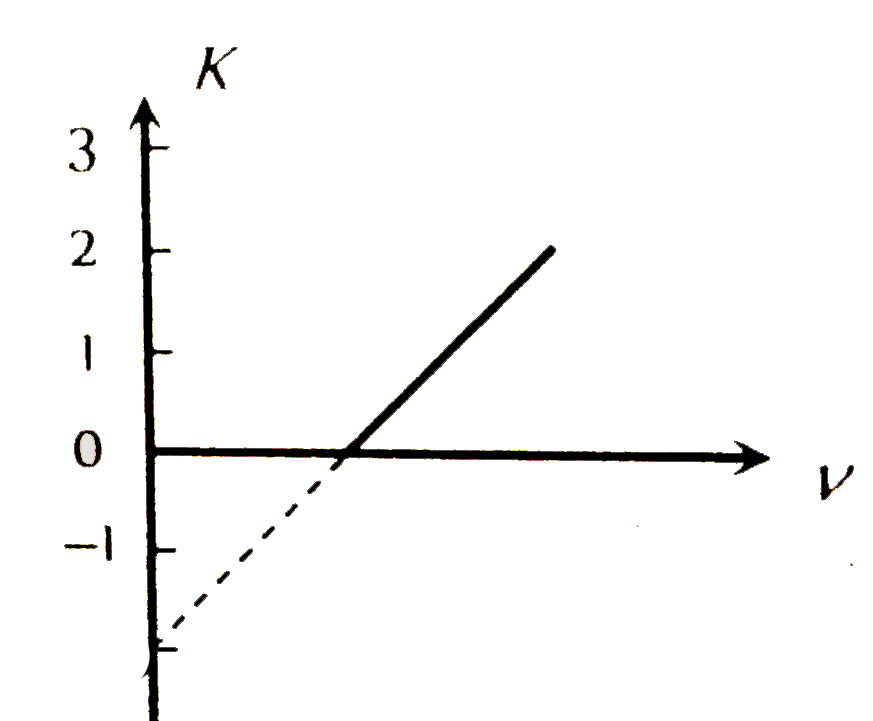
Figure represents a graph of kinetic energy (K) of photoelectrons (in eV ) and frequency (v) for a metal used as cathode in photoelectric experiment. The work function of metal is

1 eV
1.5 eV
2 eV
3 eV
The correct Answer is:C
Topper's Solved these Questions
- ELECTRON, PHOTON, PHOTOELECTRIC EFFECT AND X-RAYSBOOK - ERRORLESS CHAPTER - ELECTRON, PHOTON, PHOTOELECTRIC EFFECT AND X-RAYSEXERCISE - Assertion & Reason
3 Videos
- ELECTRON, PHOTON, PHOTOELECTRIC EFFECT AND X-RAYSBOOK - ERRORLESS CHAPTER - ELECTRON, PHOTON, PHOTOELECTRIC EFFECT AND X-RAYSEXERCISE - Self Evaluation Test
3 Videos
- ELECTRON, PHOTON, PHOTOELECTRIC EFFECT AND X-RAYSBOOK - ERRORLESS CHAPTER - ELECTRON, PHOTON, PHOTOELECTRIC EFFECT AND X-RAYSEXERCISE - Critical Thinking
1 Videos
- ELECTRO MAGNETIC INDUCTIONBOOK - ERRORLESS CHAPTER - ELECTRO MAGNETIC INDUCTIONEXERCISE - SET
20 Videos
- ELECTRONICSBOOK - ERRORLESS CHAPTER - ELECTRONICSEXERCISE - Selv Evaluation Test
23 Videos
Similar Questions
When the energy of the incident radiation is increased by 20% , kinetic energy of the photoelectrons emitted from a metal surface increased from 0.5eV→0.8eV. The work function of the metal is
View SolutionWhen the energy of the incident radiation is increased by 20% , kinetic energy of the photoelectrons emitted from a metal surface increased from 0.5eV→0.8eV. The work function of the metal is
View Solution
Knowledge Check
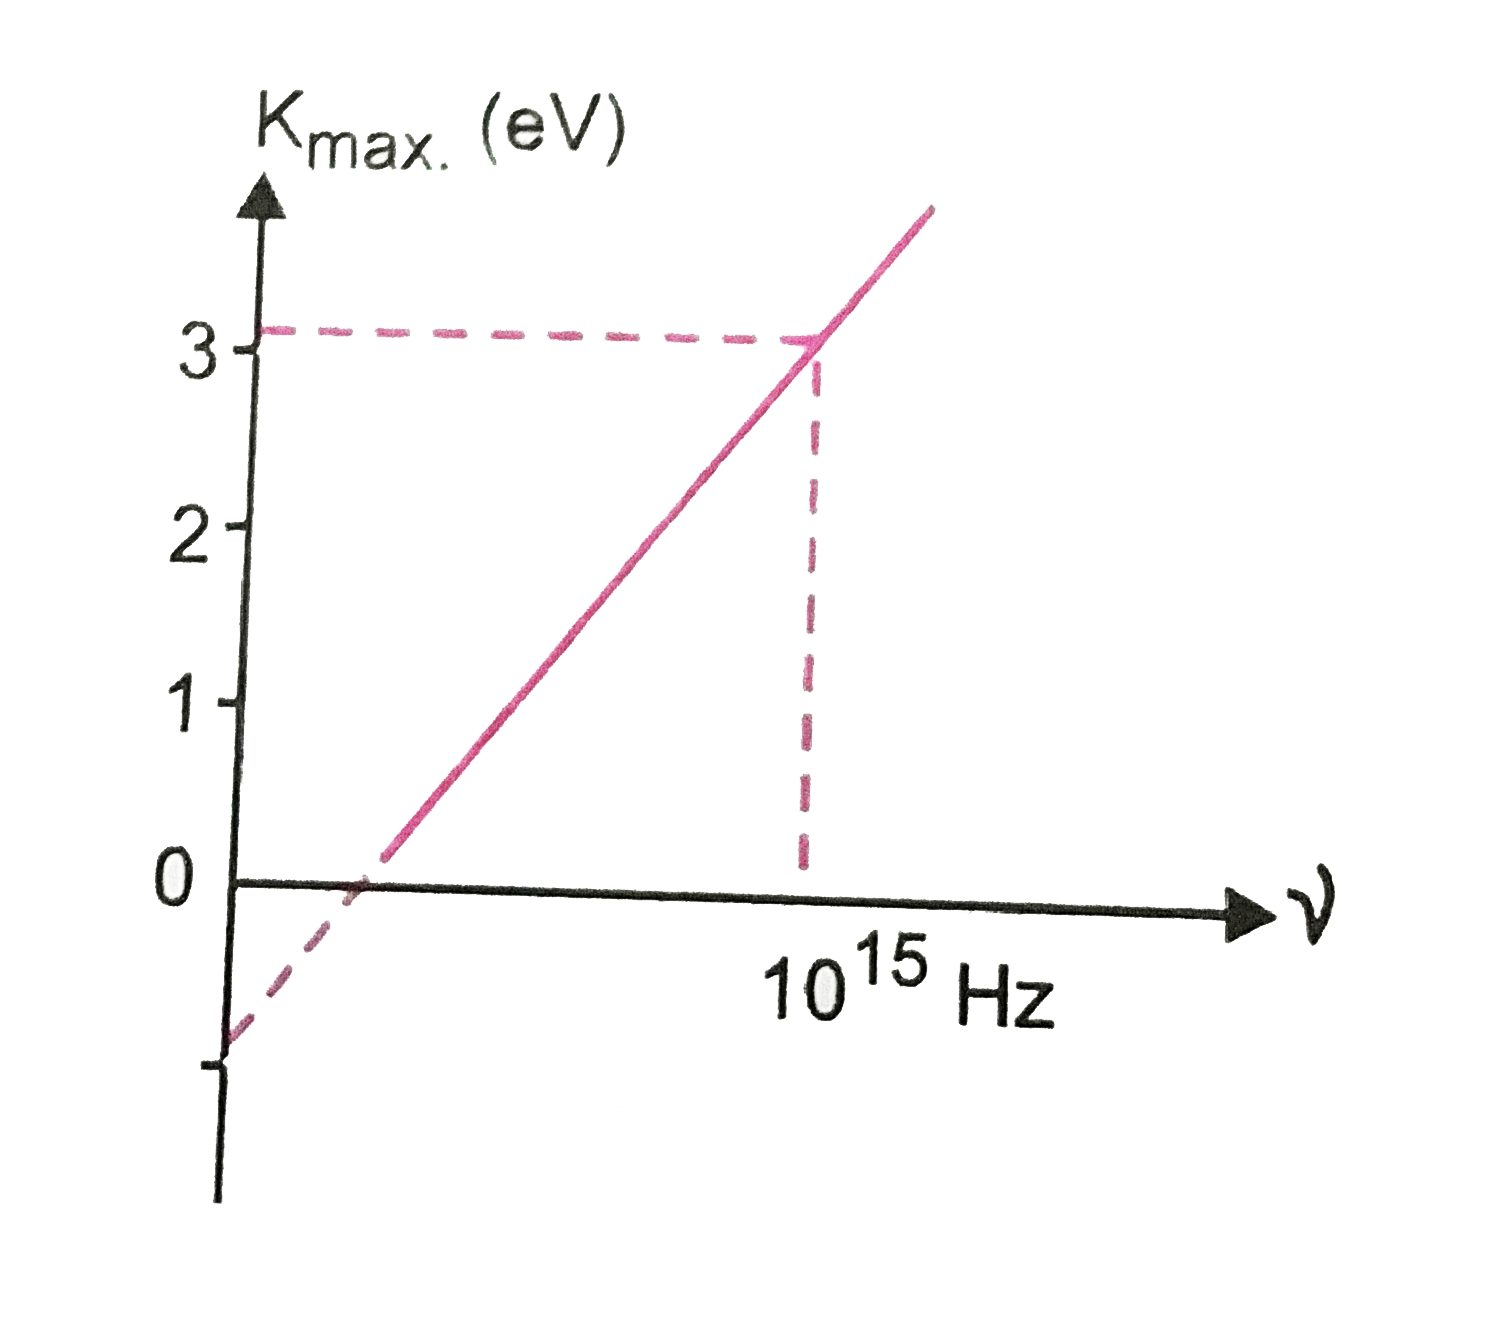
represents a graph of most energetic photoelectrons Kmax(in eV) and frequency v for a metal used as cathode in photoelectrons experiment. The threshold frequency of light for the photoelectric emission from the metal is
 A1×1014HzB1.5×1014HzC2×1014HzD2.7×1014Hz
represents a graph of most energetic photoelectrons Kmax(in eV) and frequency v for a metal used as cathod in photoelectrons experiment. The threshold frequency of light for the photoelectric emission from the metal is
 A1×1014HzB1.5×1014HzC2.1×1014HzD2.7×1014Hz
When the energy of the incident radiation is increased by 20%, the kinetic energy of the photoelectrons emitted from a metal surface increased from 0.5 eV to 0.8 eV. The work function of the metal is:
A0.65 eVB1.0 eVC1.3 eVD1.5eV
Calculate the kinetic energy of a photoelectron (in eV) emitted on shining light of wavelength 6.2×10⁻⁶m on a metal surface. The work function of the metal is 0.1 eV ?
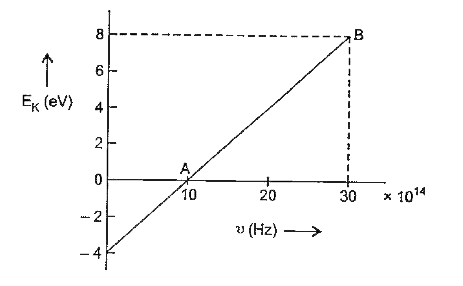
View SolutionIn an experiment of photo-electric effect, the graph of maximum kinetic energy Ek of the emitted photoelectrons versus the frequency v of the incident light is a straight line AB as shown in figure below :

Work function of the metal.
View SolutionWhen the energy of the incident radiation is increased by 20% , kinetic energy of the photoelectrons emitted from a metal surface increased from 0.5eV→0.8eV. The work function of the metal is
View SolutionKmax (in eV) = 3, and frequency of light (in Hz) =1×10¹⁵ for a metal used as a cathode in a photoelectric experiment. The threshold frequency of light for the photoelectric emission from the metal is -
View SolutionKmax (in eV) = 3, and frequency of light (in Hz) =1×10¹⁵ for a metal used as a cathode in a photoelectric experiment. The threshold frequency of light for the photoelectric emission from the metal is -
View Solution
