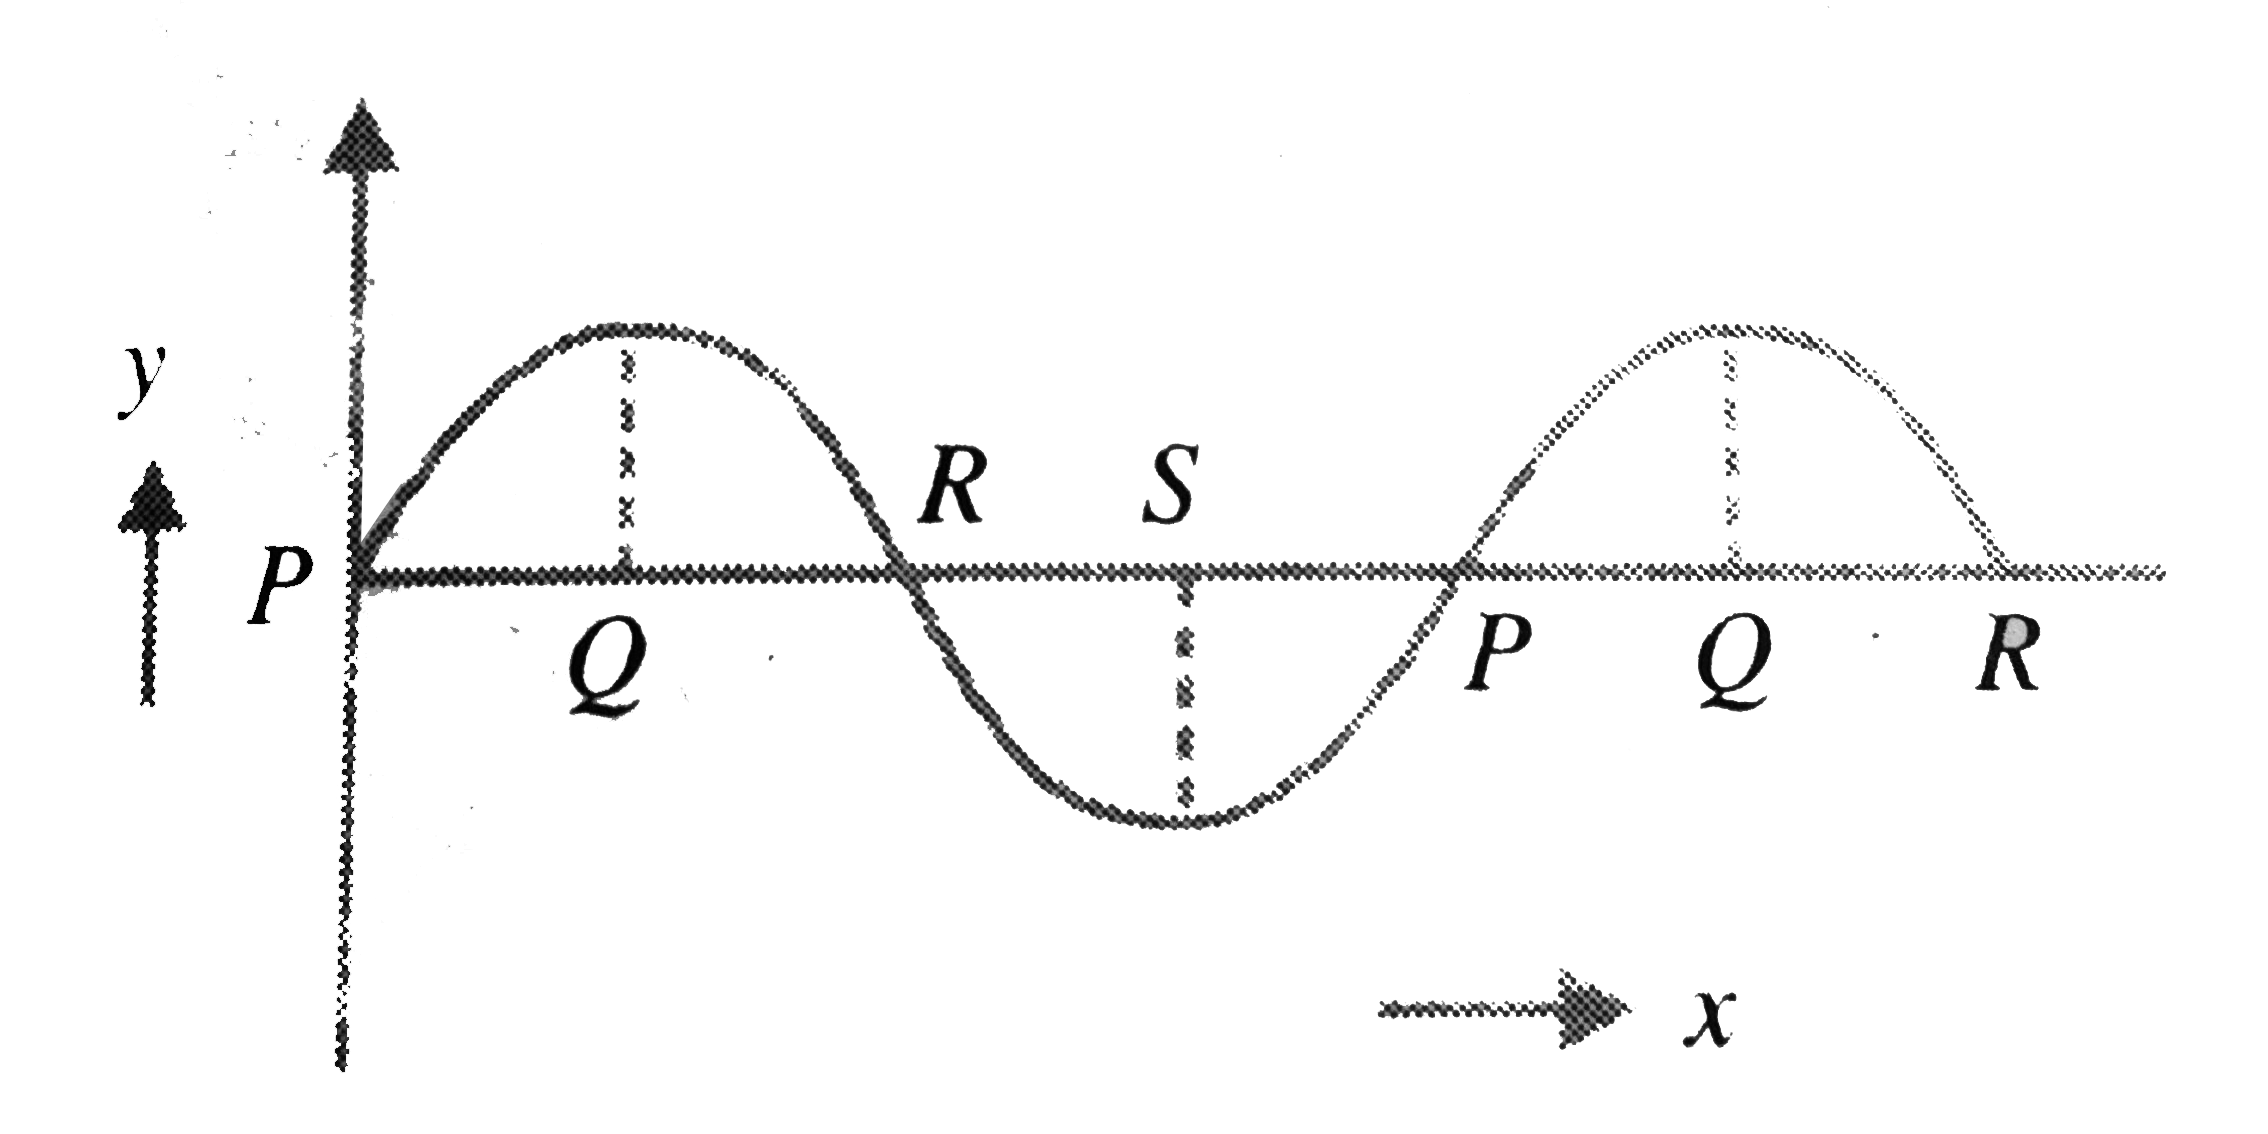
Figure. Represents the displacement y versus distance x along the direction of propagation of a longitudinal wave. The pressure is maximum at position marked
P
Q
R
S
The correct Answer is:C
P=−Bdydx
At R, dydx is most negative. So pressure is maximum.
Topper's Solved these Questions
- SOUND WAVES AND DOPPLER EFFECTBOOK - CENGAGE PHYSICS ENGLISHCHAPTER - SOUND WAVES AND DOPPLER EFFECTEXERCISE - Multiple Correct
44 Videos
- SOUND WAVES AND DOPPLER EFFECTBOOK - CENGAGE PHYSICS ENGLISHCHAPTER - SOUND WAVES AND DOPPLER EFFECTEXERCISE - Assertion-Reasoning
24 Videos
- SOUND WAVES AND DOPPLER EFFECTBOOK - CENGAGE PHYSICS ENGLISHCHAPTER - SOUND WAVES AND DOPPLER EFFECTEXERCISE - Subjective
56 Videos
- RIGID BODY DYNAMICS 2BOOK - CENGAGE PHYSICS ENGLISHCHAPTER - RIGID BODY DYNAMICS 2EXERCISE - Interger
2 Videos
- SUPERPOSITION AND STANDING WAVESBOOK - CENGAGE PHYSICS ENGLISHCHAPTER - SUPERPOSITION AND STANDING WAVESEXERCISE - Comprehension Type
5 Videos
Similar Questions
Knowledge Check
If E and B represent electric and magnetic field vectors of the electromagnetic wave, the direction of propagation of eletromagnetic wave is along.
A→EB→BC→B×→ED→E×→BWith the propagation of a longitudinal wave through a material medium, the quantities transmitted in the propagation direction are
AEnergy, momentum and massBEnergyCEnergy and massDEnergy and linear momentum
If E and B represent electric and magnetic field vectors of the electromagnetic wave, the direction of propagation of eletromagnetic wave is along.
View SolutionIf E and B represent electric and magnetic field vectors of the electromagnetic wave, the direction of propagation of eletromagnetic wave is along.
View Solution
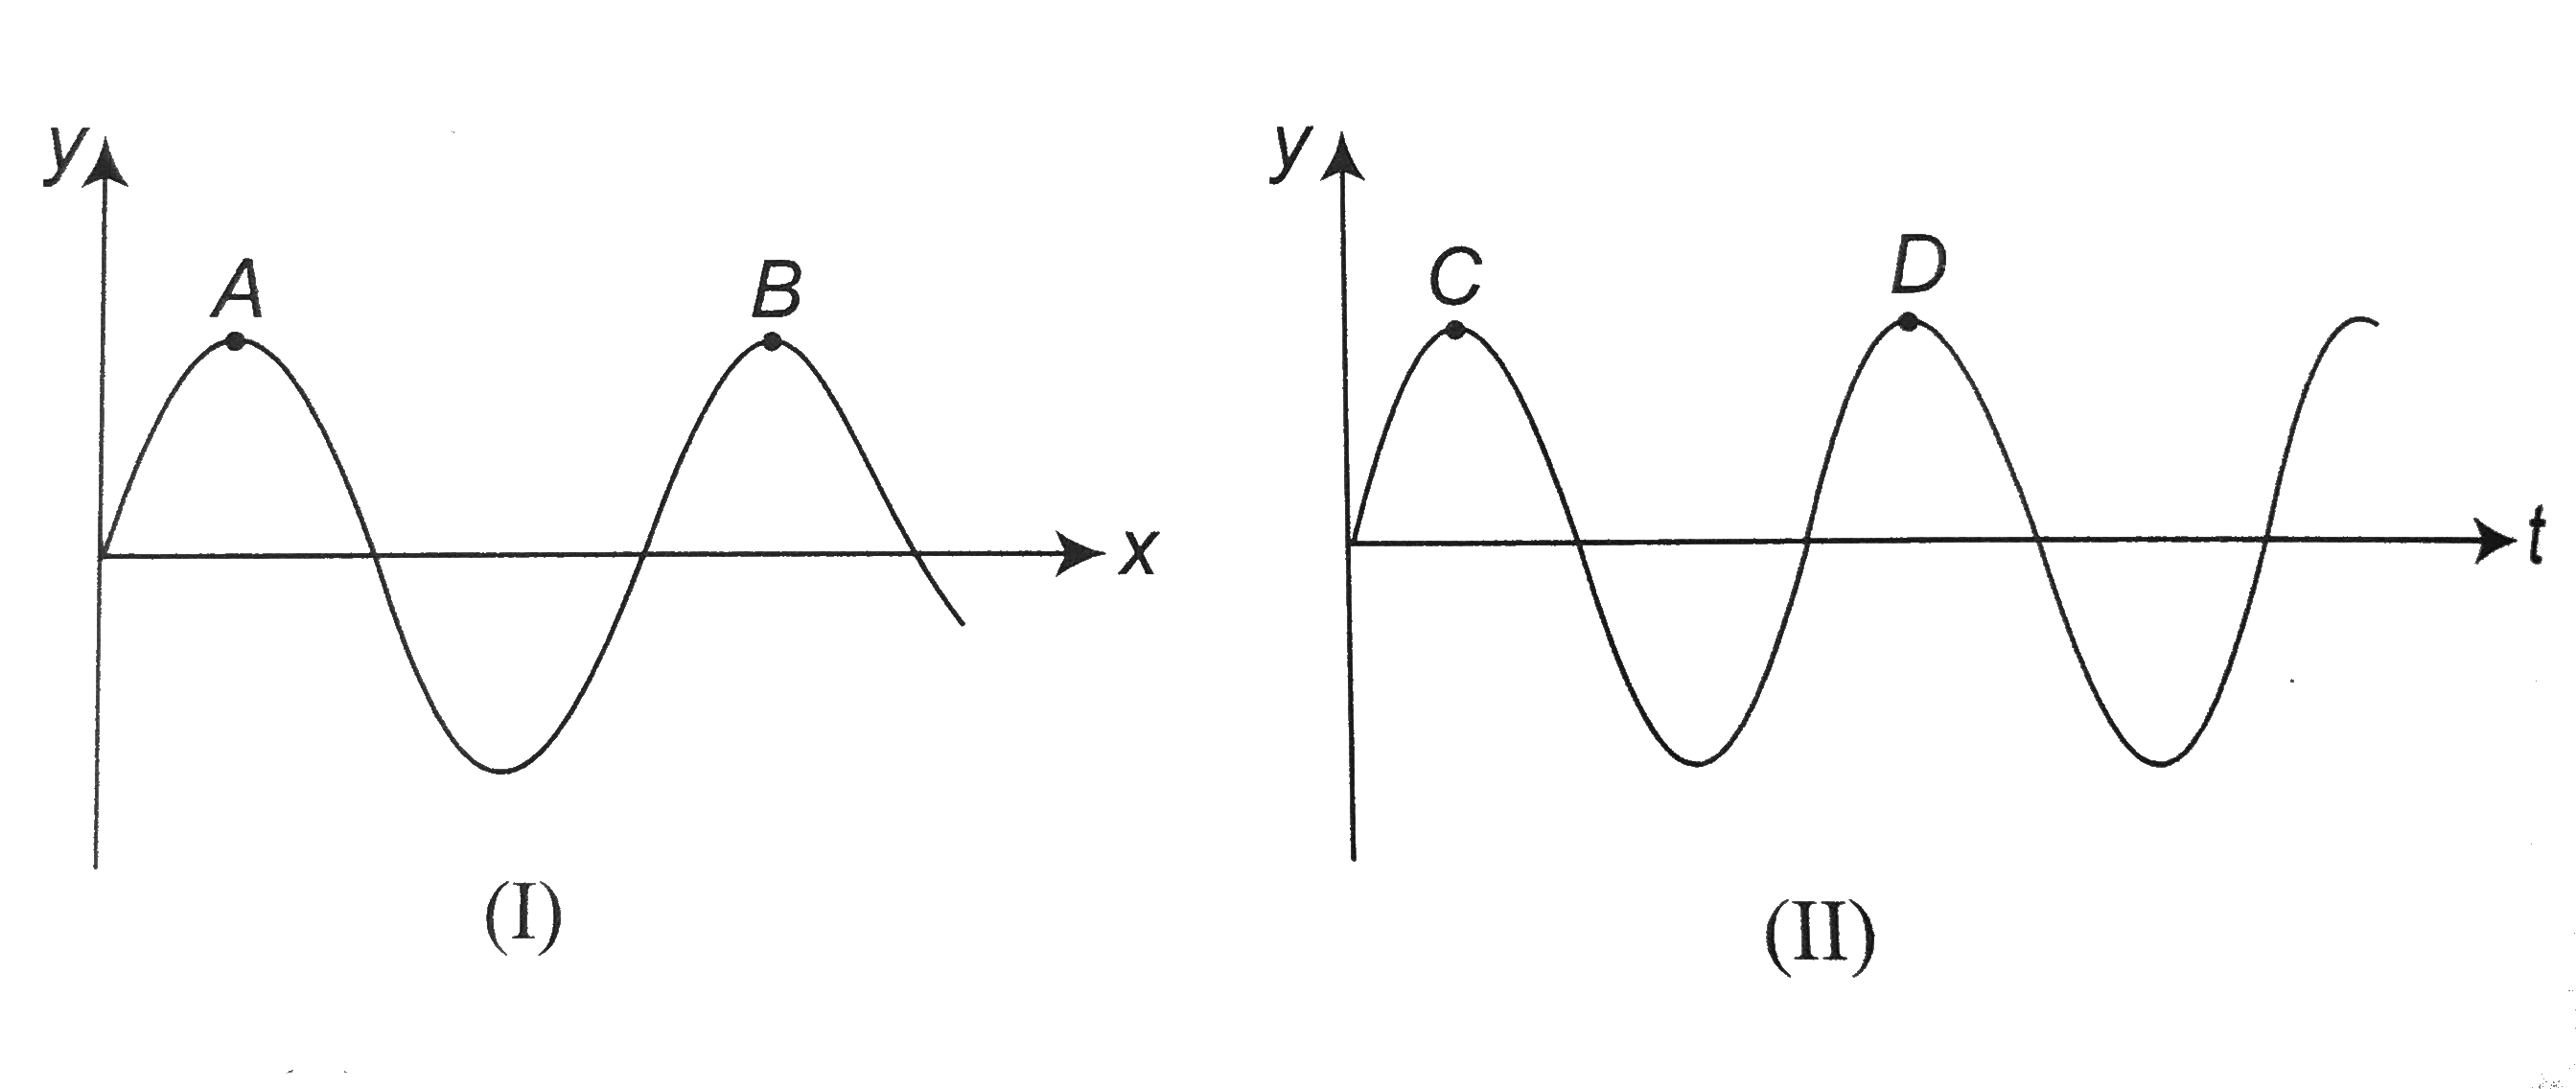
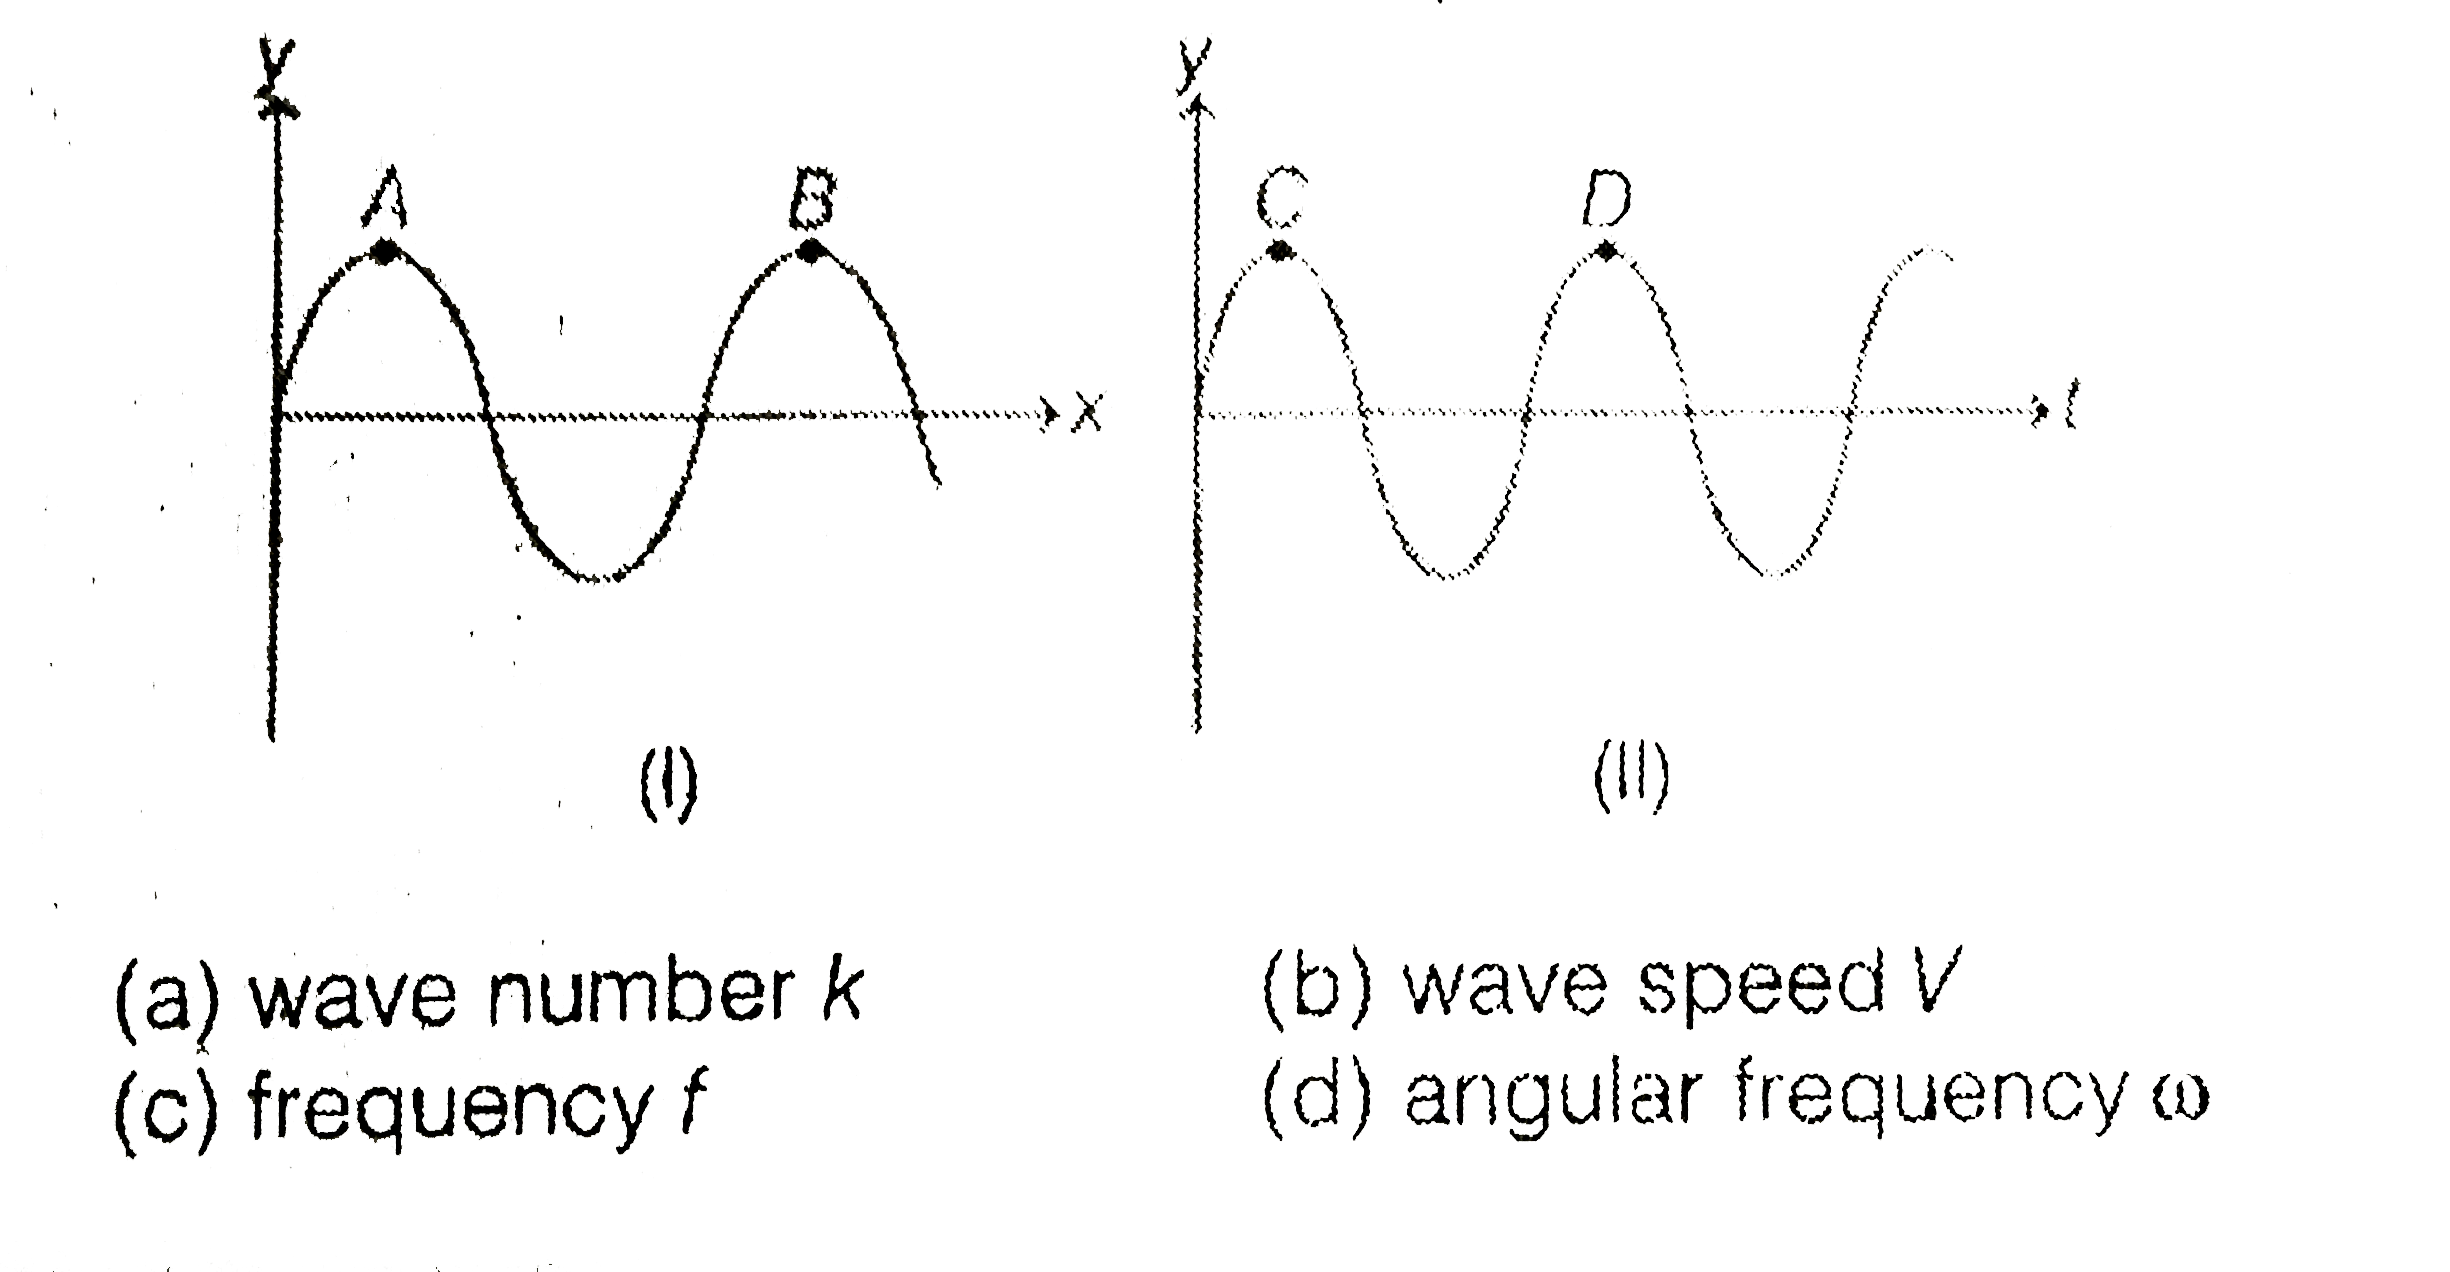
The same progressive wave is represented by two graphs I and II. Graph I shows how the displacement y varies with the distance x along the wave at a given time. Graph II shows how y varies with time t at a given point on the wave. The ratio of measurements AB to CD, marked on the curves represents:
View Solutionthe same progressive wave is reprsented by two group I and II. Graoup I shows how the displacement 'y' varies with the distance x along the wave at a given time. Graph II shows how y varies with time t at a given point on the wave. The ratio of measurements AB to CD, marked on the curvse m repersents.

View SolutionWith the propagation of a longitudinal wave through a material medium, the quantities transmitted in the propagation direction are
View SolutionA plane progressive wave propagating along positive x-axis is
View Solution
