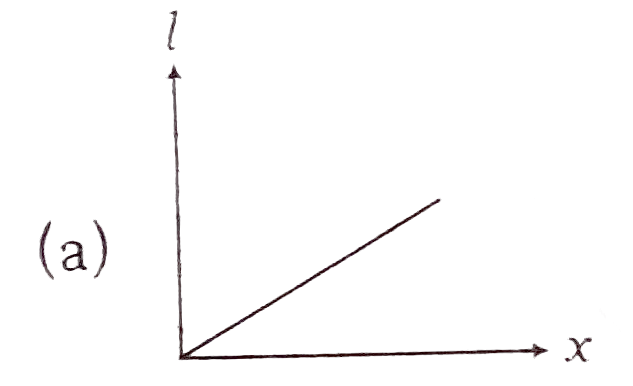
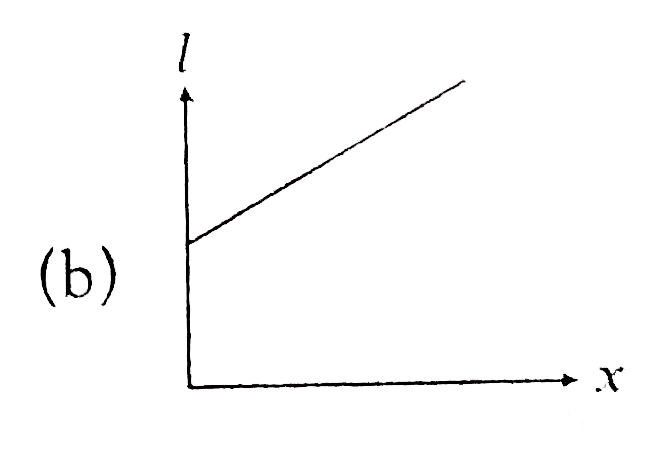
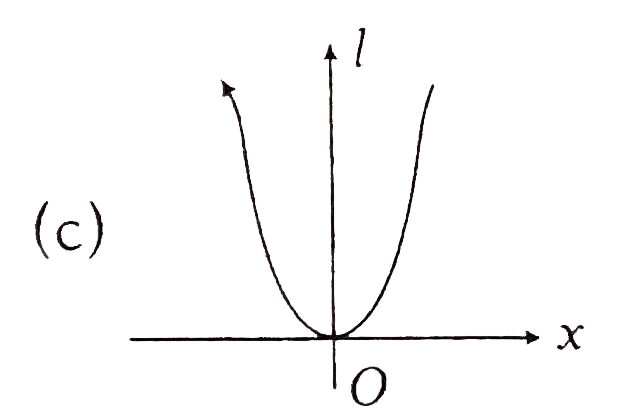
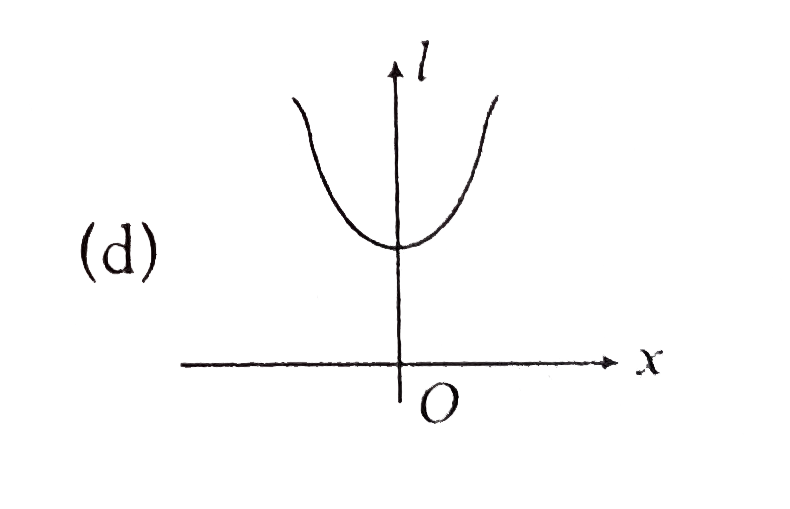
Figure represents the moment of inertia of the solid sphere about an axis parallel to the diameter of the solid sphere and at a distance x from t. Which one of the following represents the variations of I with x ?
A
B
C
D
Video Solution
Text Solution
The correct Answer is:D
Moment of inertia, I=ICM+mx2
i.e., I−x graph is a parabol not passing through origin.
|
Topper's Solved these Questions
- ROTATIONBOOK - DC PANDEYCHAPTER - ROTATIONEXERCISE - (B) Chapter Exercises
25 Videos
- ROTATIONBOOK - DC PANDEYCHAPTER - ROTATIONEXERCISE - (C) Chapter Exercises
39 Videos
- ROTATIONBOOK - DC PANDEYCHAPTER - ROTATIONEXERCISE - Check point 9.3
15 Videos
- RAY OPTICSBOOK - DC PANDEYCHAPTER - RAY OPTICSEXERCISE - Integer type q.
15 Videos
- ROTATIONAL MECHANICSBOOK - DC PANDEYCHAPTER - ROTATIONAL MECHANICSEXERCISE - Subjective Questions
2 Videos
Similar Questions
Knowledge Check
If I is the M.I. of a solid sphere about an axis parallel to a diameter of the sphere and at a distance x from it, which of following graphs represents the variation of I with x
A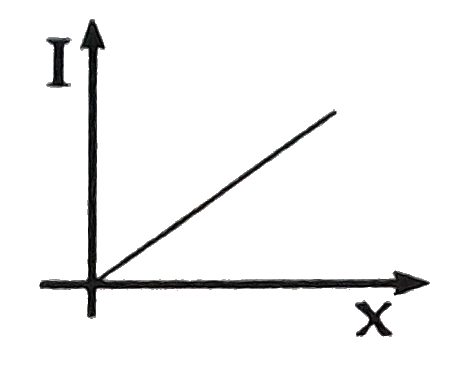 B
B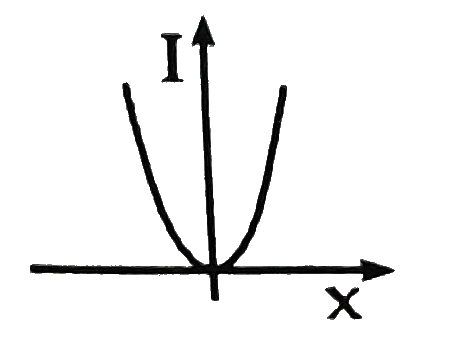 C
C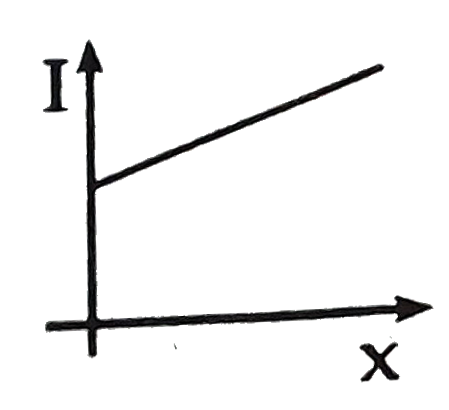 D
D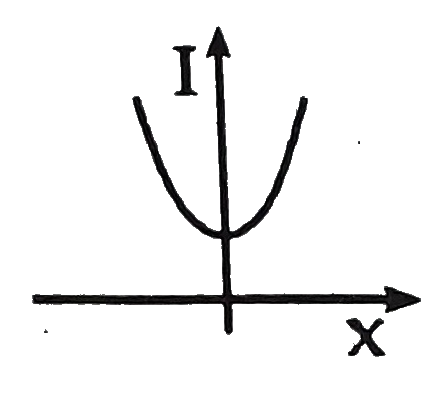
The moment of inertia of a solid sphere, about an axis parallel to its diameter and at a distance of x form it is, 'I(x)'. Which one of the graphs represents the variation of 'I(x) with x correctly ?
A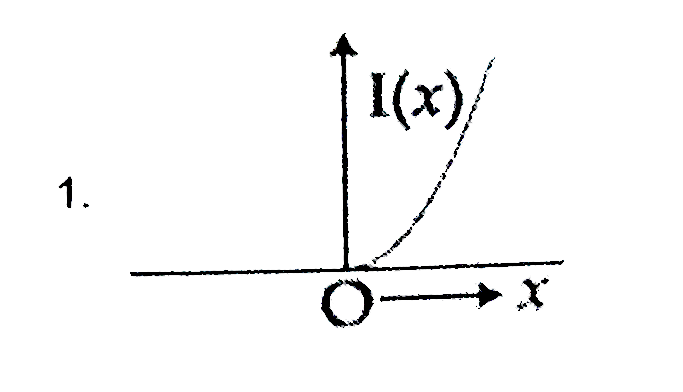 B
B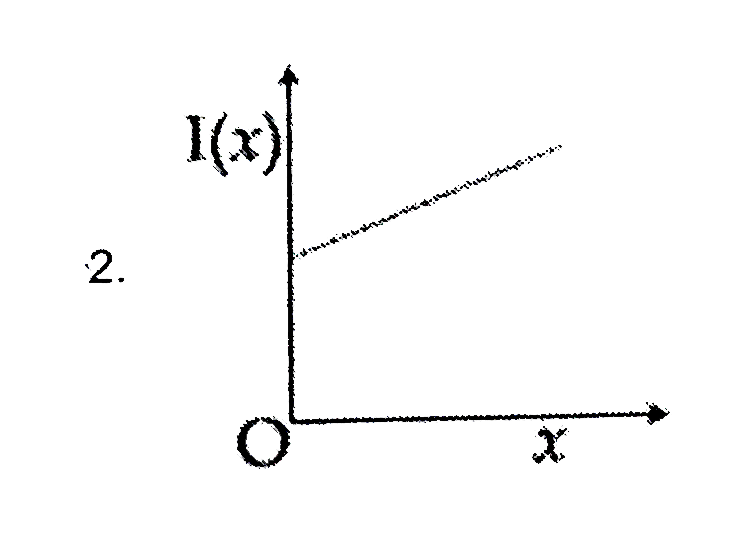 C
C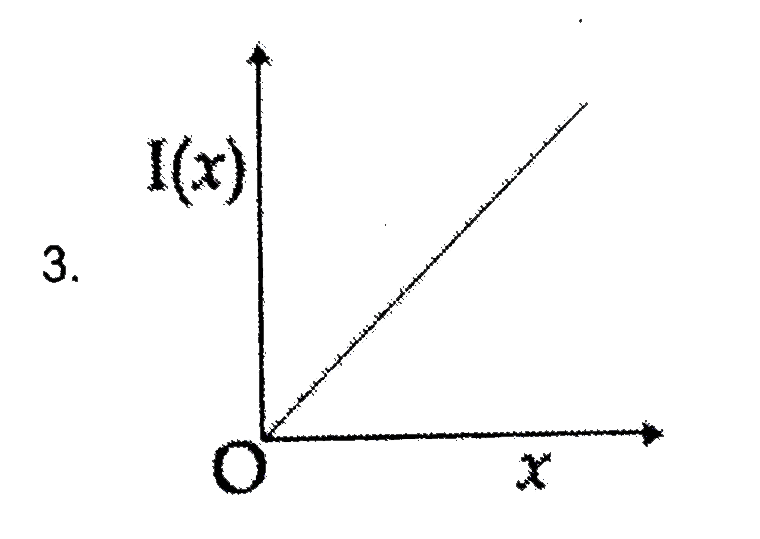 D
D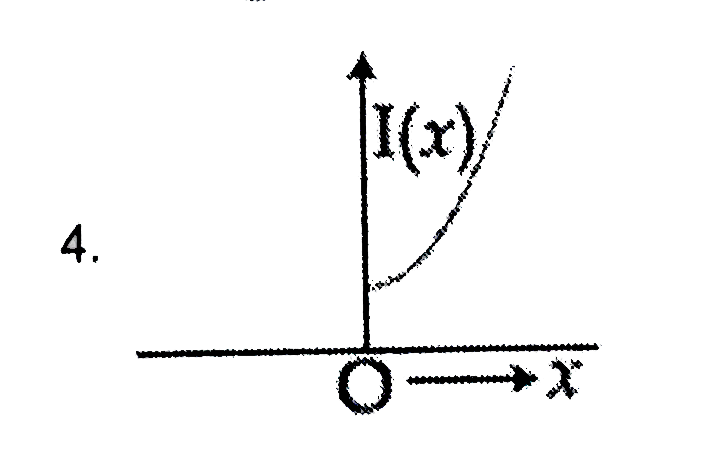
The moment of inertia of a solid sphere, about an axis parallel to its diameter and at a distance of x form it is, 'I(x)'. Which one of the graphs represents the variation of 'I(x) with x correctly ?
A B
B C
C D
D
If temperature increases, the moment of inertia of a solid sphere about its diameter
View SolutionThe moment of inertia of a solid sphere of density p and radius R about its diameter is
View SolutionWith the increase in temperate, moment of inertia of a solid sphere about the diameter.
View SolutionMoment of inertia of a solid sphere of radius R and density p about its diameter is
View SolutionWhat is the moment of inertia of solid sphere of density ρ and radius R about its diameter ?
View Solution
