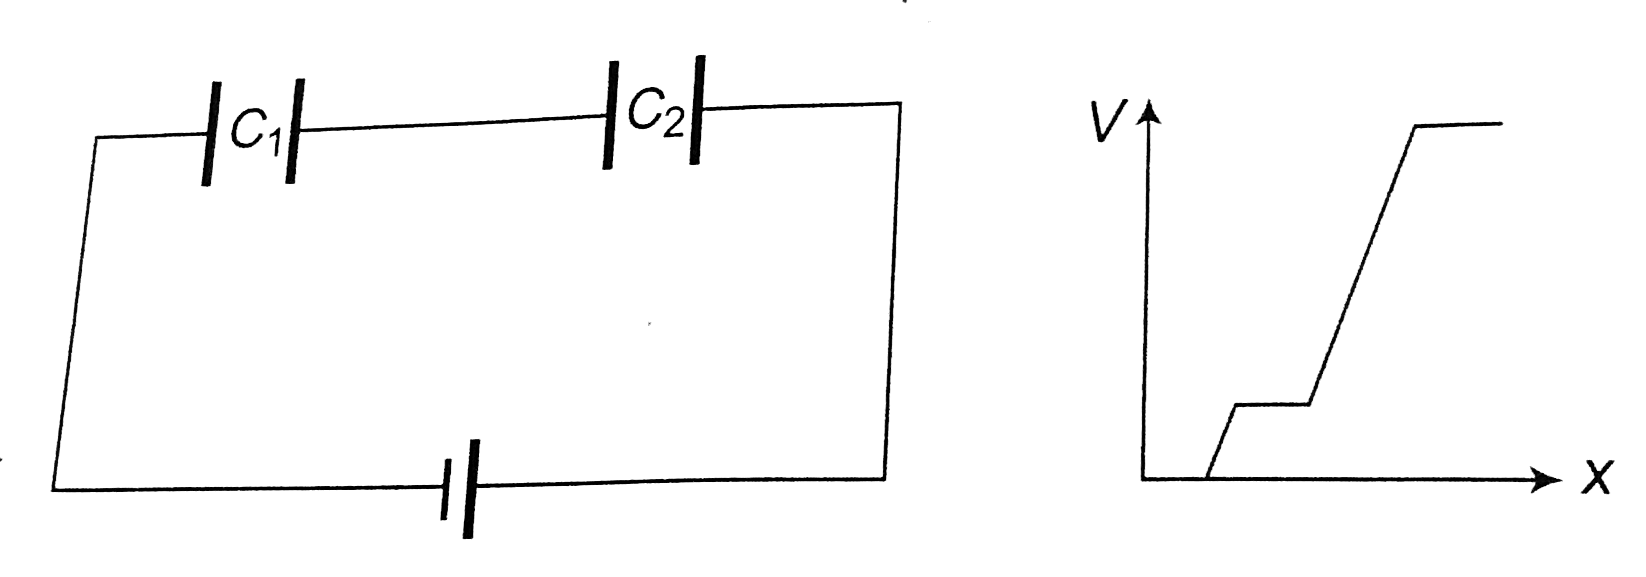
Figure show two capacitors connected in series and joind to a bettery. The graph shows the variation in potential as one movies from left to right on the branch containing the capacitors.

C1>C
C1=C2
C1<C2
The information is not sufficient to decide the ralation between Q+ and Q.
The correct Answer is:C
Step by step video, text & image solution for Figure show two capacitors connected in series and joind to a bettery. The graph shows the variation in potential as one movies from left to right on the branch containing the capacitors. by Physics experts to help you in doubts & scoring excellent marks in Class 12 exams.
Updated on:21/07/2023Topper's Solved these Questions
- CAPACITORSBOOK - HC VERMACHAPTER - CAPACITORSEXERCISE - Objective 2
7 Videos
- CAPACITORSBOOK - HC VERMACHAPTER - CAPACITORSEXERCISE - Exercises
66 Videos
- CAPACITORSBOOK - HC VERMACHAPTER - CAPACITORSEXERCISE - Short Answer
7 Videos
- BOHR'S MODEL AND PHYSICS OF THE ATOMBOOK - HC VERMACHAPTER - BOHR'S MODEL AND PHYSICS OF THE ATOMEXERCISE - Exercises
46 Videos
- DISPERSION AND SPECTRABOOK - HC VERMACHAPTER - DISPERSION AND SPECTRAEXERCISE - Exercises
11 Videos
Similar Questions
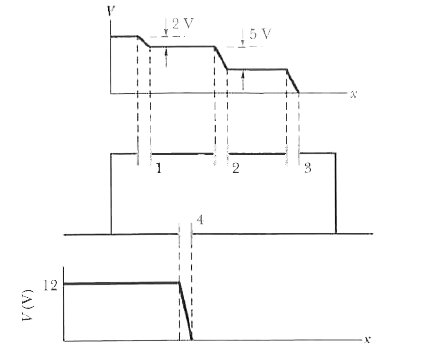
Figure 25-41 shows a circuit section of four air filled capacitors that is connected to a larger circuit. The graph below the section shows the electrin potential V(x) as a function of position x along the lower part of the section, through capacitor 4. Similarly the graph above the section shows the electric potential V(x) as a function of position x along the upper part of the section, through capacitors 1,2 and 3 capacitors 3 has a capacitance of 1.60μF What are the capacitances of (a) capacitor 1 and (b) capacitor 2?
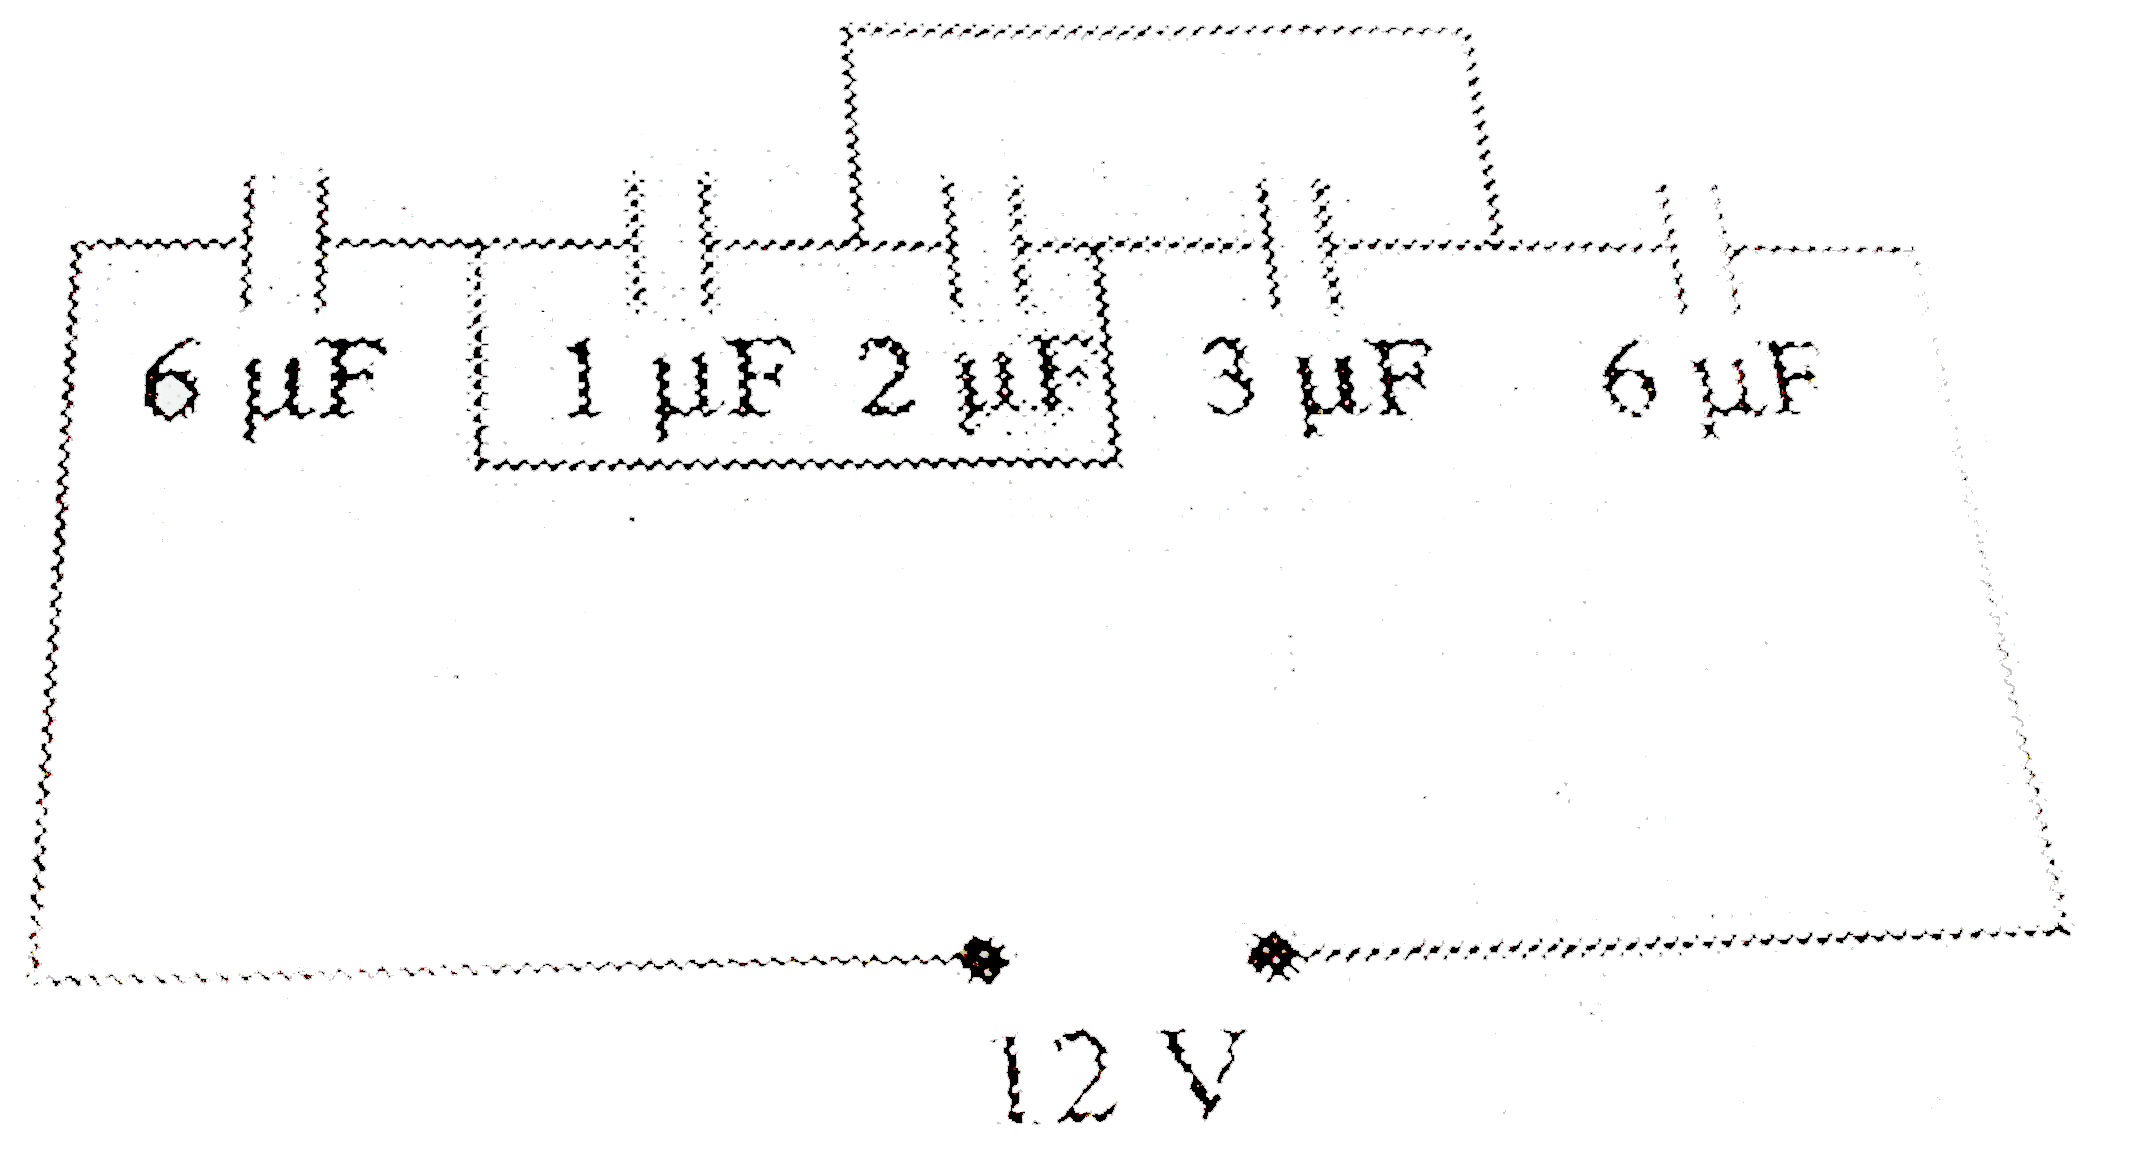
View SolutionFigure shows five capacitors connected across a 12V power supply. What is the charge on the 2μF capacitor ?
View Solution
Knowledge Check
Consider the situation as shown in figure. The variation of potential as one moves from left to right along branch containing the capacitors, if
 AC1=C2BC1<C2CC1>C2Dnone
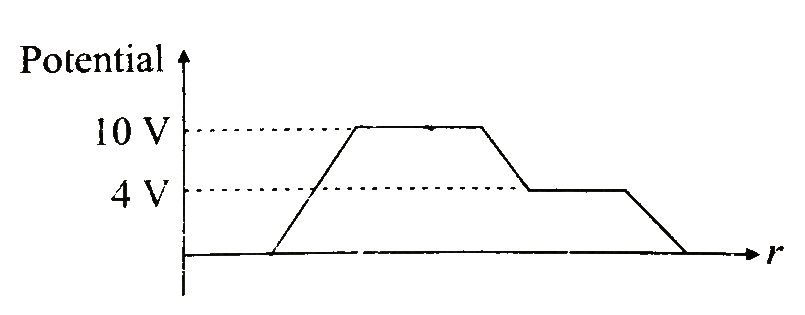
Figure shows two capacitors C1andC2 connected with 10 V battery and terminal A and B are earthed. The graphs shows the variation of potential as one moves from left to right. Then the ratio C1/C2 is
 A5/2B2/3C2/5D4/3
Five capacitors are connected in series as shown in figure with a battery of emf 20V and the point B is earthed. The potential of point A is
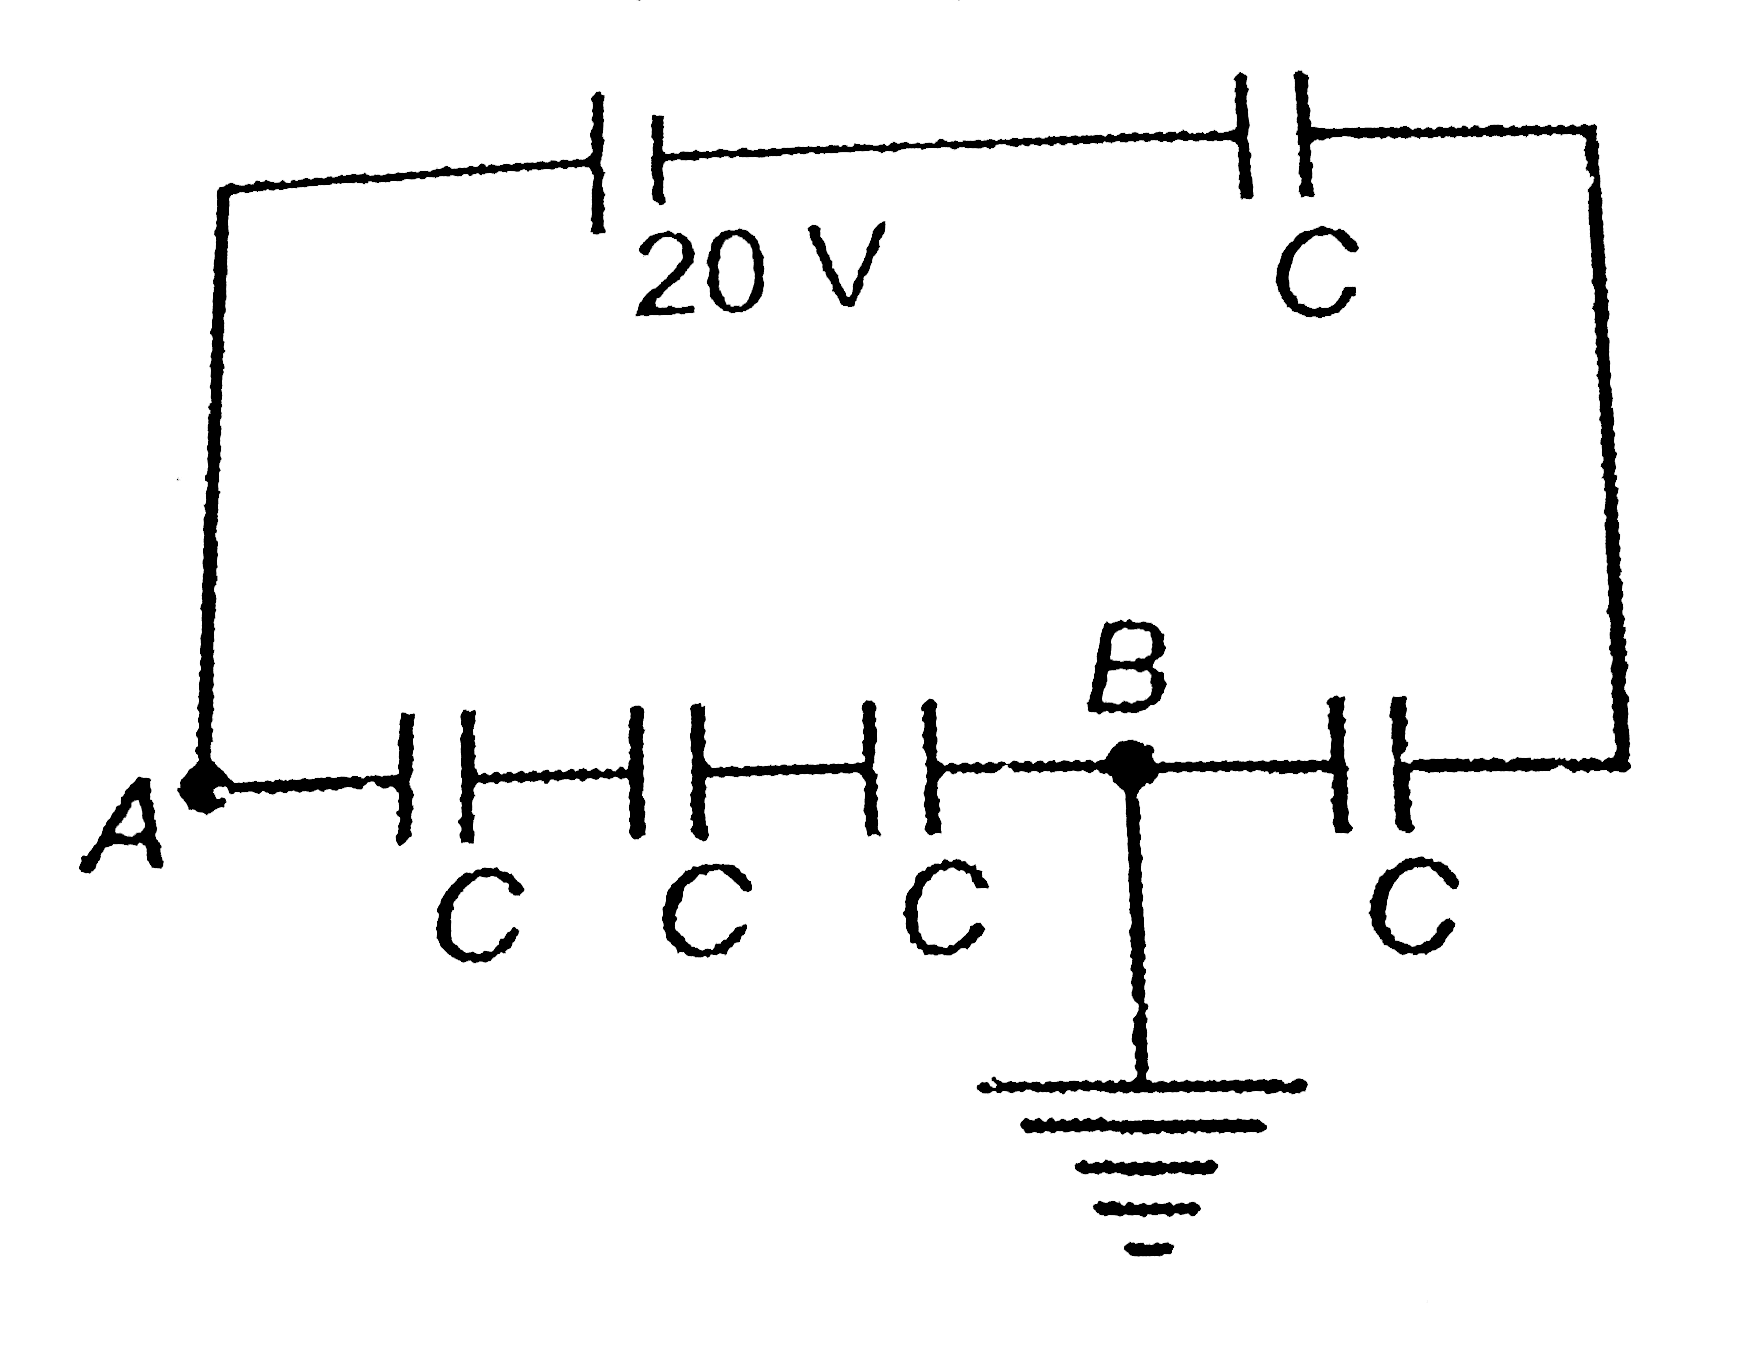 A20VB10VC4VD12V
Four identical capacitors are connected in series with a 10V battery as shown in the figure. The point N is earthed. The potentials of points A and B are
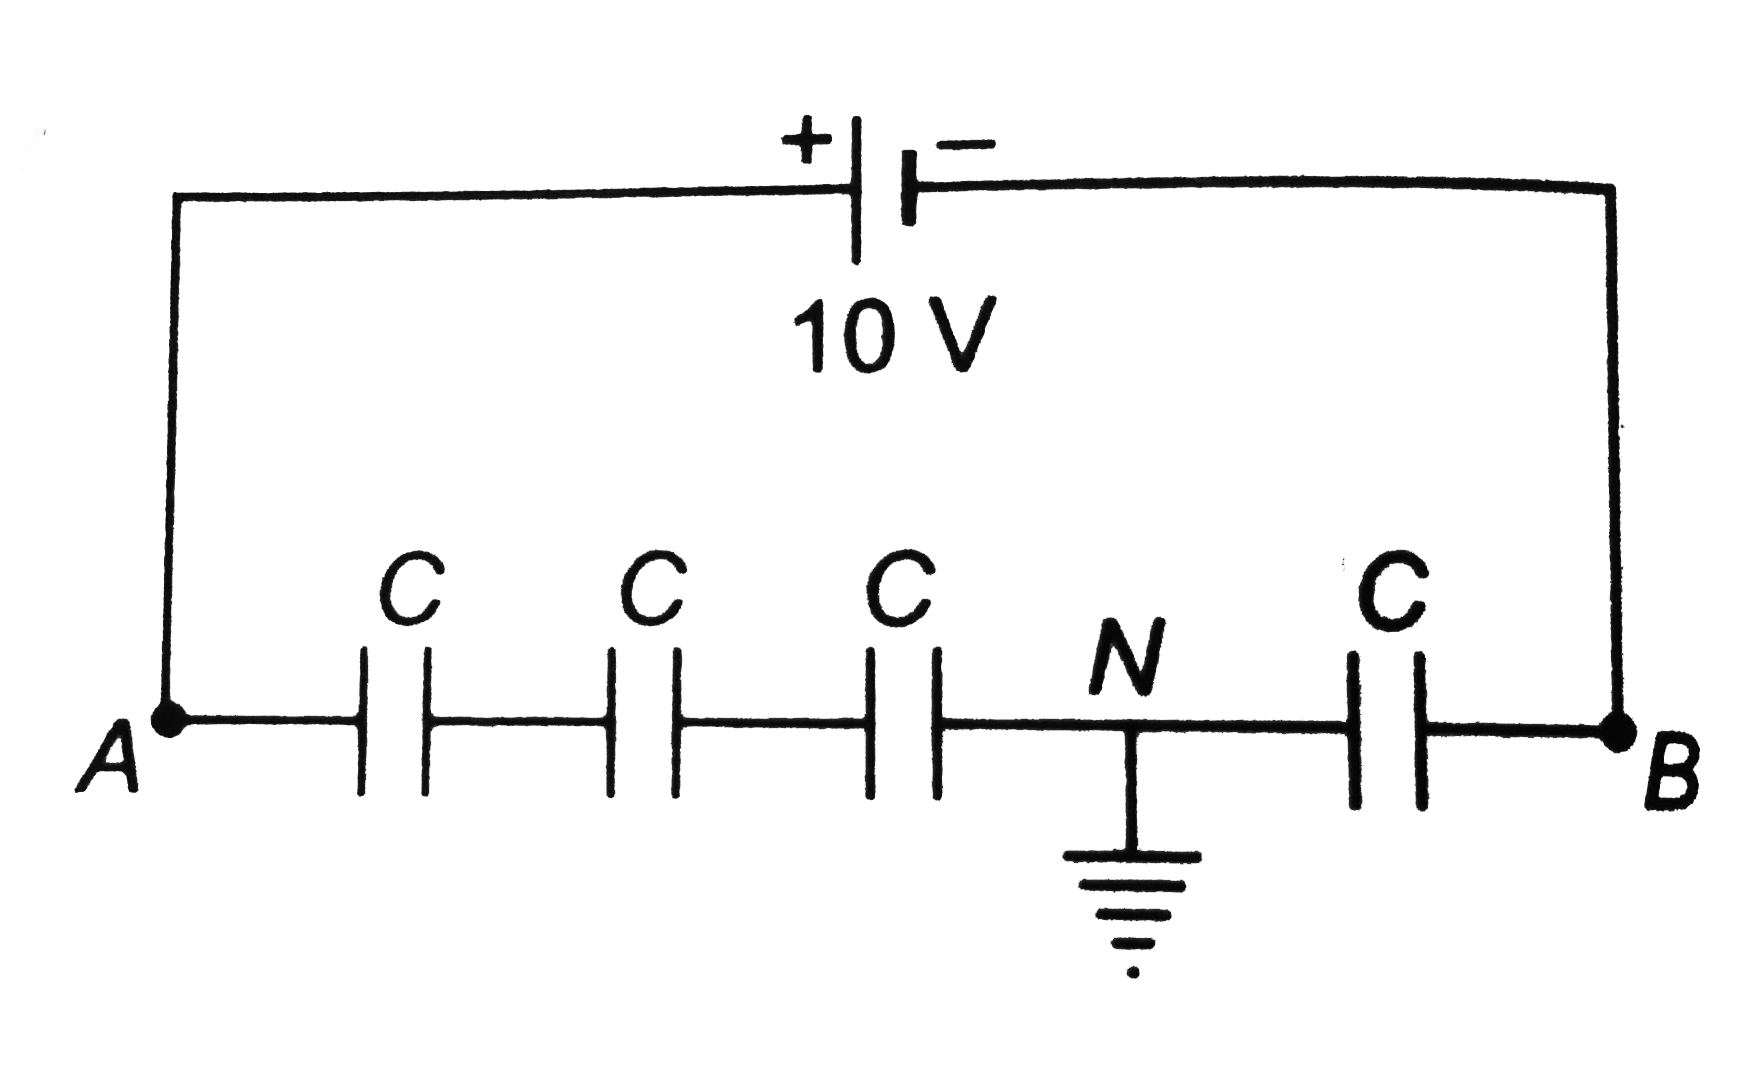
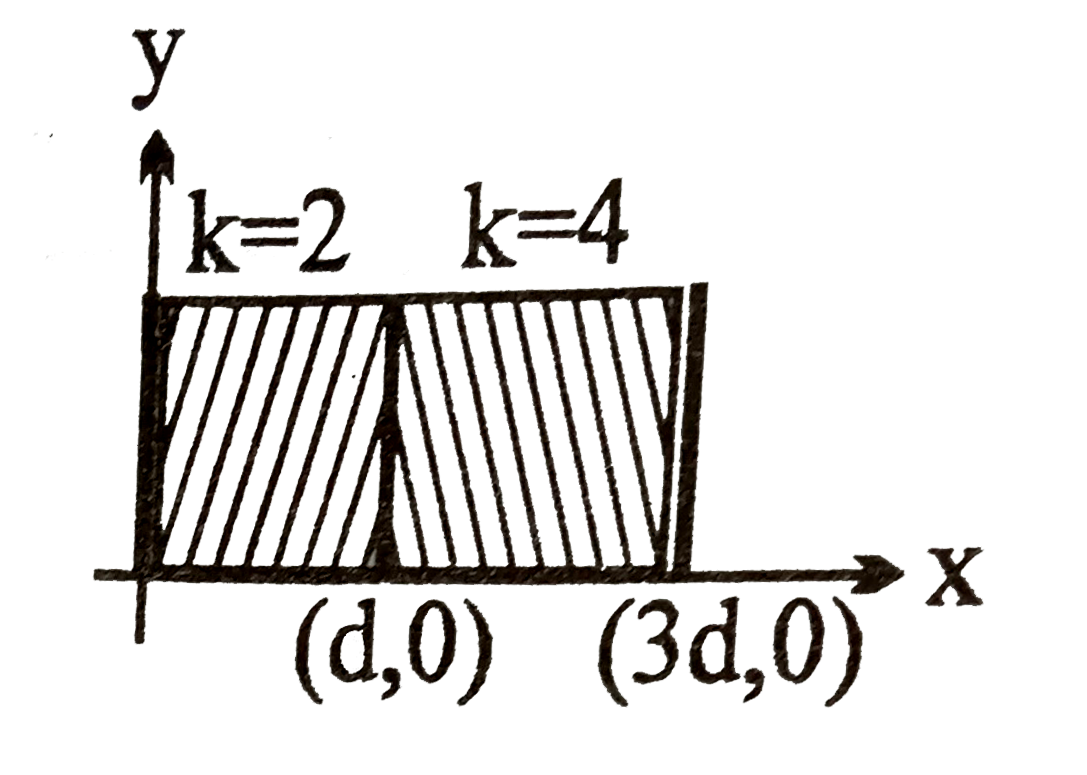
View SolutionA parallel plate capacitor has two layers of dielectric as shown in figure. This capacitor is connected across a battery. The graph which shows the variation of electric field (E) and distance (X) from left plate.
View SolutionFigure shows a conductor of tapered cone shape. As one goes from left to right on conductor choose correct option.
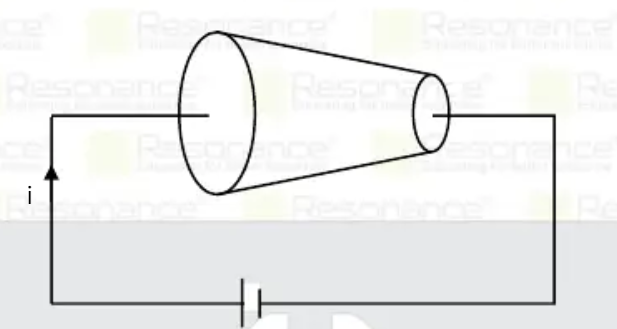
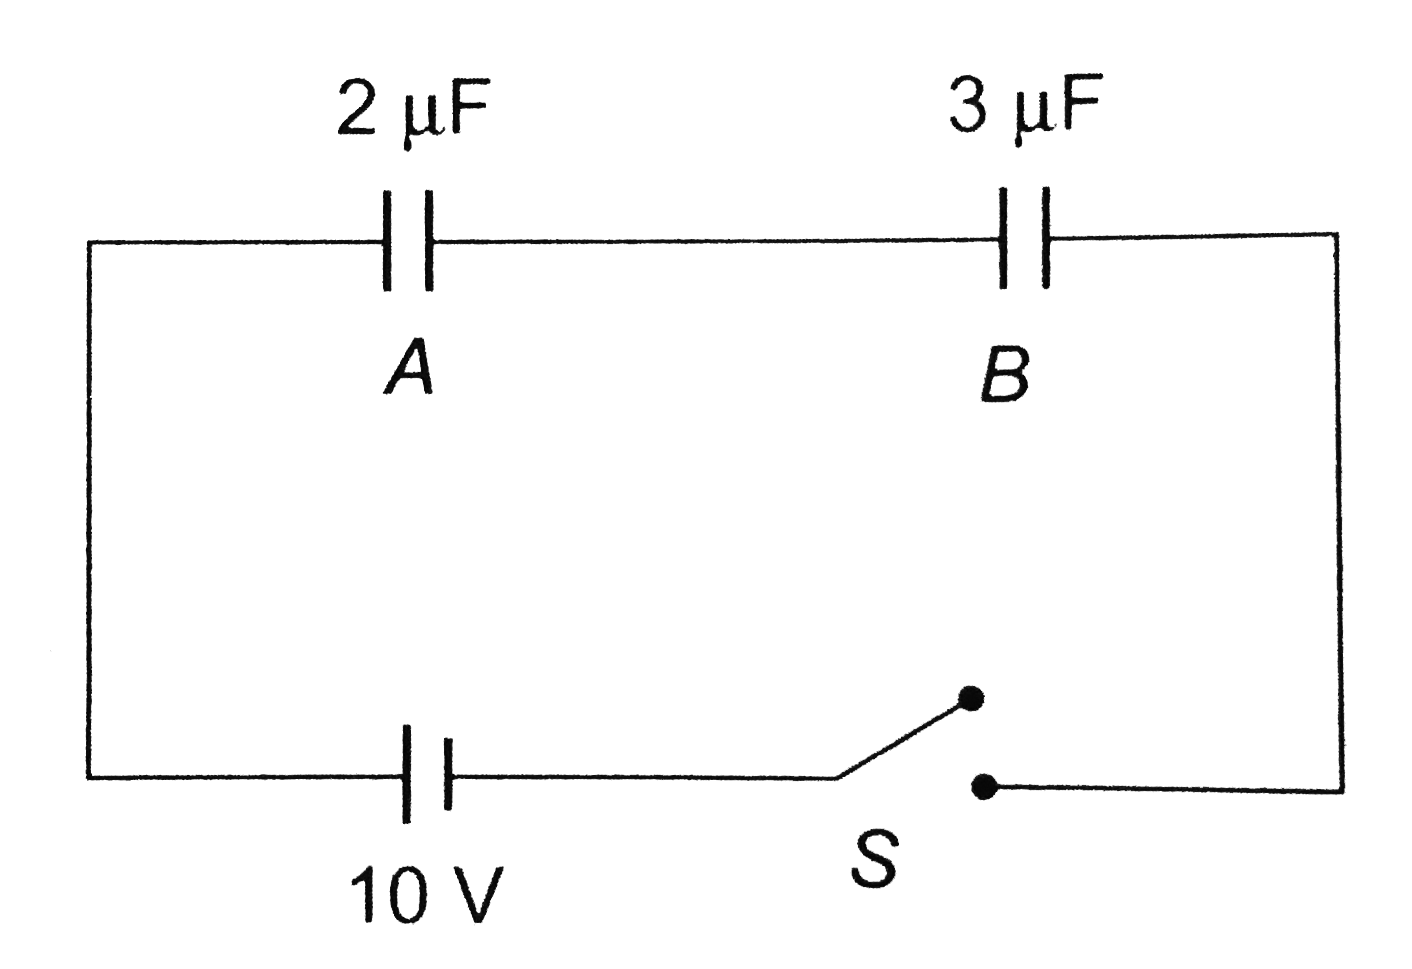
View SolutionTwo capacitors A and B are connected in series with a battery as shown in the figure. When the switch S is closed and the two capacitors get charged fully, then
View SolutionTwo identical parallel plate air capacitors are connected in series to a battery of emf V. If one of the capacitor is completely filled with dielectric material of constant K, then potential difference of the other capacitor will become
View Solution
