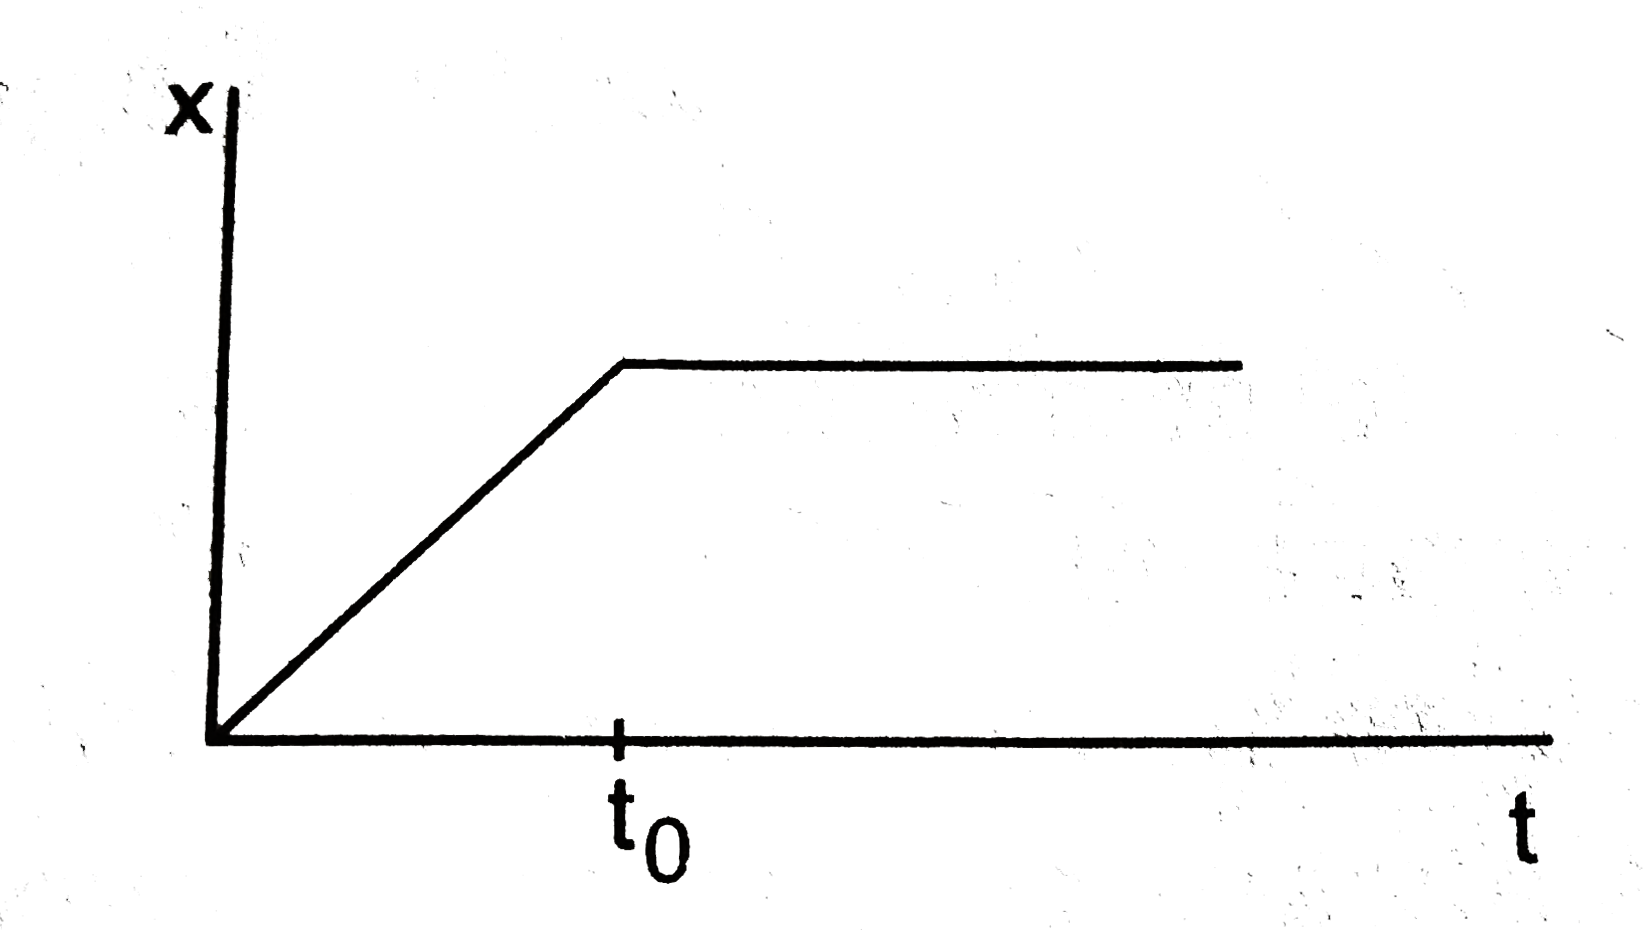
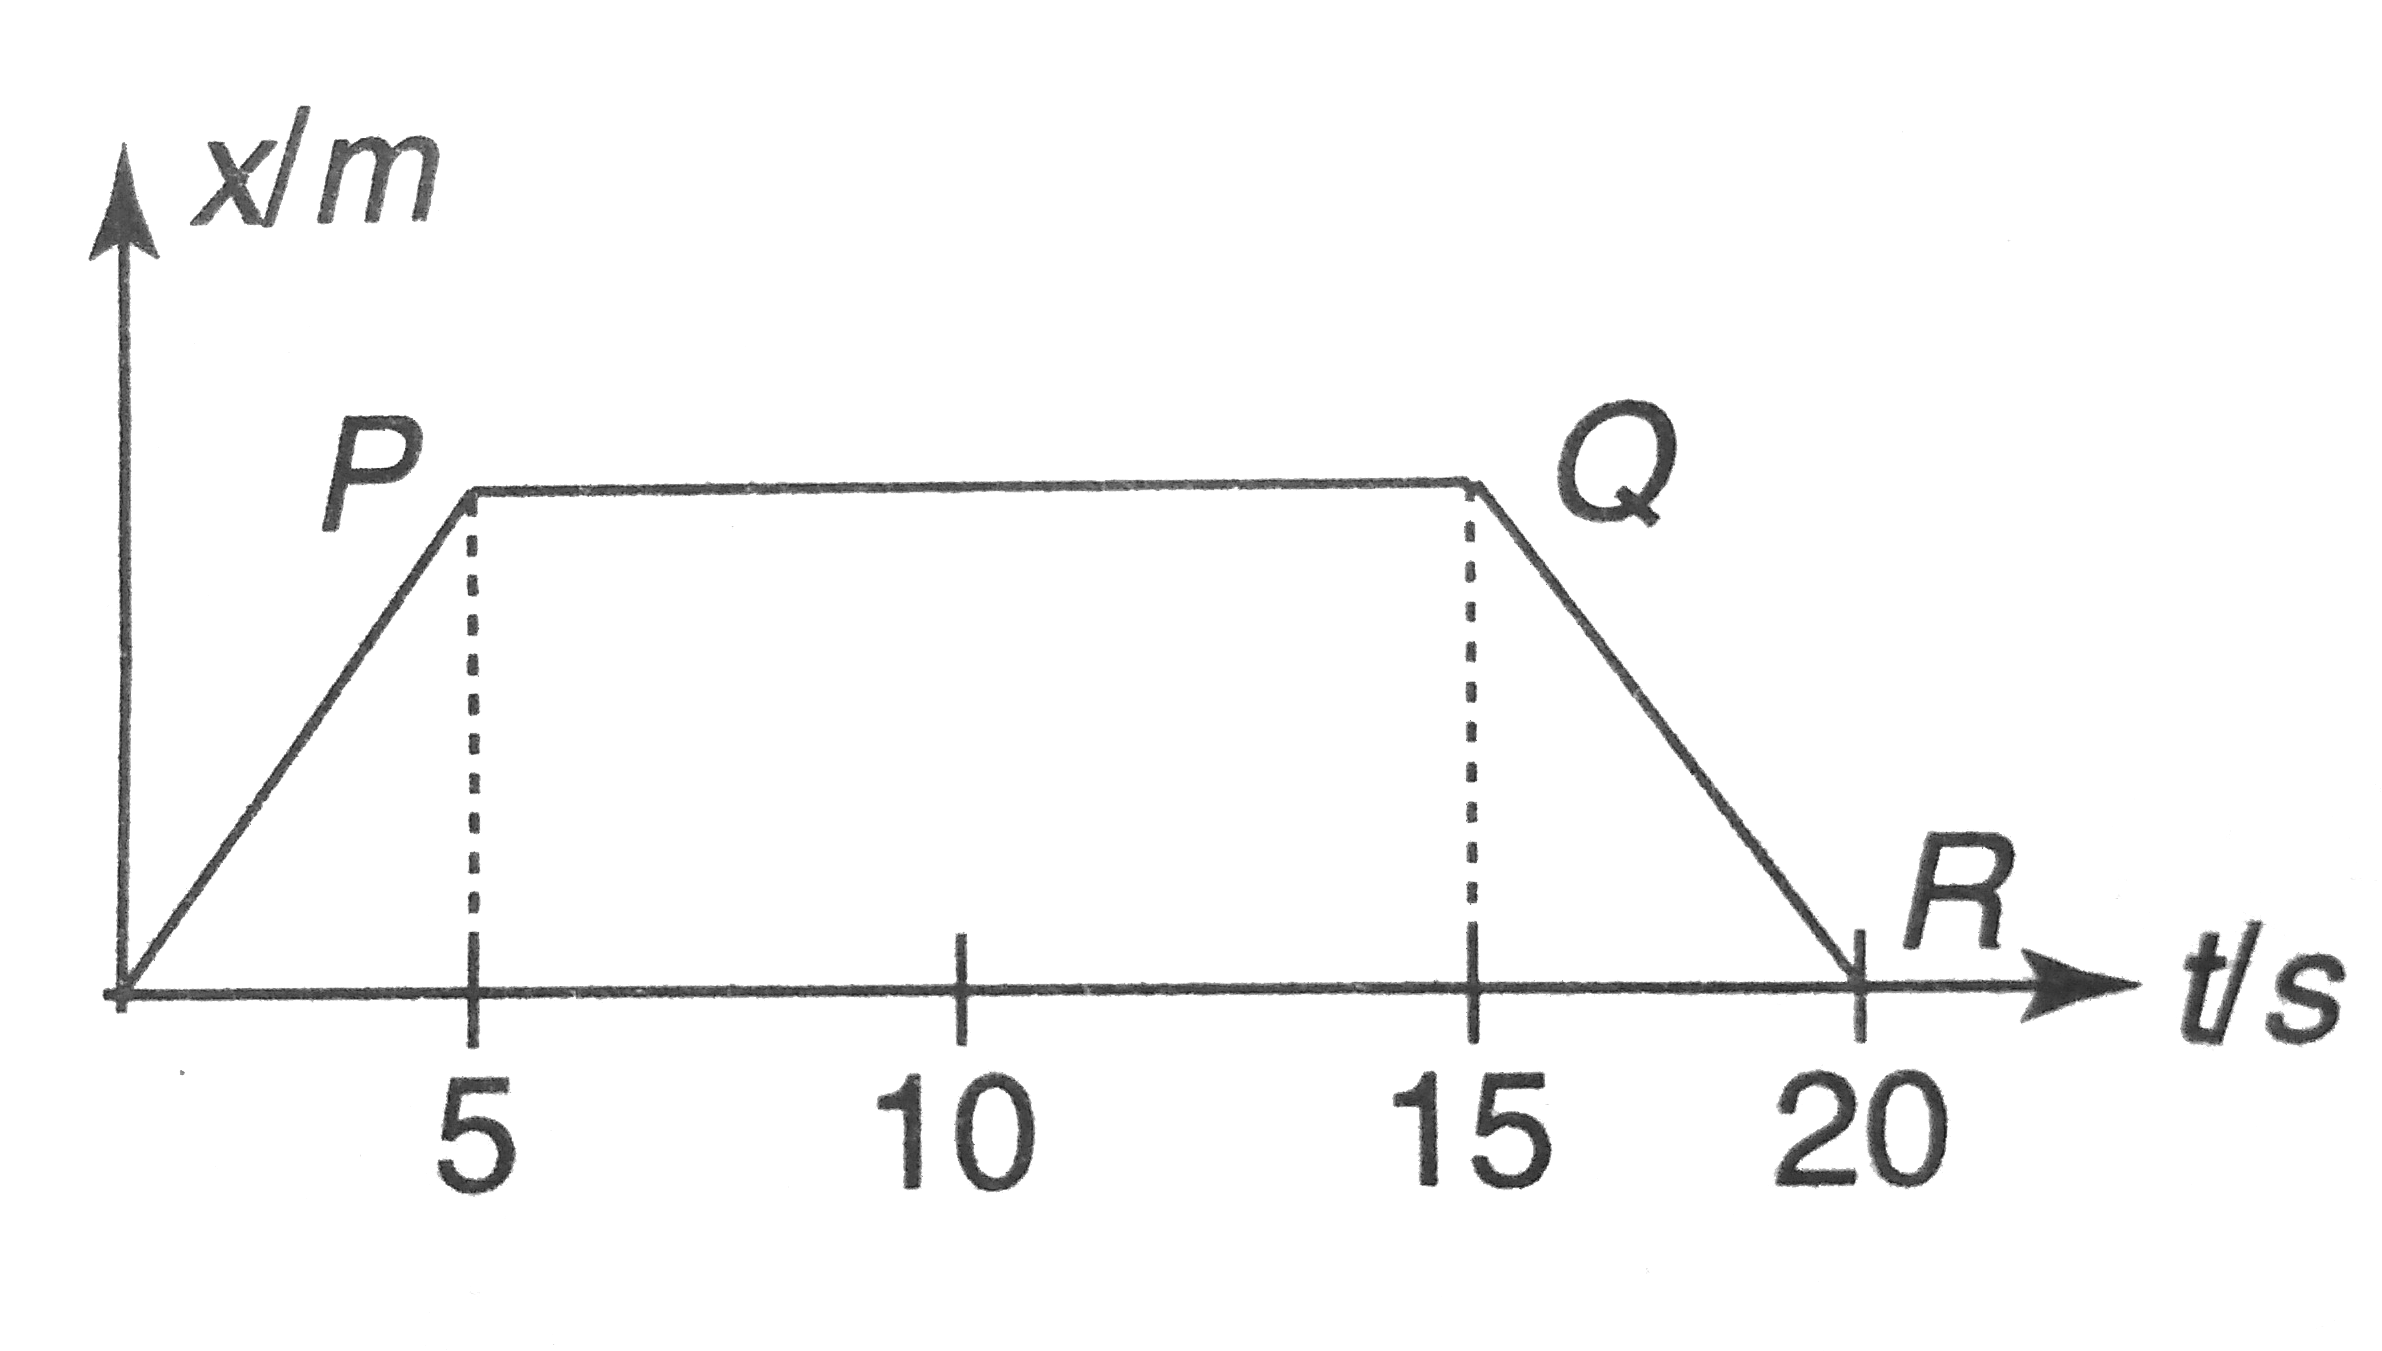
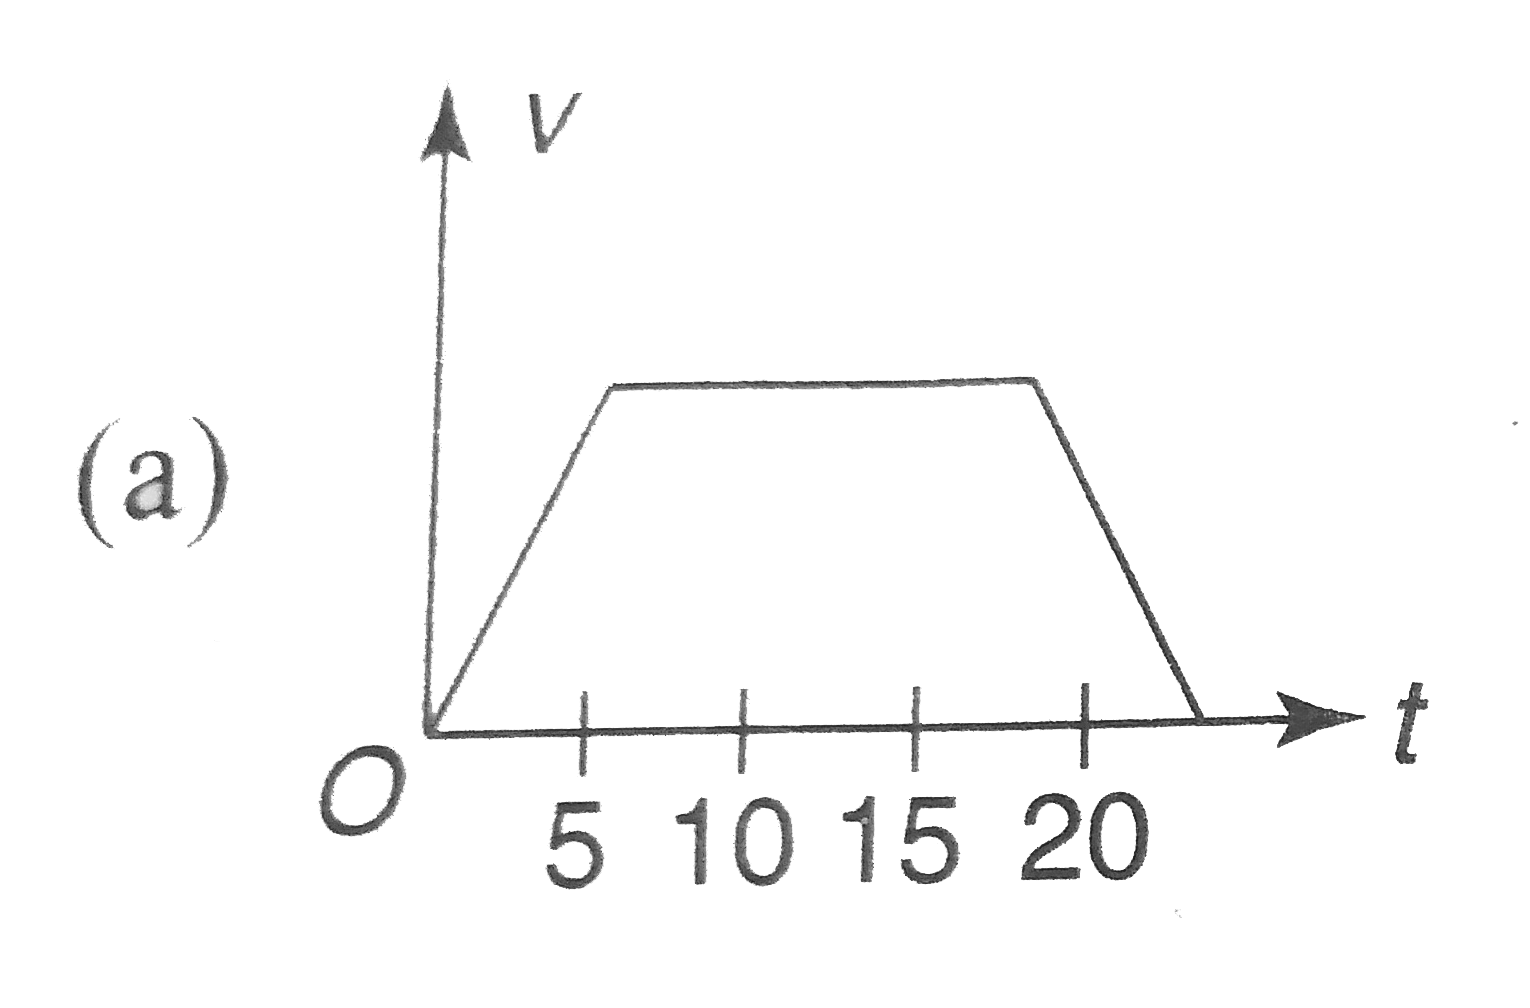
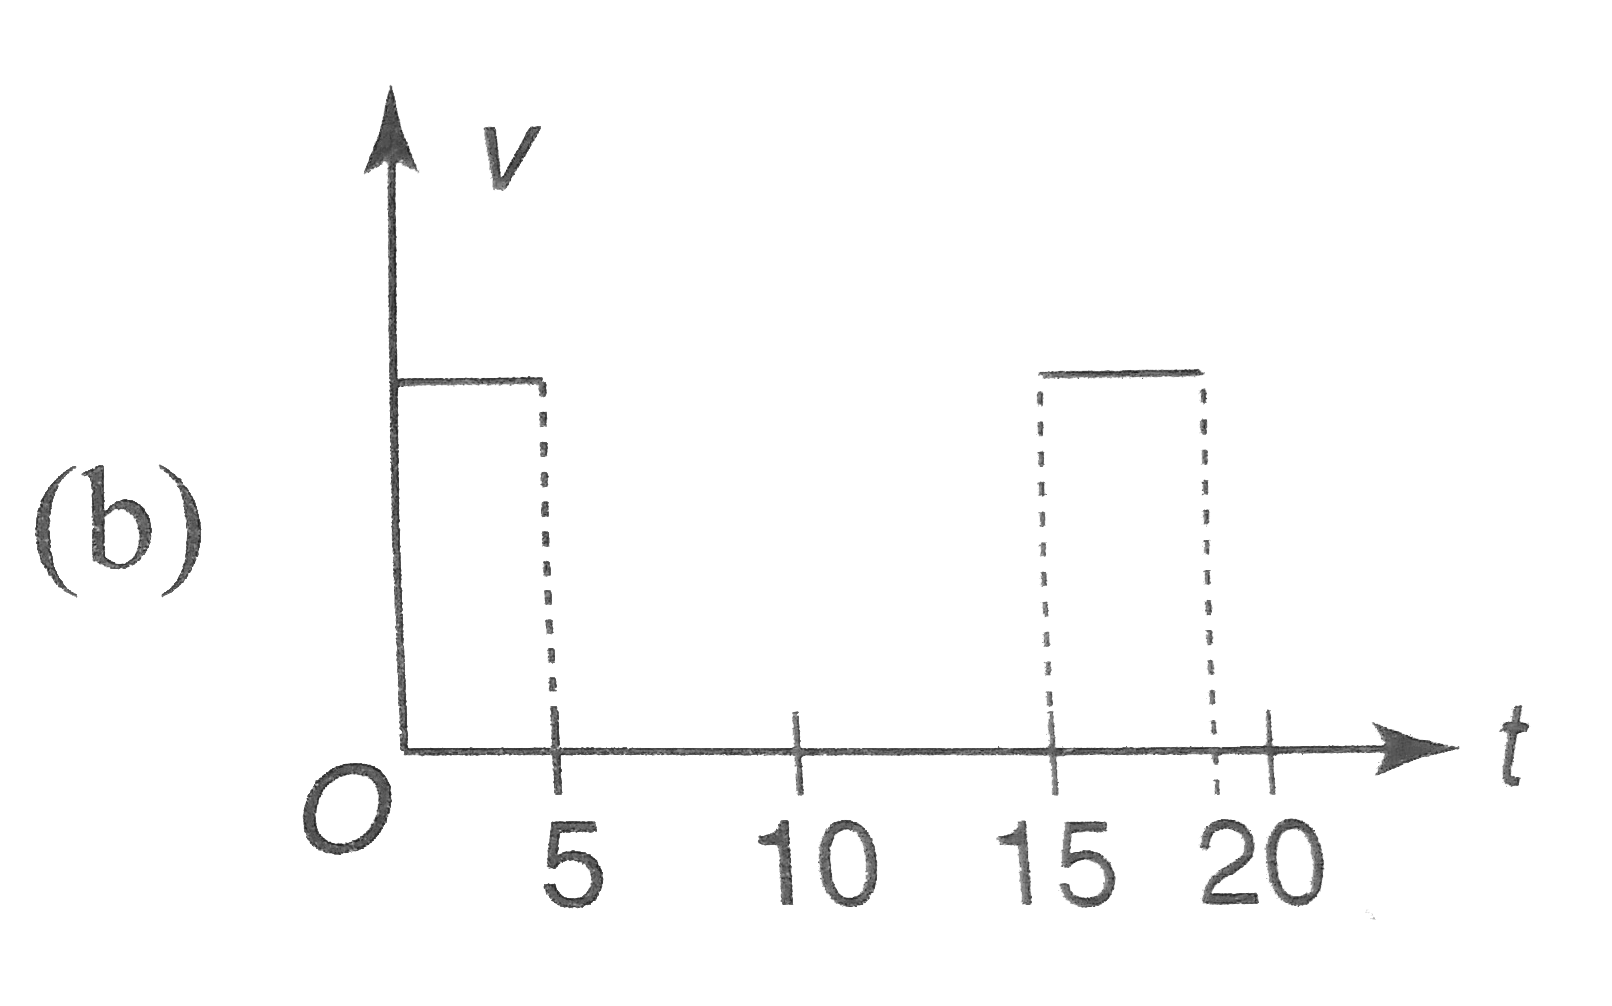
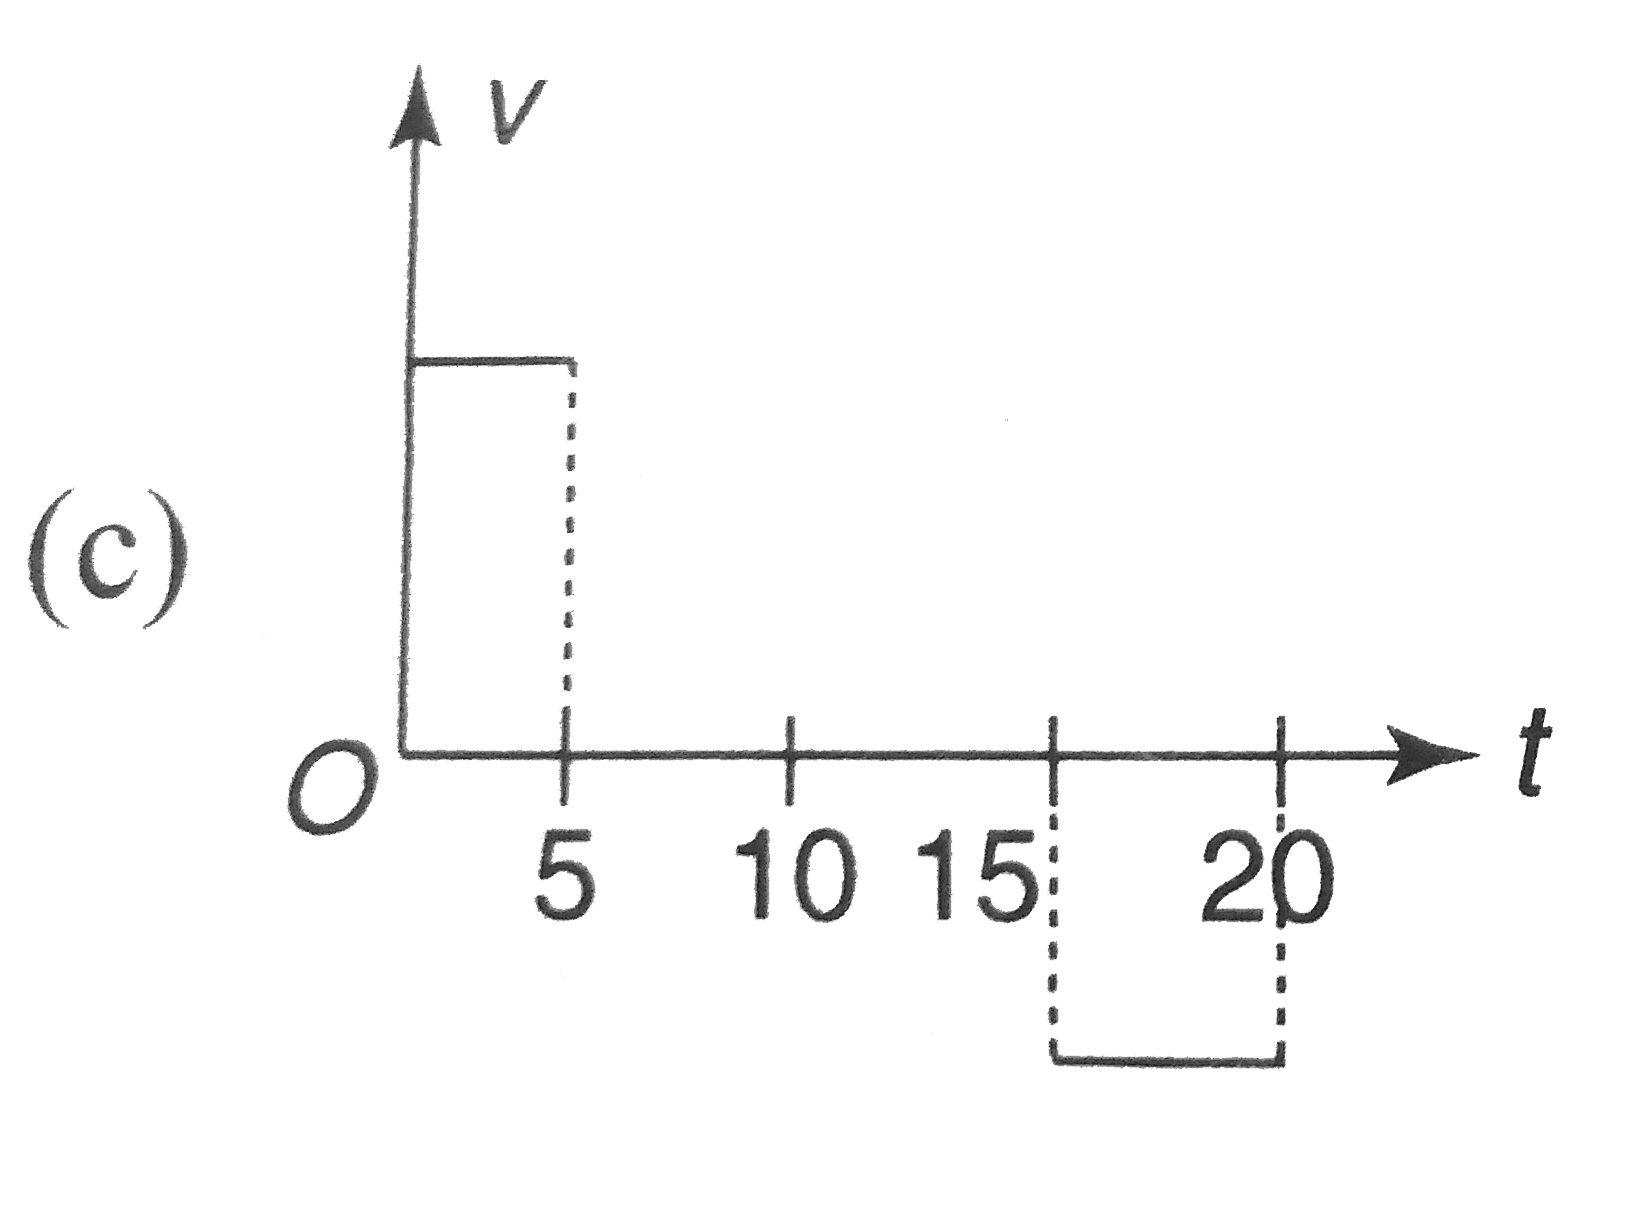
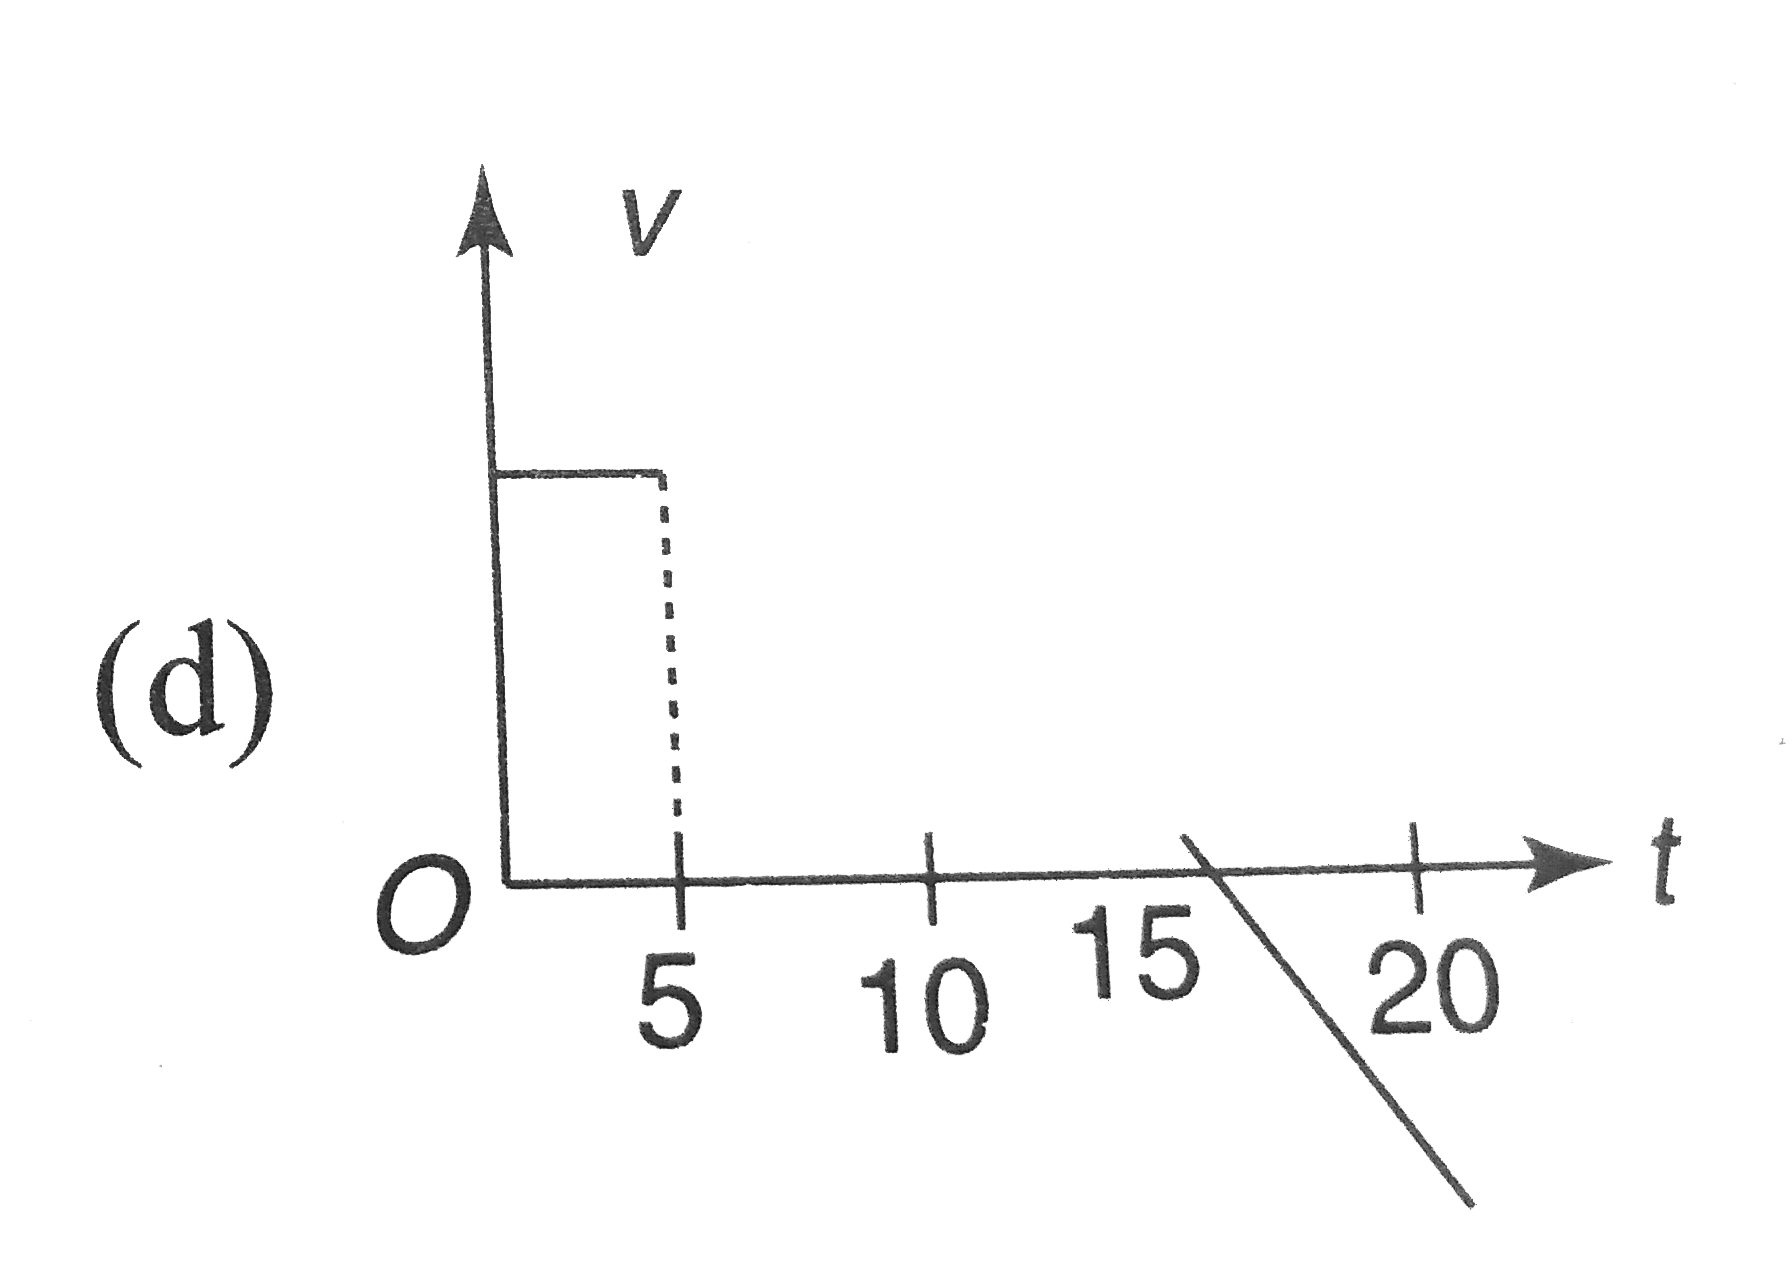
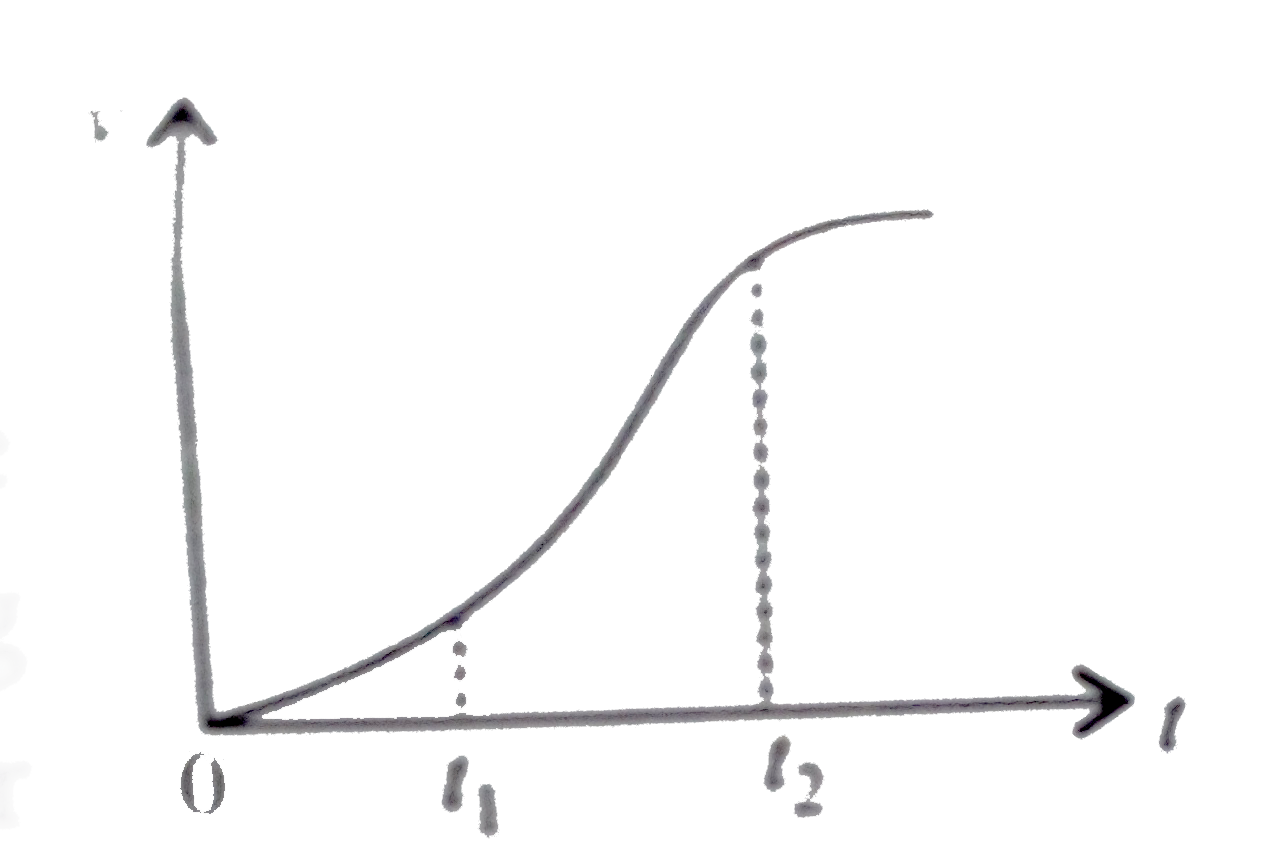
Figure shows the position the graph for a particle in one dimensional motion. Which of the graphs in fugure represent the variation in the velocity of the particle with time ?
 .
.
 .
.
 .
.
 .
.
The correct Answer is:C
Initially slope is positive, so velocity is positive. Then slope is zero, so velocity is zero.
The slope is negative so velocity is negative.
Topper's Solved these Questions
- GENERAL KINEMATICS AND MOTION IN ONE DIMENSIONBOOK - A2ZCHAPTER - GENERAL KINEMATICS AND MOTION IN ONE DIMENSIONEXERCISE - Problem Based On Mixed Concepts
30 Videos
- GENERAL KINEMATICS AND MOTION IN ONE DIMENSIONBOOK - A2ZCHAPTER - GENERAL KINEMATICS AND MOTION IN ONE DIMENSIONEXERCISE - Assertion Reasoning
20 Videos
- GENERAL KINEMATICS AND MOTION IN ONE DIMENSIONBOOK - A2ZCHAPTER - GENERAL KINEMATICS AND MOTION IN ONE DIMENSIONEXERCISE - Relative Motion In One Dimension
20 Videos
- FLUID MECHANICSBOOK - A2ZCHAPTER - FLUID MECHANICSEXERCISE - Chapter Test
29 Videos
- GRAVITATIONBOOK - A2ZCHAPTER - GRAVITATIONEXERCISE - Chapter Test
29 Videos
Similar Questions
Knowledge Check
Figure shows the position time graph for a particle in one dimensional motion. What is the displacement of the particle in first 4 seconds ?
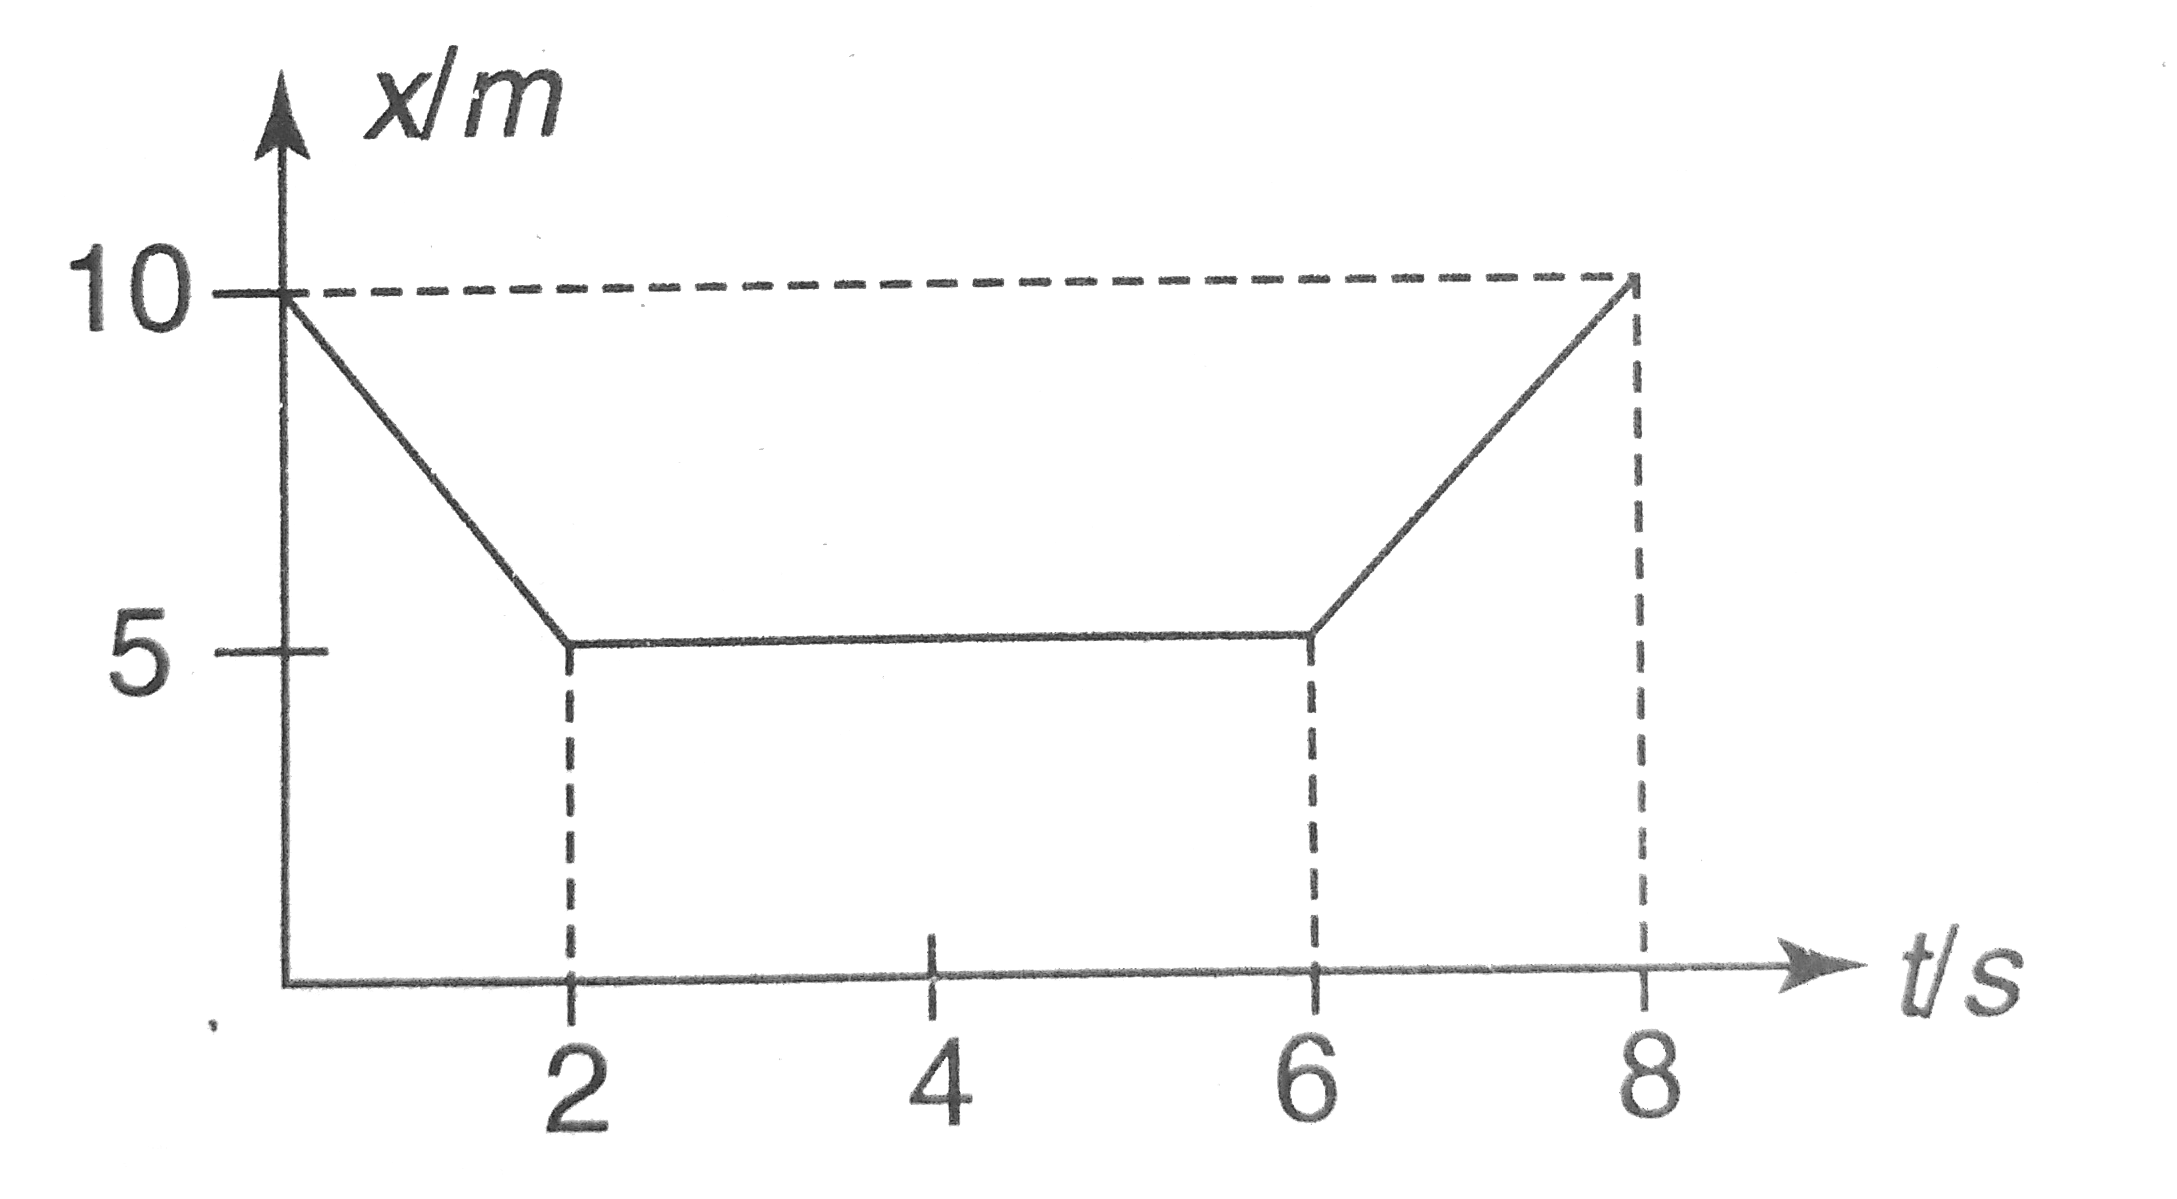 A5 mB−5mCzeroD15 m
Figure shows the position-time graph of a particle moving on the X--axis. Which of these option correctly describes the particle 's motion?
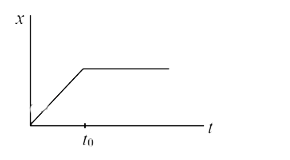 Athe particle is continuously going in positive x directionBthe particle is at restCthe velocity increases up to a time and then becomes constantDthe particle moves at a constant velocity up to a time and then stops
Figure show the displacement - time graph of a particle moving on the x-axis
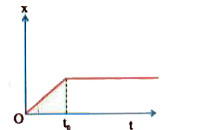 Athe particle is continuously going in positive X directionBthe particle is at restCthe velocity increases up to a time t0 and then becomes constant.Dthe particle moves at constant velocity up to a time t0 and then stops.
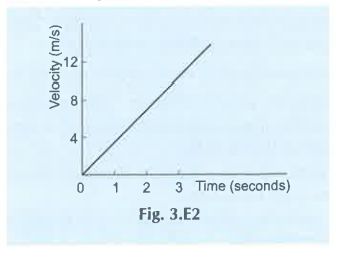
Figure 3.E2 shows the velocity -time graph for a particle moving in a fixed direction. Find the acceleration of the particle.
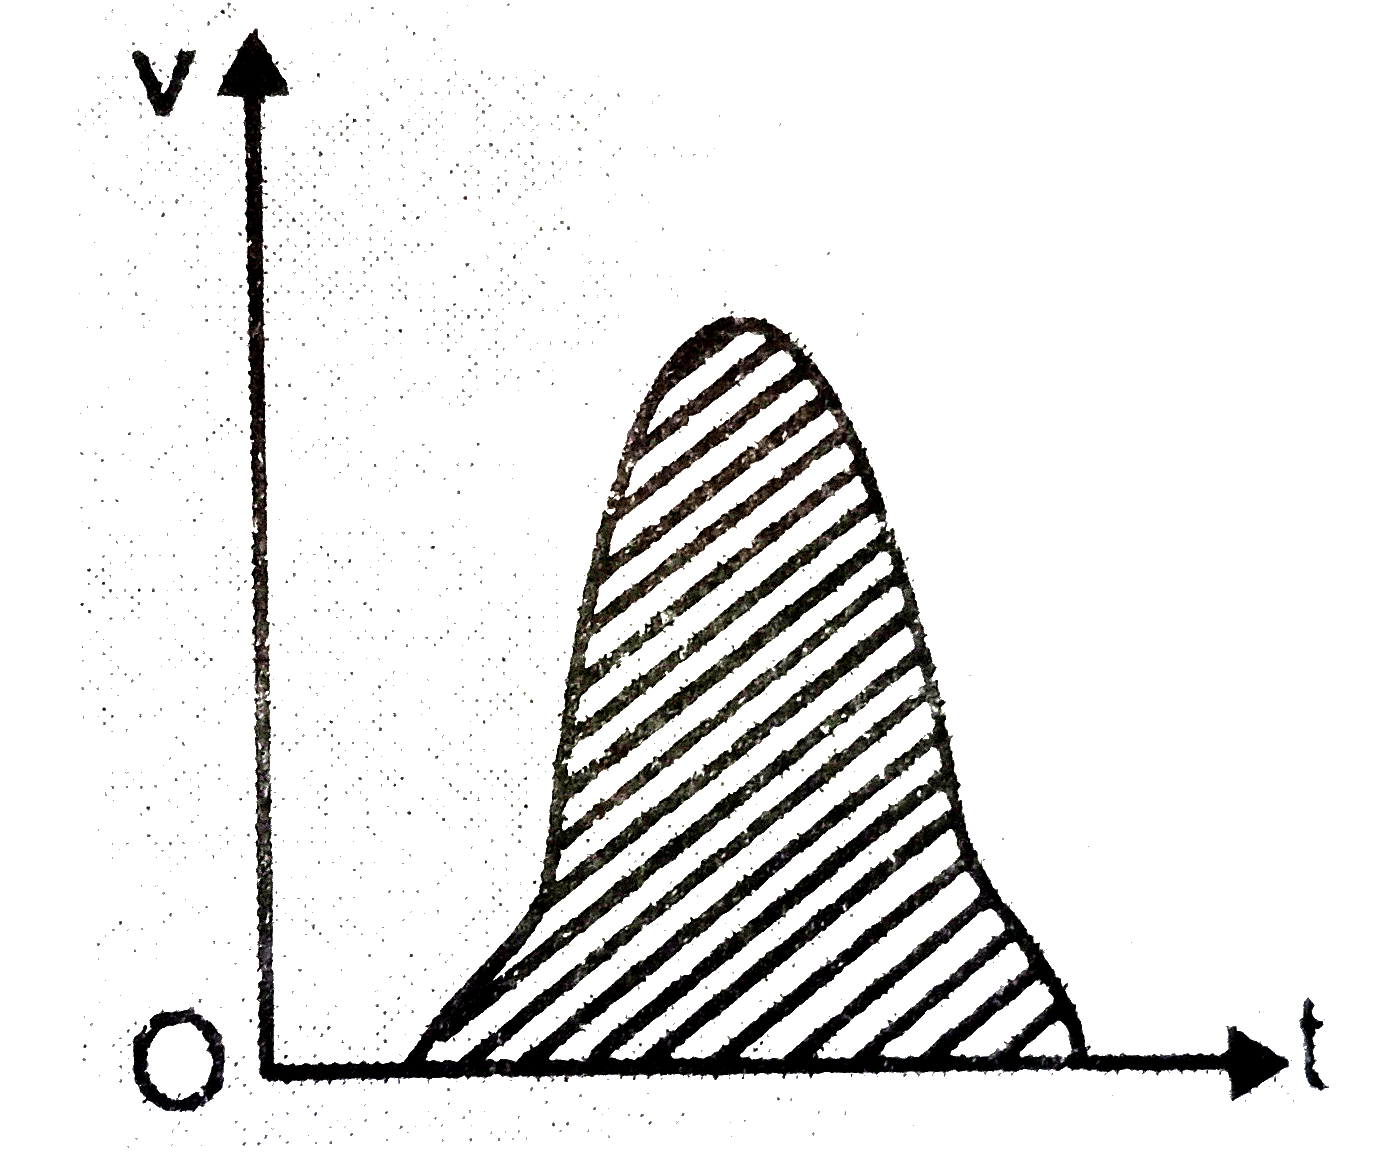
View SolutionFigure below shows the velocity-time graph of a one dimensional motion. Which of the following characteristic of the particle is represented by the shaded area?
View SolutionWhich of the following graphs cannot represent one dimensional motion of a particle?
View SolutionThe velocity-time graph of a particle in one-dimensional motion is shown in the figure. Which of the following formulae is correct for describing the motion of the particle over the time interval t1 to t2?
View SolutionThe velocity -displacement graph of a particle is as shown in the figure. Which of the following graphs correctly represents the variation of acceleration with displacement?

View Solution
