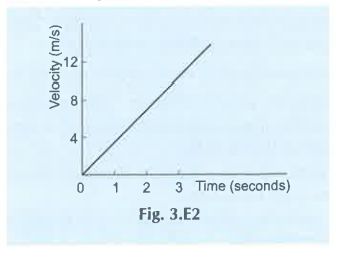
Figure 3.E2 shows the velocity -time graph for a particle moving in a fixed direction. Find the acceleration of the particle.
Text Solution
4m/s2
|
Topper's Solved these Questions
Similar Questions
Knowledge Check
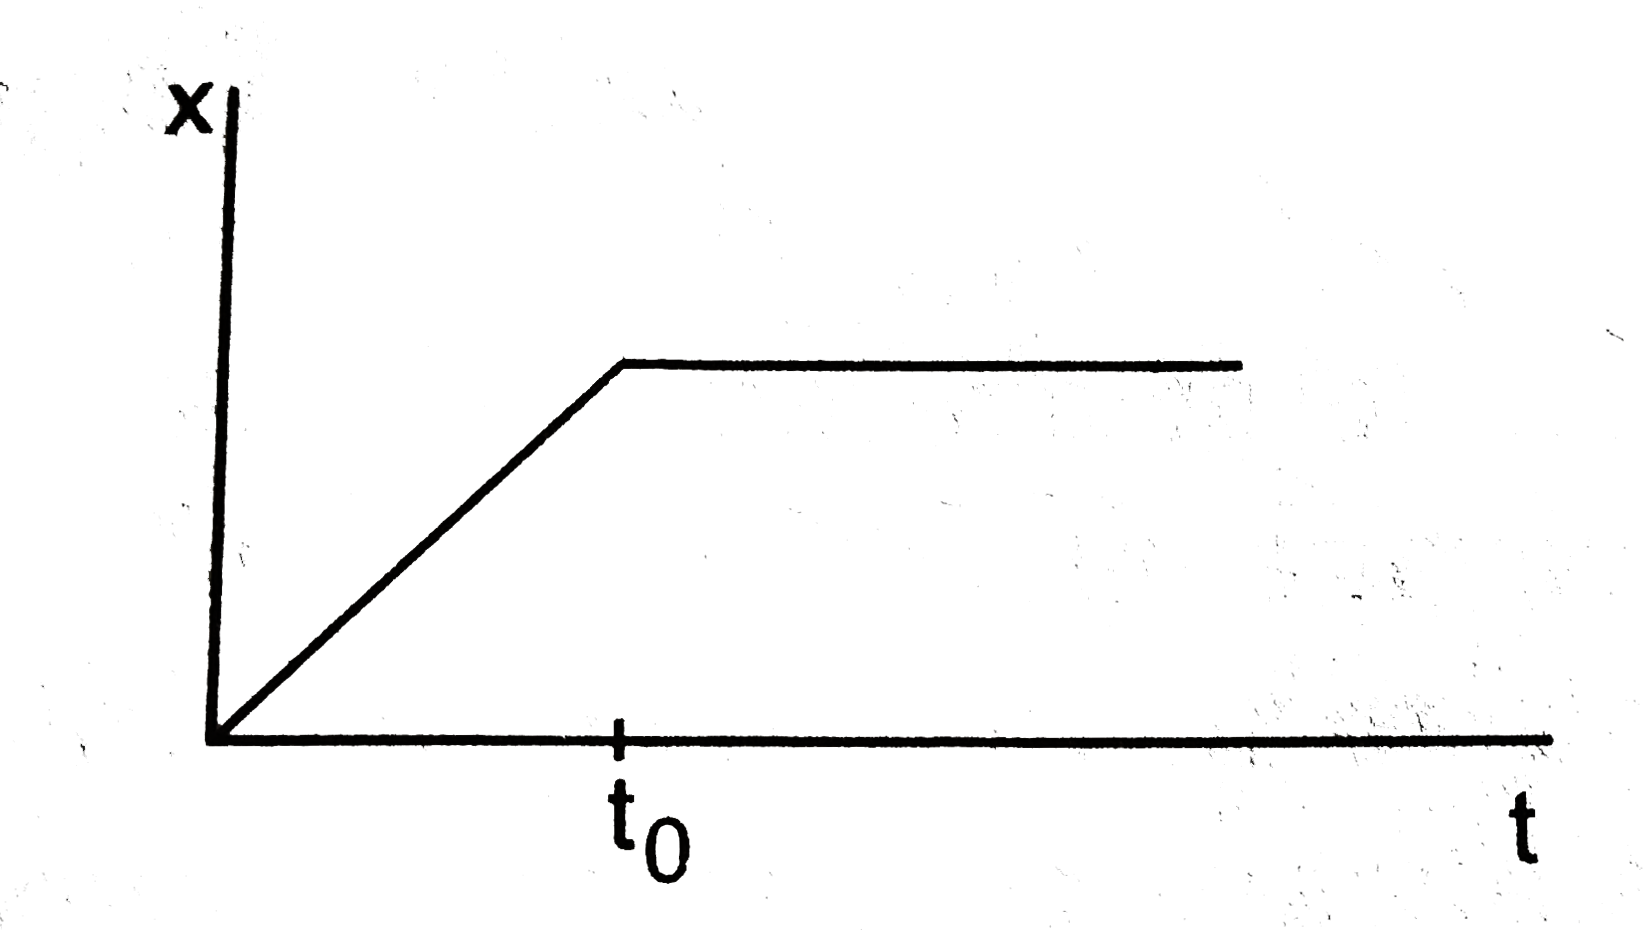
Figure show the displacement - time graph of a particle moving on the x-axis
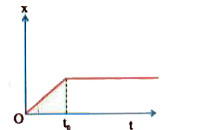 Athe particle is continuously going in positive X directionBthe particle is at restCthe velocity increases up to a time t0 and then becomes constant.Dthe particle moves at constant velocity up to a time t0 and then stops.
The velocity -time (v−t) graph of a particle moving in a straight line is shown in figure. The acceleration of the particle at t=9 is:
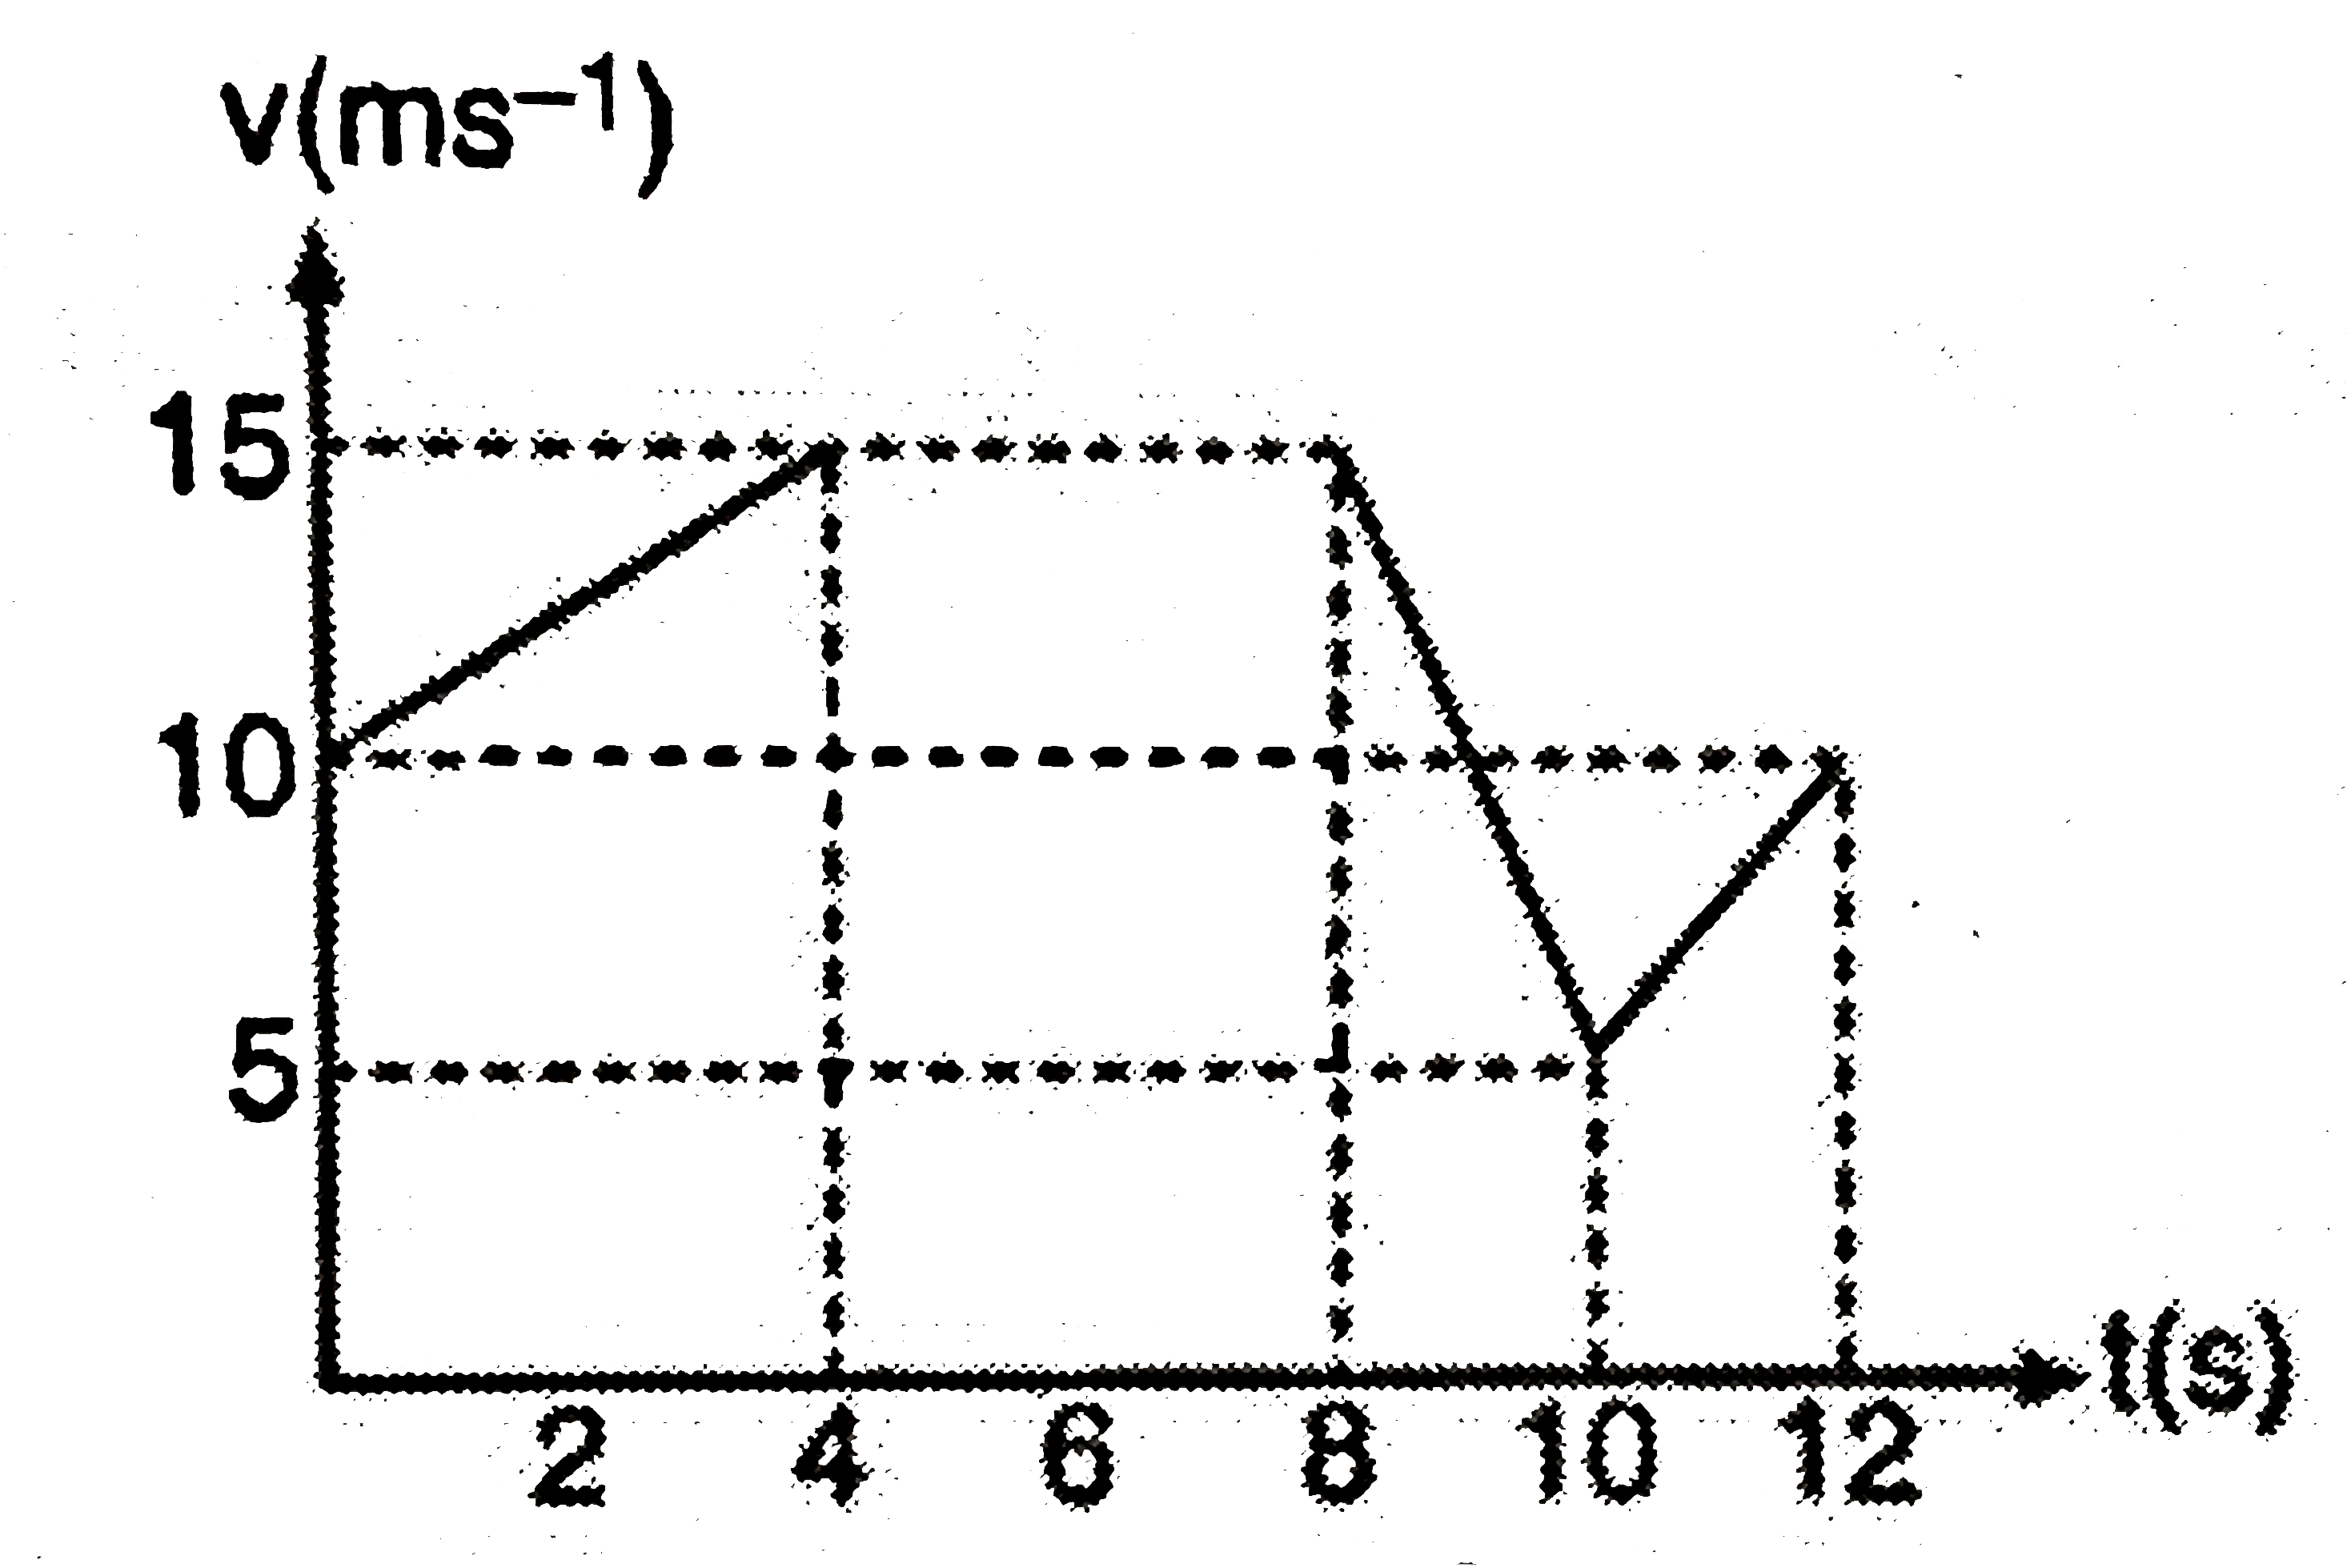 AzeroB5ms−2C−5ms2D−2ms−2
The figure shows a velocity-time graph of a particle moving along a straight line
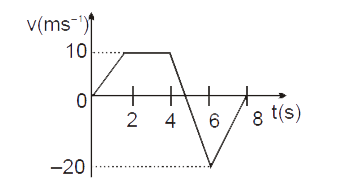
The maximum of displacement of the particle isA33.3 mB23.3 mC18.3Dzero
Figure shows the displacement-time graph of a particle moving on the X-axis
View SolutionThe velocity-time graph of a moving particle is given below. The acceleration of the particle at t = 5 s will be
View SolutionThe figure shows a velocity-time graph of a particle moving along a straight line
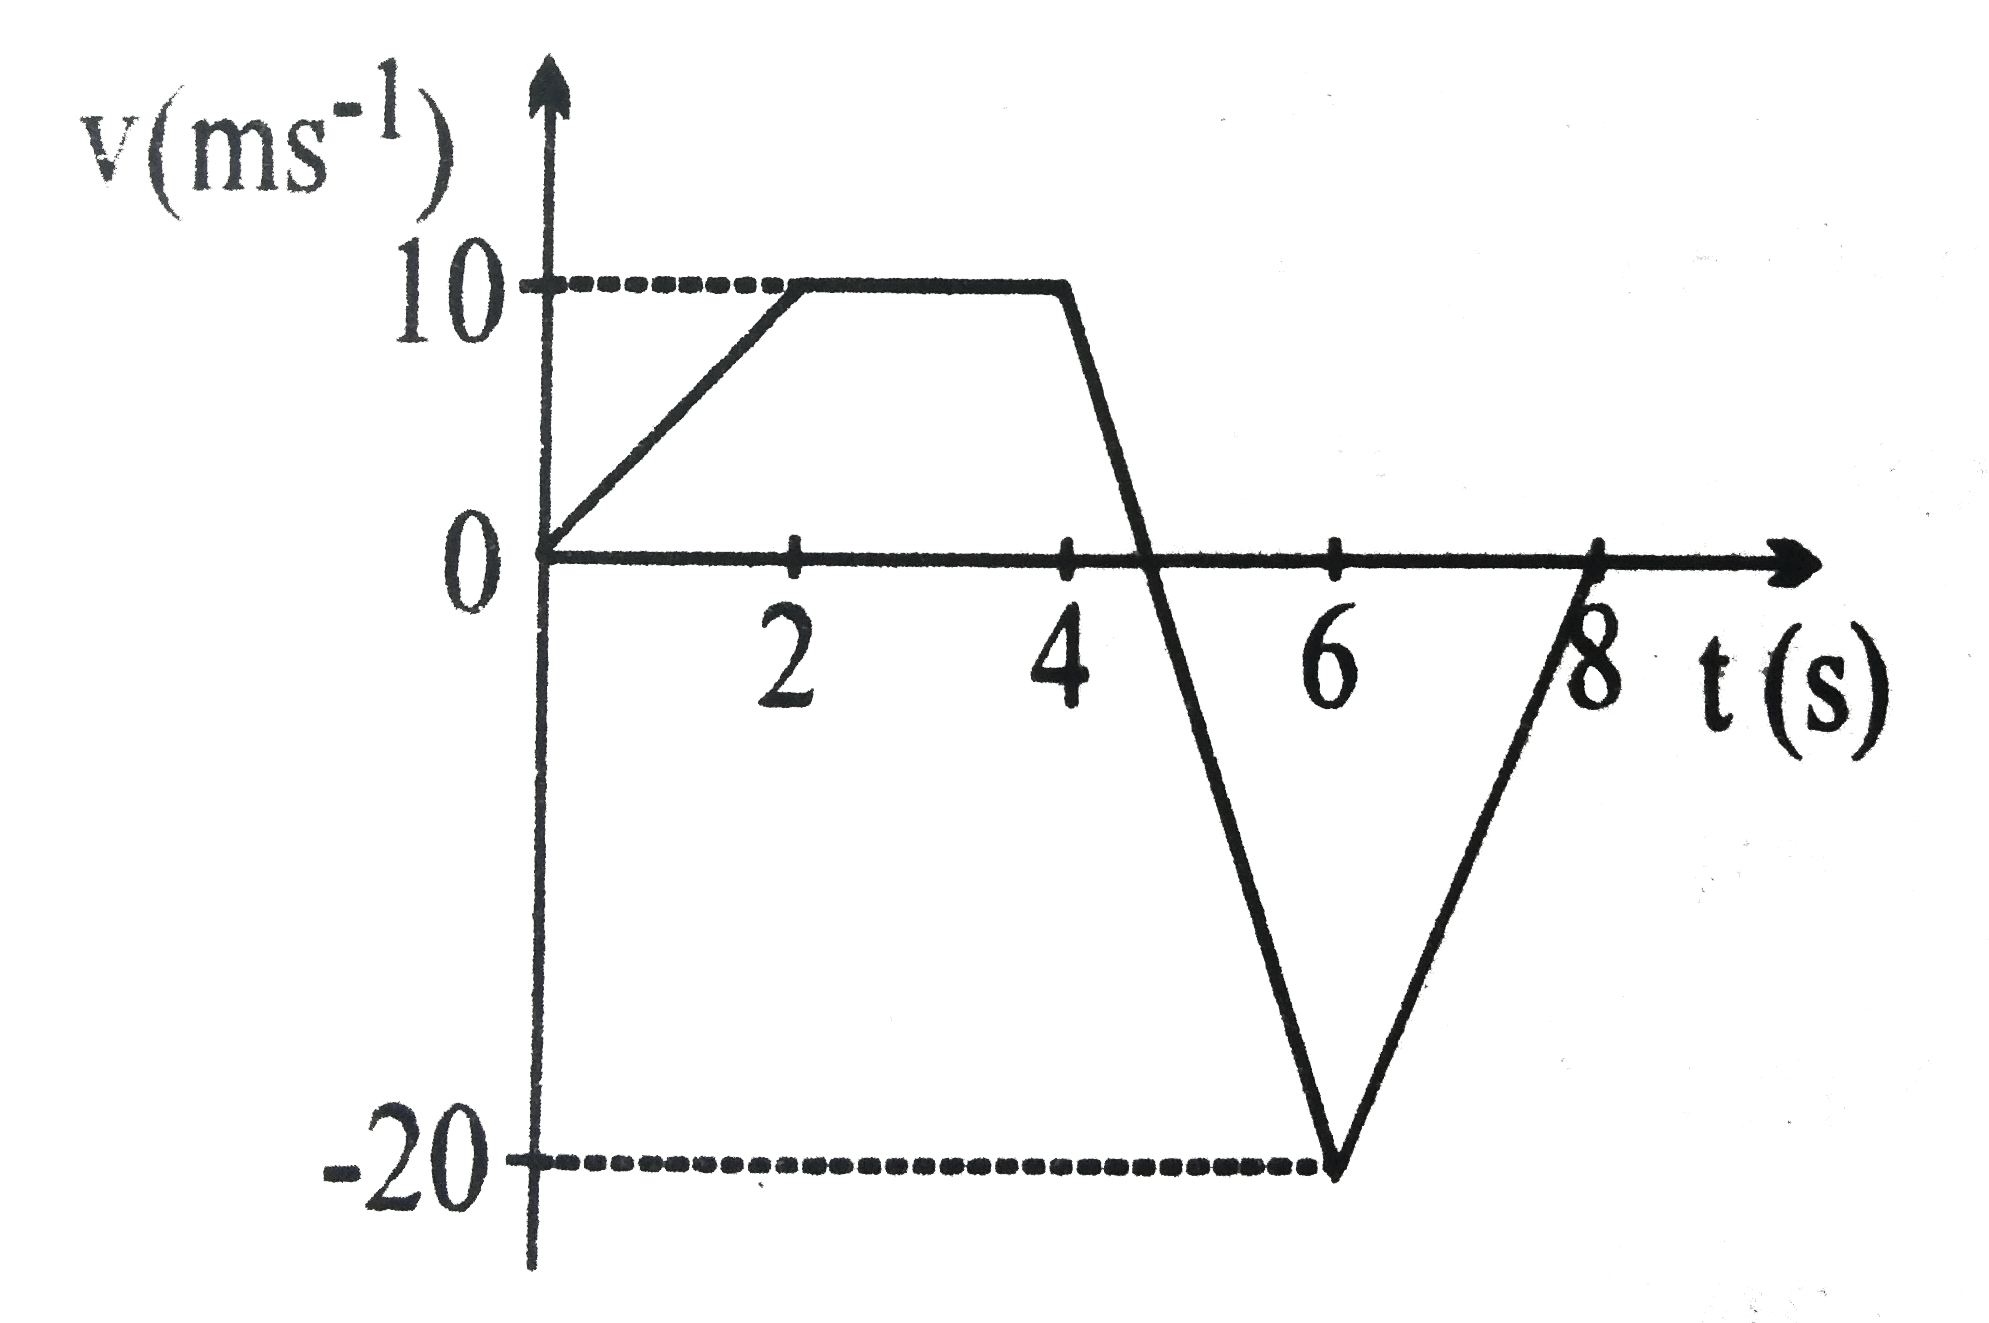
The maximum displacement of the particle is
View SolutionThe figure shows a velocity-time graph of a particle moving along a straight line
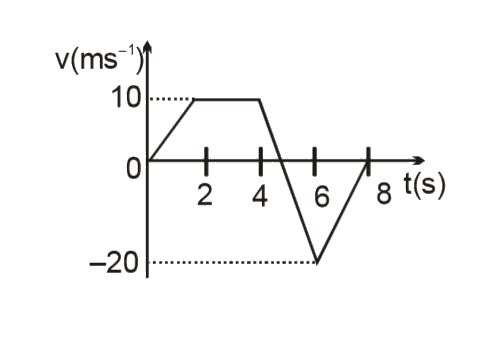
Q. The maximum of displacement of the particle is
View SolutionThe figure shows a velocity-time graph of a particle moving along a straight line
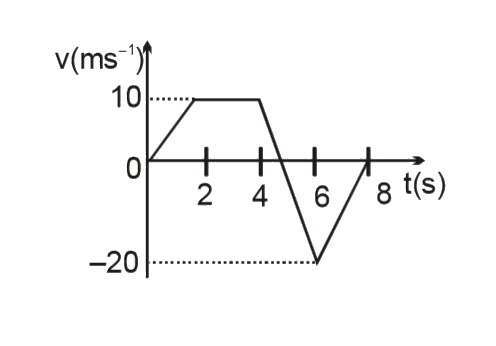
Q. The total distance travelled by the particle is
View Solution
