From athe velocity time graph, given in of a particle moving in a straight line, one can conclude that
 .
.
Its average velocity during the 12s interval is 24/7ms−1.
Its velocity for the first 3s is uniform and is eual to 4ms−1.
The body has a constant acceleration between t=3s and t=8s.
The body has a uniform retardation from t=8s to t=12s.
The correct Answer is:D
Displacemeant in 12s =Area undr v−t groph
=12×(12+5)4=34m
Vav=DesplacementTime=3412=176ms−1
Hence, (a) is incorrect, (b) is incorrect because during first 3s, velocity increases from= to 4ms−1 option, (c ) is incorrect, because in part AB velocity is constant.
Topper's Solved these Questions
- KINEMATICS-1BOOK - CENGAGE PHYSICS ENGLISHCHAPTER - KINEMATICS-1EXERCISE - Graphical cancept
1 Videos
- KINEMATICS-1BOOK - CENGAGE PHYSICS ENGLISHCHAPTER - KINEMATICS-1EXERCISE - Multiple Correct
16 Videos
- KINEMATICS-1BOOK - CENGAGE PHYSICS ENGLISHCHAPTER - KINEMATICS-1EXERCISE - Single Correct
52 Videos
- GRAVITATIONBOOK - CENGAGE PHYSICS ENGLISHCHAPTER - GRAVITATIONEXERCISE - INTEGER_TYPE
1 Videos
- KINEMATICS-2BOOK - CENGAGE PHYSICS ENGLISHCHAPTER - KINEMATICS-2EXERCISE - Exercise Integer
9 Videos
Similar Questions
Velocity displacement graph of a particle moving in a straight line is as shown in figure.

View SolutionDisplacement time graph of a particle moving in a straight line is a shown in figure.

View SolutionThe velocity time plot for a particle moving on straight line is shown in the figure.

View SolutionThe velocity time plot for a particle moving on straight line is shown in the figure.

View SolutionThe velocity time graph of a particle moving in a straight line is given line is given in the figure. Then starting from t=0, the particle
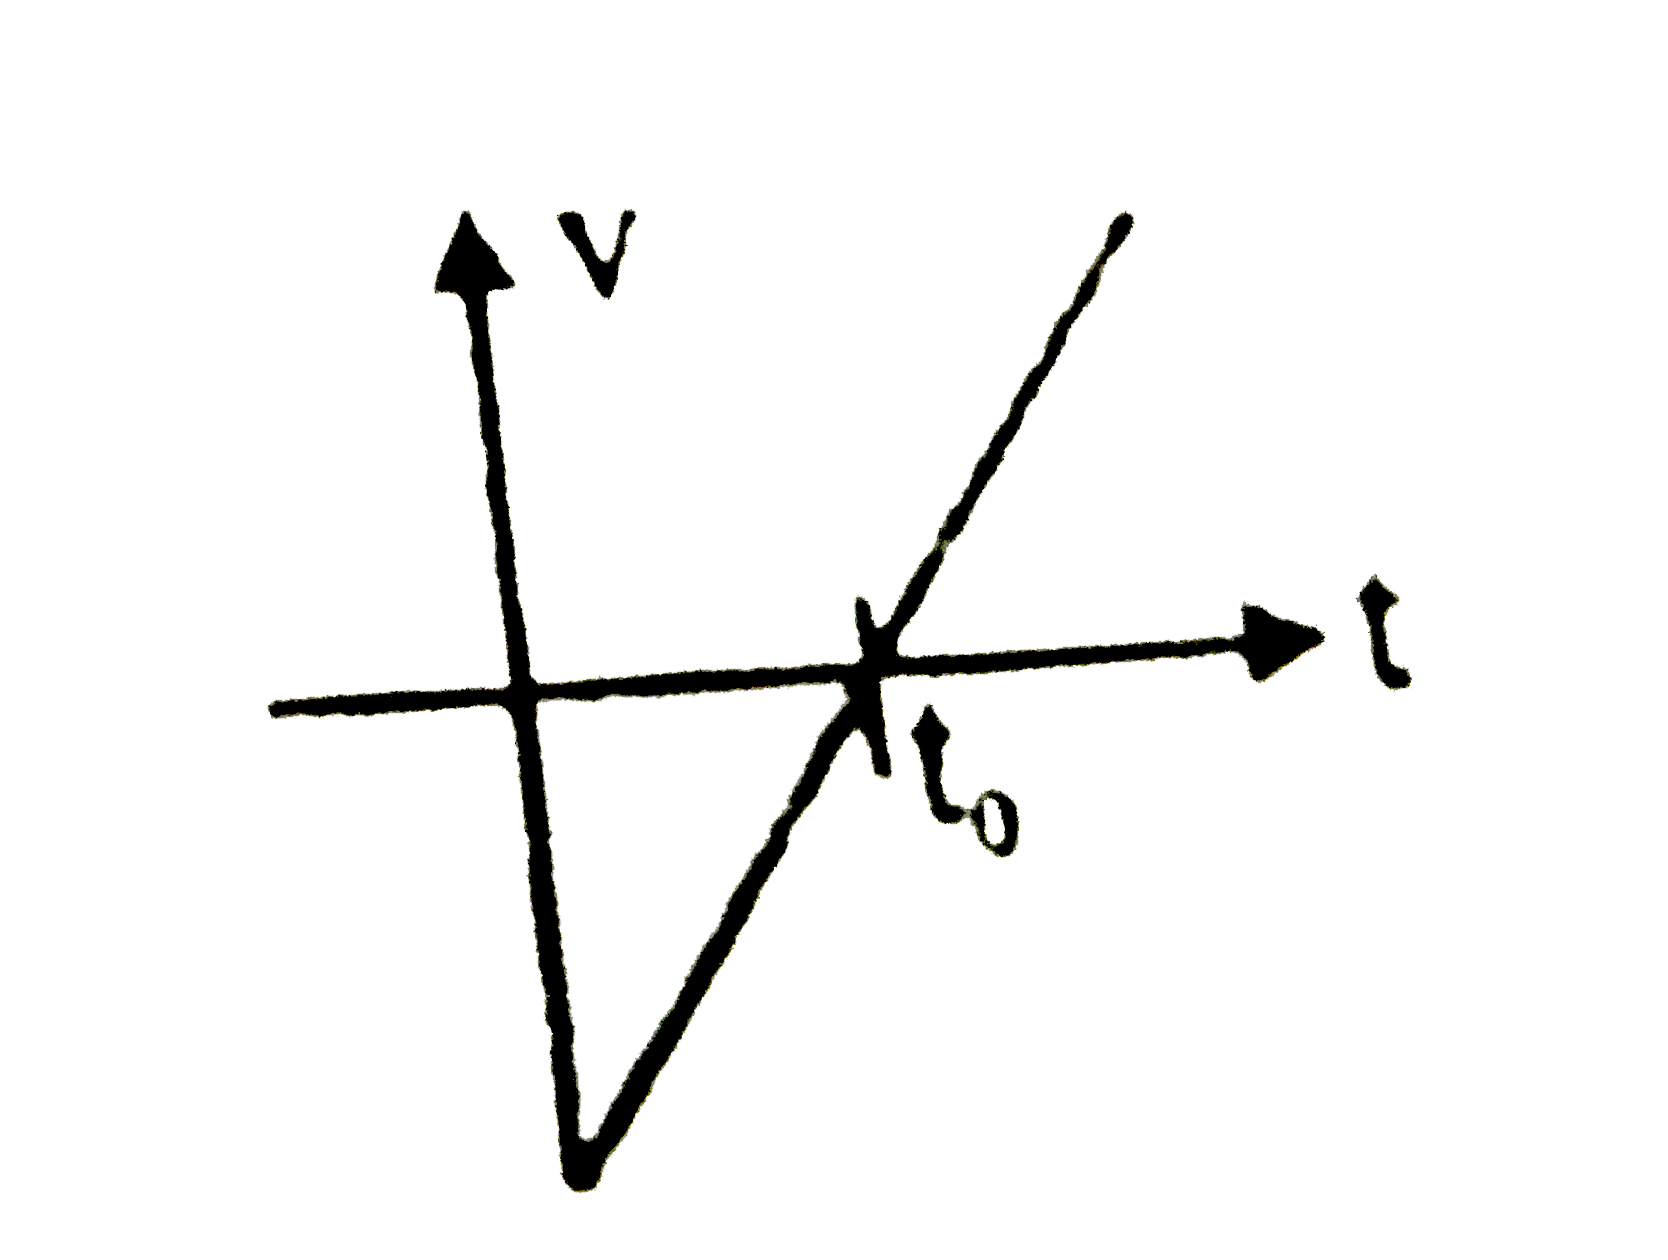
View SolutionThe figure shows velocity-time graph of a particle moving along a straight line. Identify the correct statement.
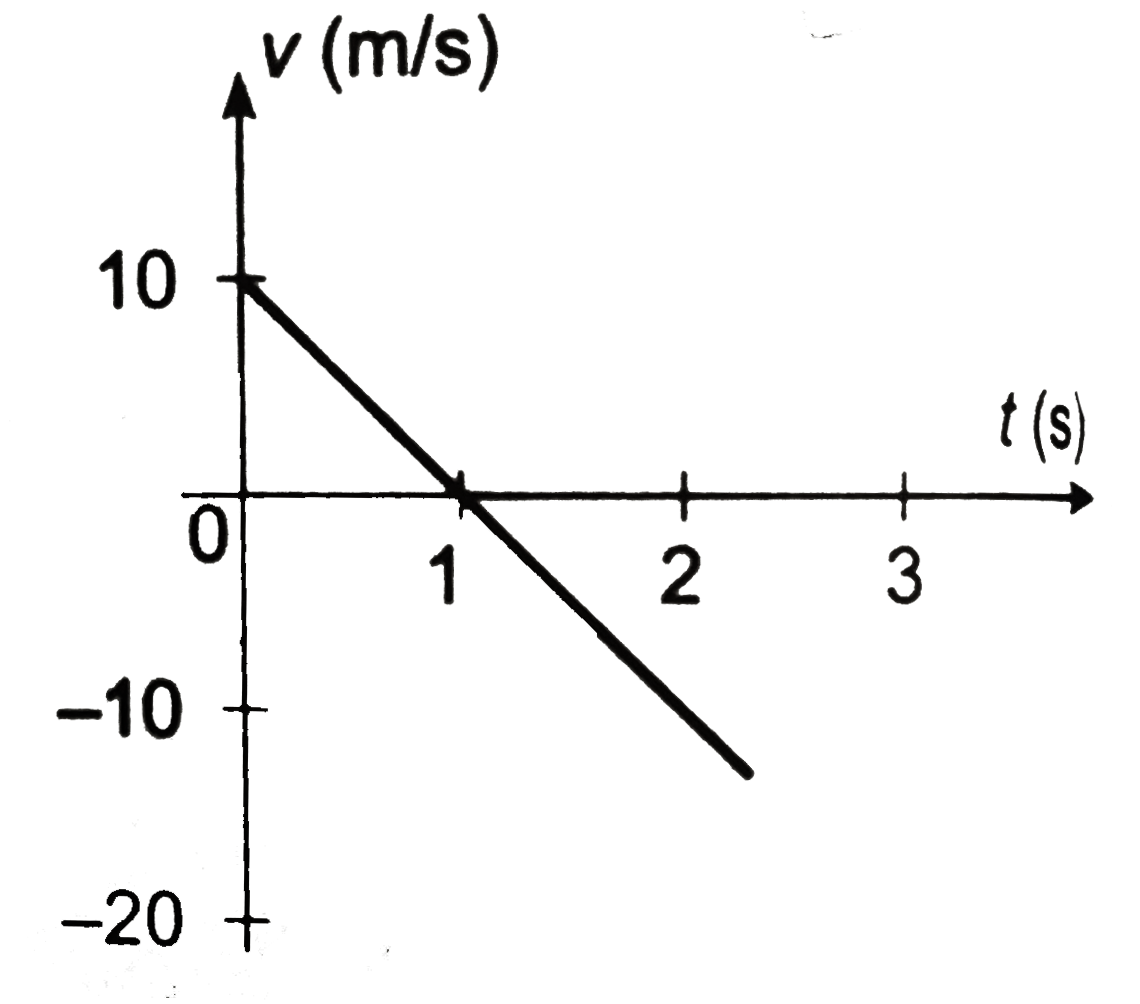
View SolutionThe velocity and time graph for a particle moving in a straight line s shown in the figure. Then, the average velocity between t=4 s and t=6 s is _____
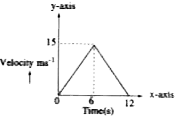
View SolutionFigure shows the velocity time graph of a particle moving along straight line (v is m/s and t is in second). It average velocity in 20 seconds will be:
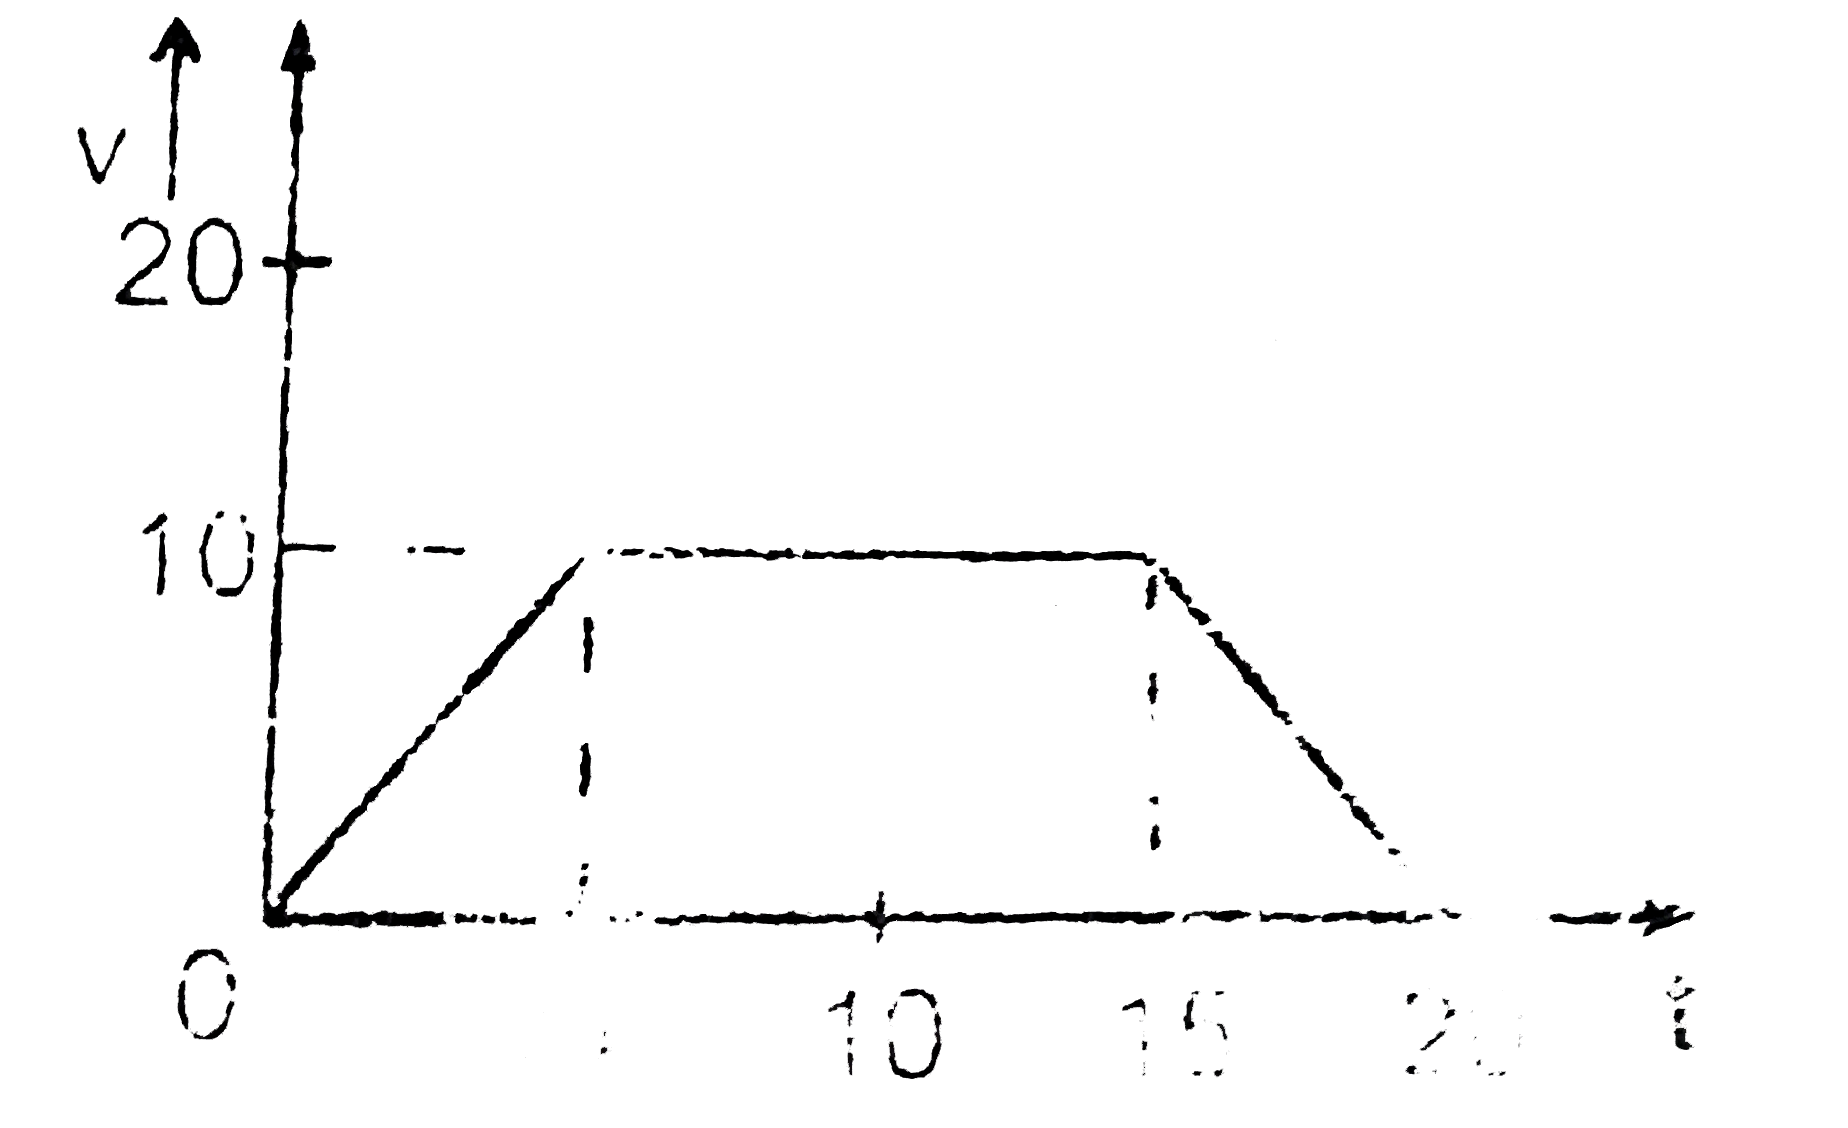 .
.
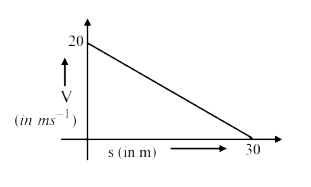
View SolutionThe velocity –position graph of a particle moving along a straight line is shown. Then acceleration of the particle at s = 15 m is :
View SolutionThe velocity time graph of a particle moving along a straight line is shown in the figure. In the time interval from t=0 to t=8 second, answer the following three question.
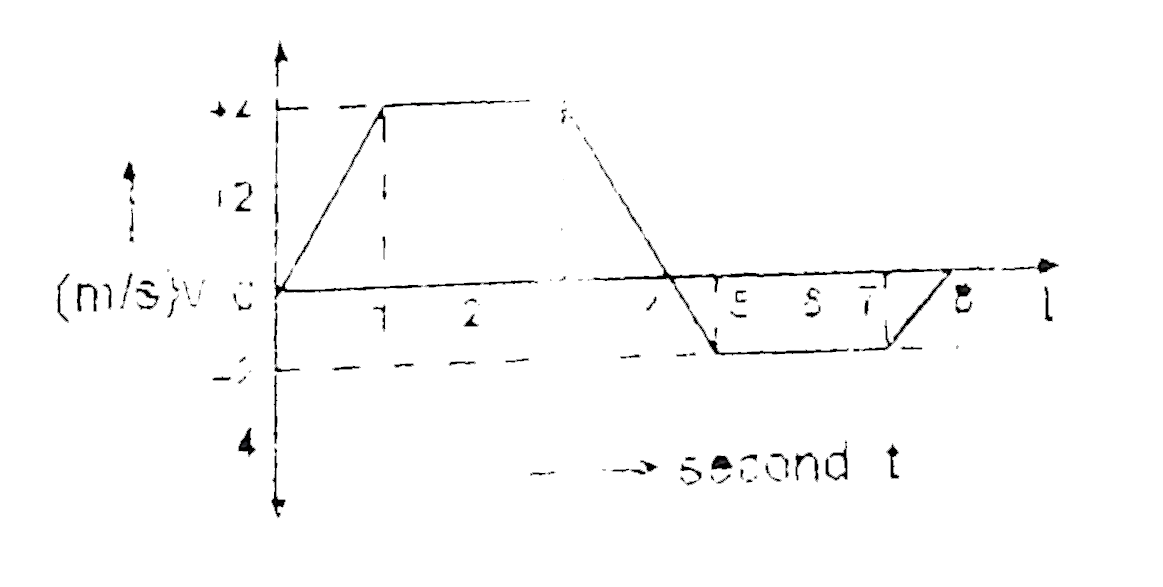
The distance travelled by the particle is :
View Solution
