Graph shows a hypothetical speed distribution for a sample of N gas particle :- (forV>V0,dNdV=0)
_E01_138_Q01.png)
The value of V0 is 2N.
The ratio Vavg/V0 is equal to 2/3.
The ratio Vrms/V0 is equal to 1√2
Three fourth of the total particle has a speed between 0.5V0 and V0.
Step by step video & image solution for Graph shows a hypothetical speed distribution for a sample of N gas particle :- (forVgtV_(0), (dN)/(dV)= 0) by Physics experts to help you in doubts & scoring excellent marks in Class 12 exams.
Updated on:21/07/2023Topper's Solved these Questions
- Kinetic Theory of Gases and Gas LawsBOOK - PHYSICS GALAXY - ASHISH ARORACHAPTER - Kinetic Theory of Gases and Gas LawsEXERCISE - Unsolved Numerical Problems for Preparation of NSEP, INPhO & IPhO
64 Videos
- Kinetic Theory of Gases and Gas LawsBOOK - PHYSICS GALAXY - ASHISH ARORACHAPTER - Kinetic Theory of Gases and Gas LawsEXERCISE - Numerical MCQs Single Options Correct
28 Videos
- HEAT TRANSFER BOOK - PHYSICS GALAXY - ASHISH ARORACHAPTER - HEAT TRANSFER EXERCISE - Unsolved Numerical Problems for Preparation of NSEP,INPhO&IPhO
66 Videos
- MAGNETIC EFFECTS OF CURRENT AND MAGNETISMBOOK - PHYSICS GALAXY - ASHISH ARORACHAPTER - MAGNETIC EFFECTS OF CURRENT AND MAGNETISMEXERCISE - U.N.P
79 Videos
Similar Questions
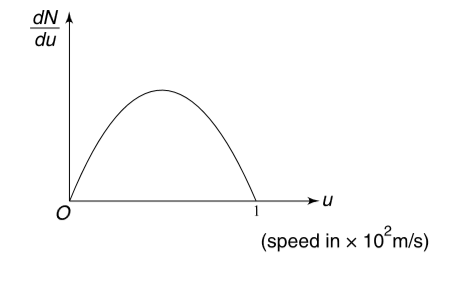
The speed distribution of molecules in a sample of a gas is shown in the figure. The graph between dNdu and u is a parabola and total number of molecules in the sample is N0.
(a) Calculate the rms speed of the molecules.
(b) Calculate the total translational kinetic energy of molecules if mass of the sample is 10 g.
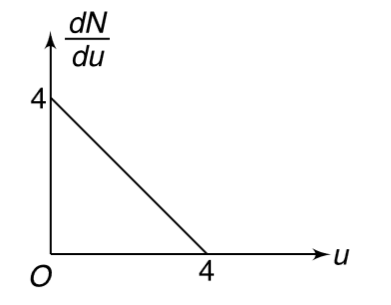
View SolutionA hypothetical gas sample has its molecular speed distribution graph as shown in the figure. The speed (u) and dNdu have appropriate units. Find the root mean square speed of the molecules. Do not worry about units.
View Solution
Knowledge Check
Graph shows a hypothetical speed distribution for a sample of N gas particle (for V>V0,dNdV=0)
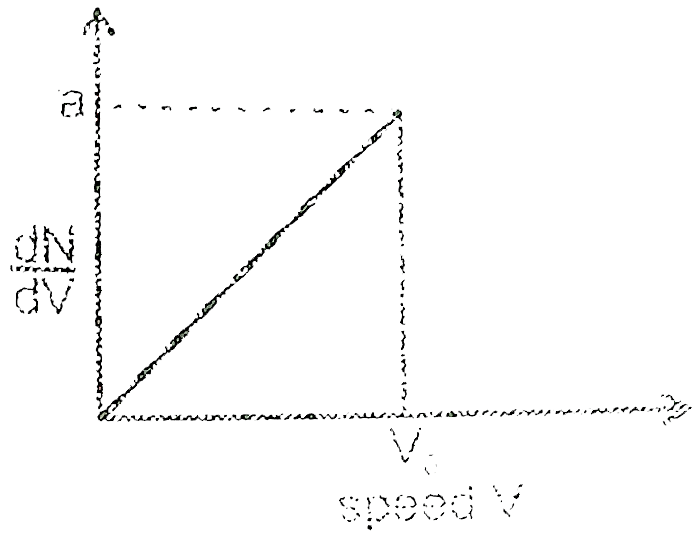 AThe value of V0 is 2NBThe ratio Vavg/V0 is equal to 2/3CThe ratio Vrms/V0 is equal to 1/√2DThree fourth of the total particle has a speed between 0.5V0 and V0.
The given histogram shows the frequency distribution of the speed of cars passing though at a particular spot on a highway. Study the graph and answer the question that follows.
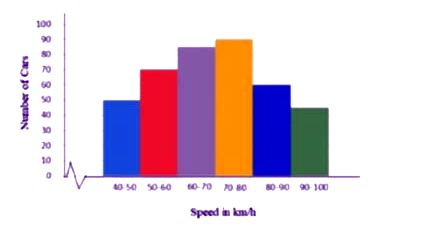
What percentage of cars were running with speed less than 70 km/h?A30%B51.25%C60%D45.75%The given histogram shows the frequency distribution of the speed of cars passing through a particular spot on a highway. Read the graph and answer the following question.
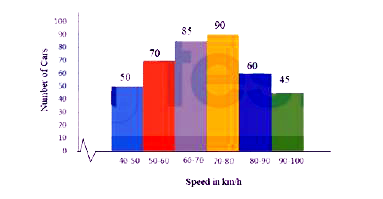
What percentage of cars were running with the speed of 90 km/h and above?A10%B21.25%C11.25%D15.75%
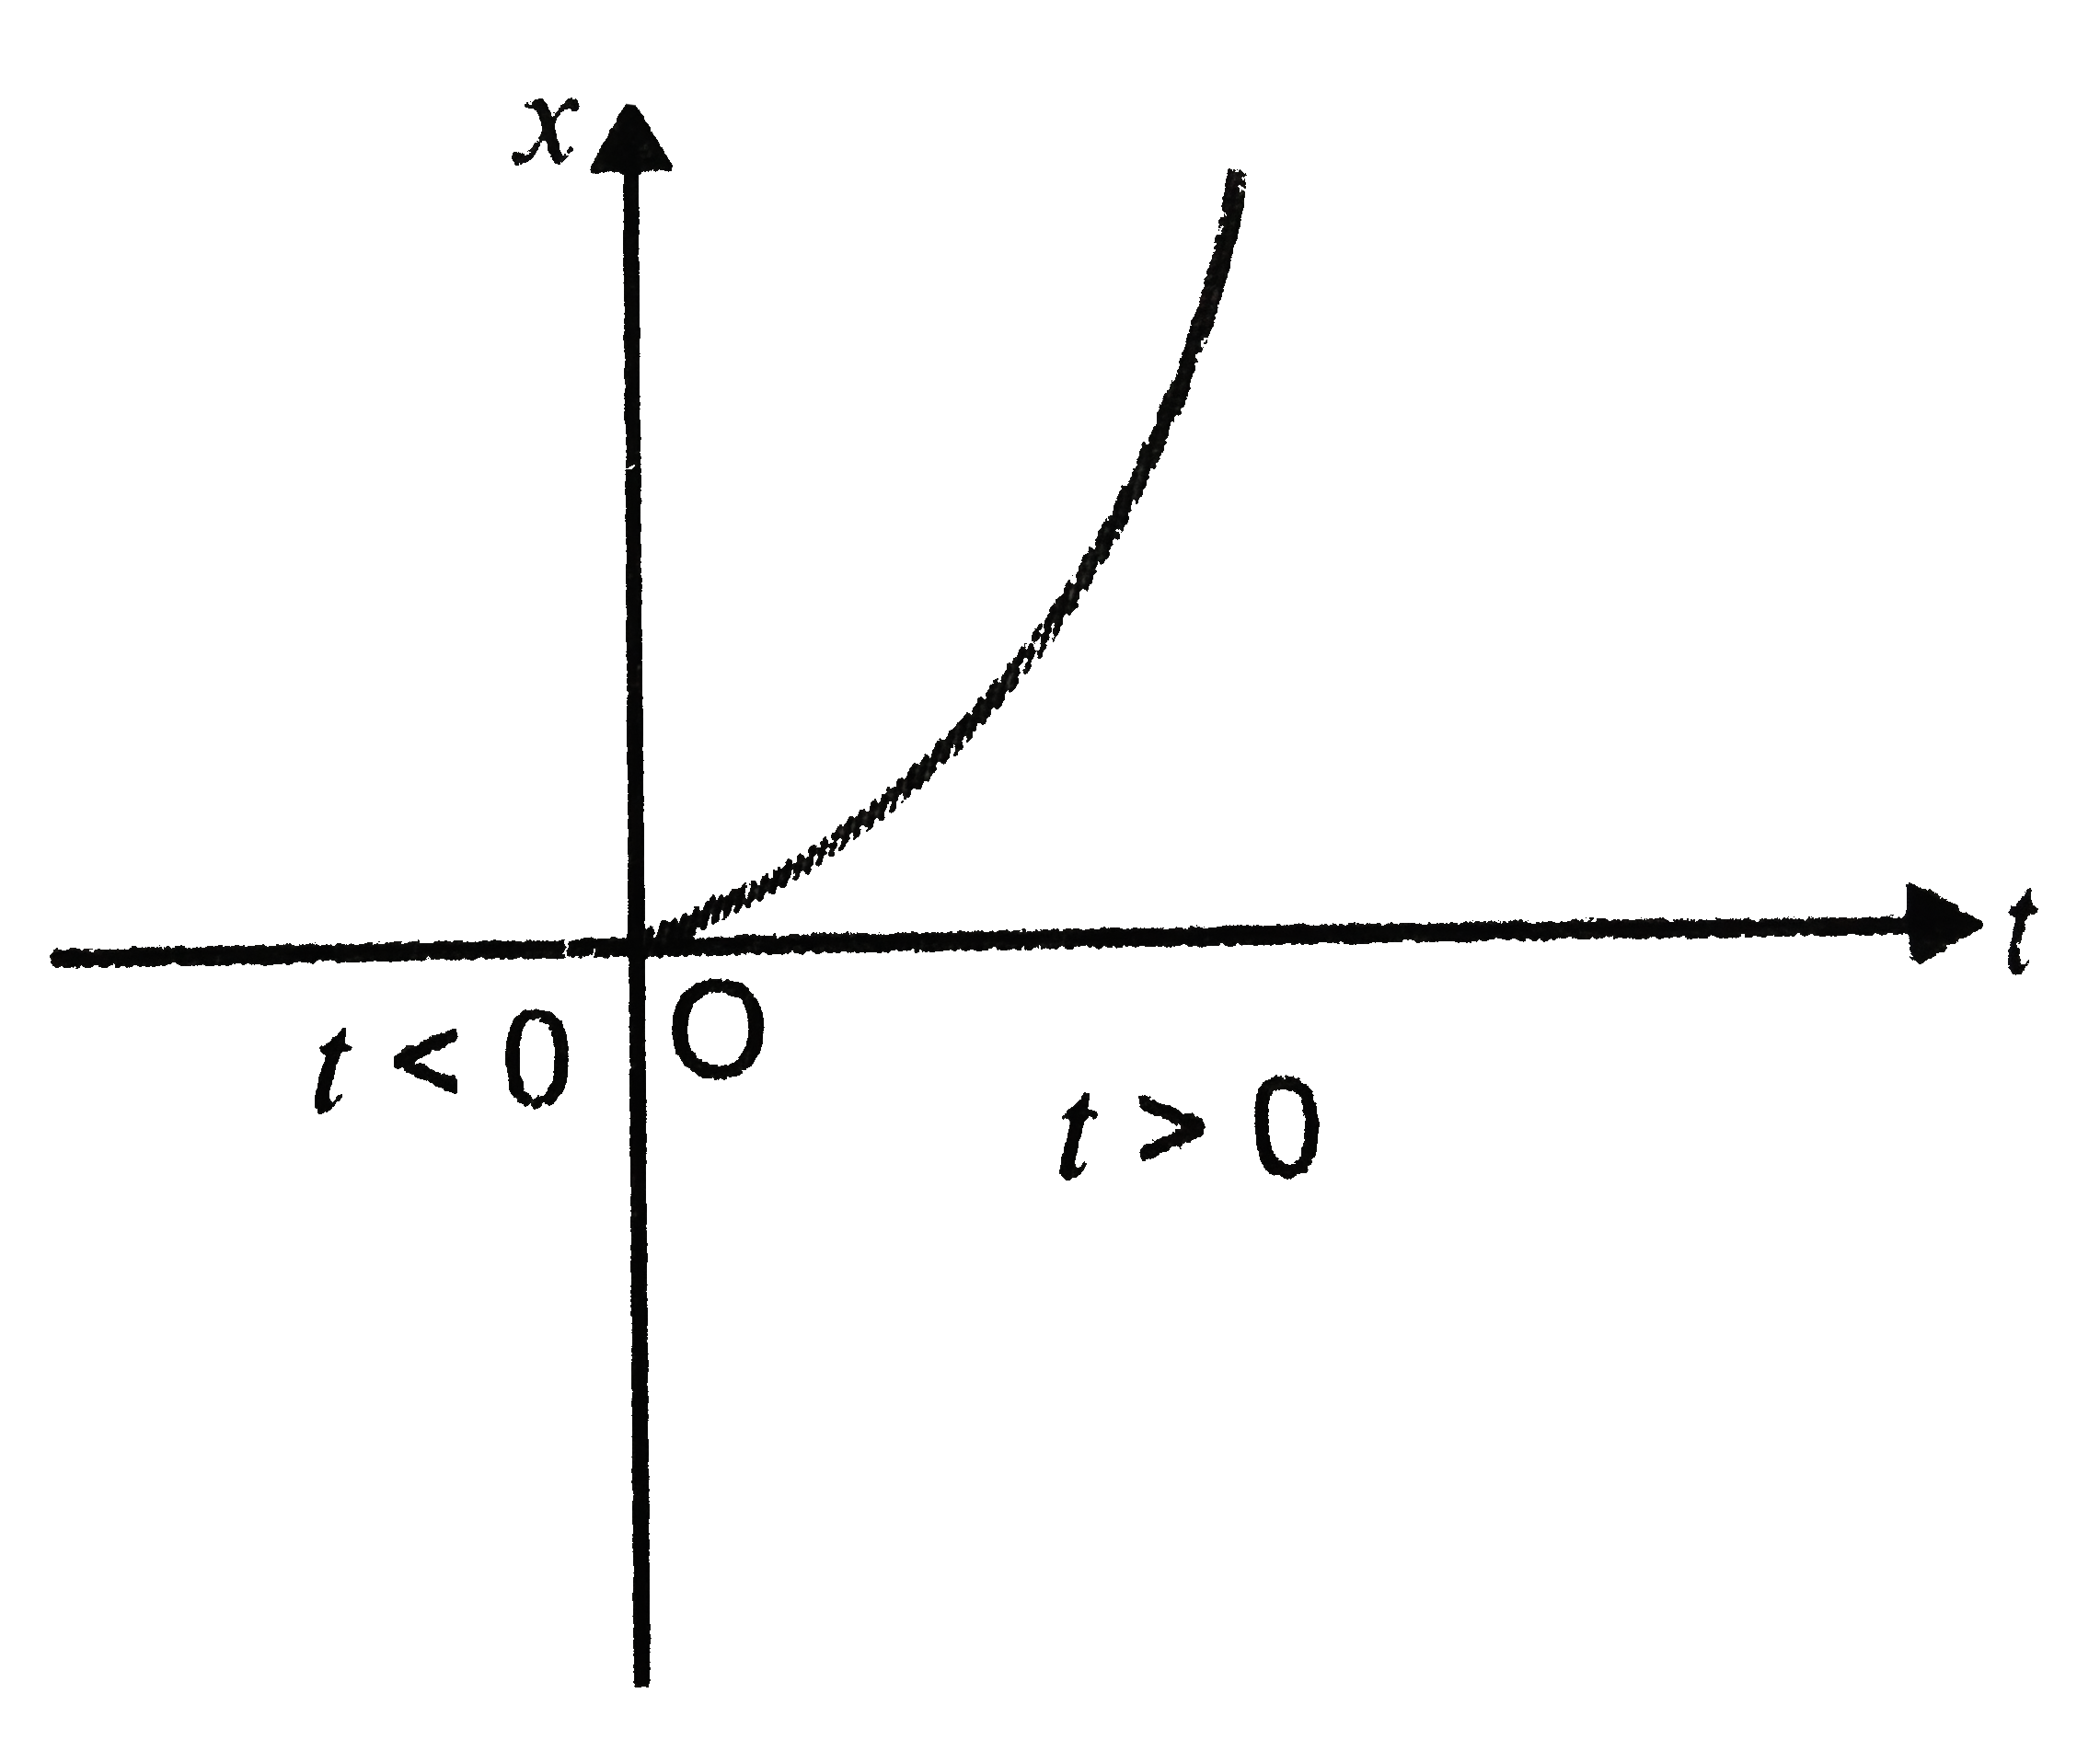
Fig. 2 (NCT). 6 shows x−t plot of one dismensional motion a particle. Is it correct to say from the graph that the particle moves in a straight line for t<0and on a parabolic path form t>0? If not, suggest a suitable physical contxt for this graph.
View SolutionConsider an 1100 particels gas system with speeds distribution as follows :
1000 particles each with speed 100m/s
2000 particles each wityh speed 200m/s
4000 particles each with speed 300m/s
3000 particles each with speed 400m/s and 1000 particles each with speed 500m/s
Find the average speed, and rms speed.
View SolutionThe graphs representing distribution of molecular speeds at 300 K for gases CI2 and N2 are as show in figure :
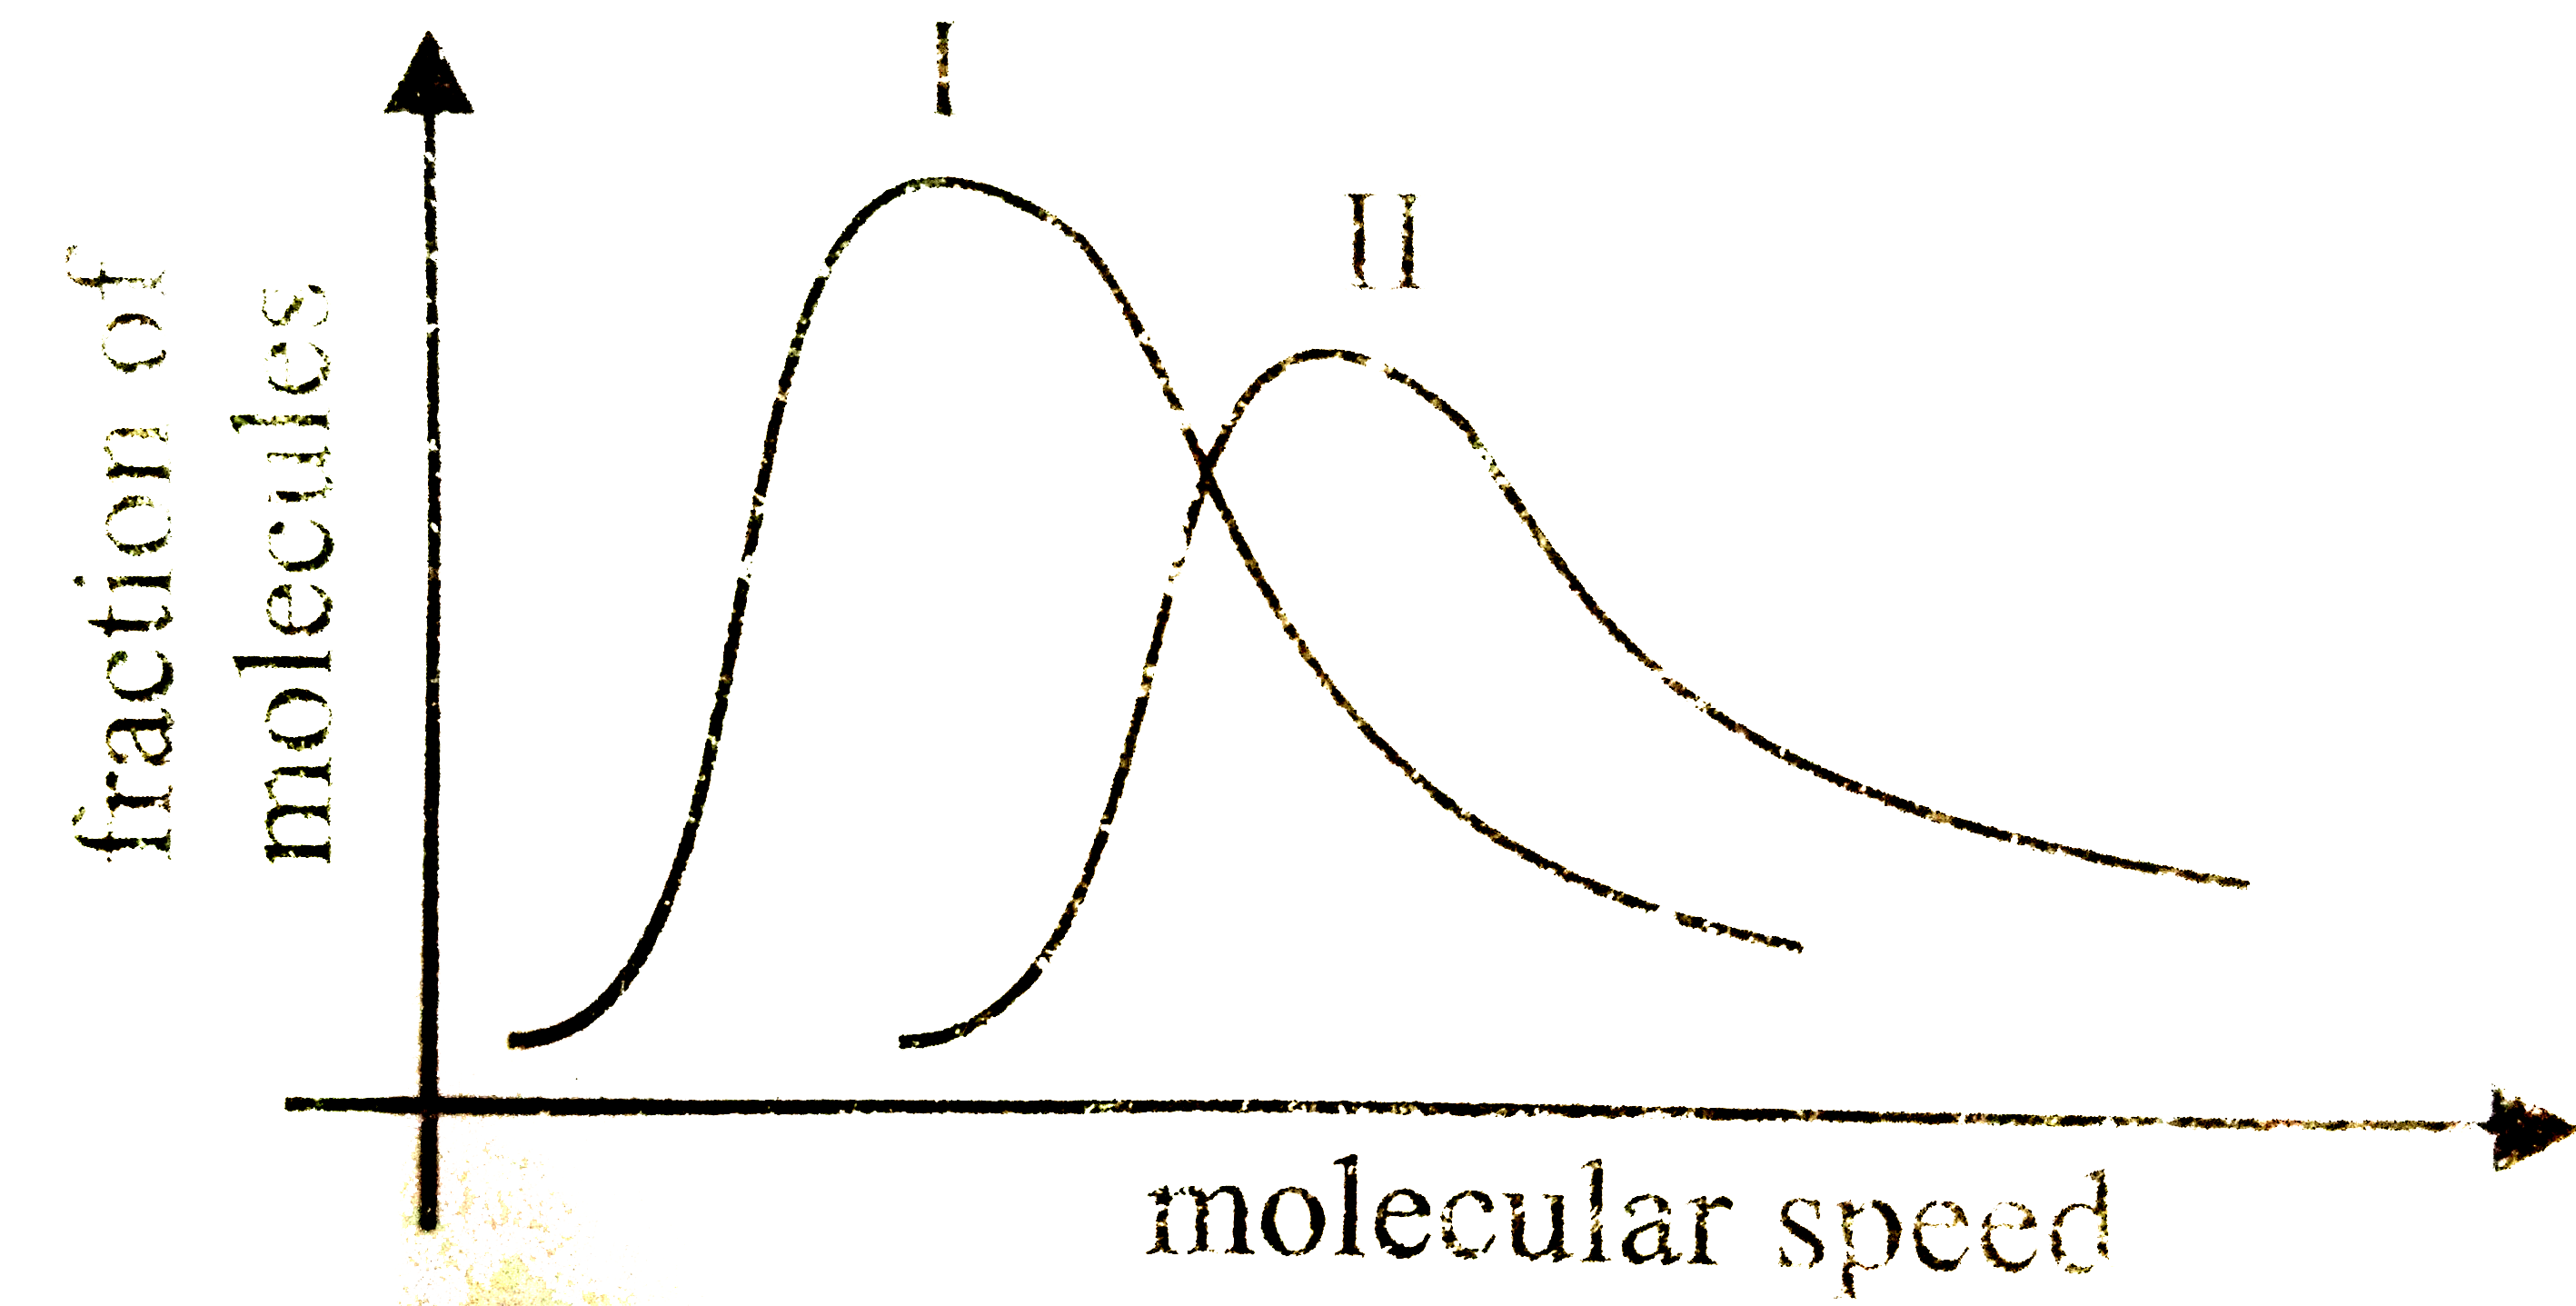
Select the correct option .
View SolutionPosition-time graph for a particle moving along x− direction is as shown in the figure. Average speed of the particle from t=0 to t=4 is :
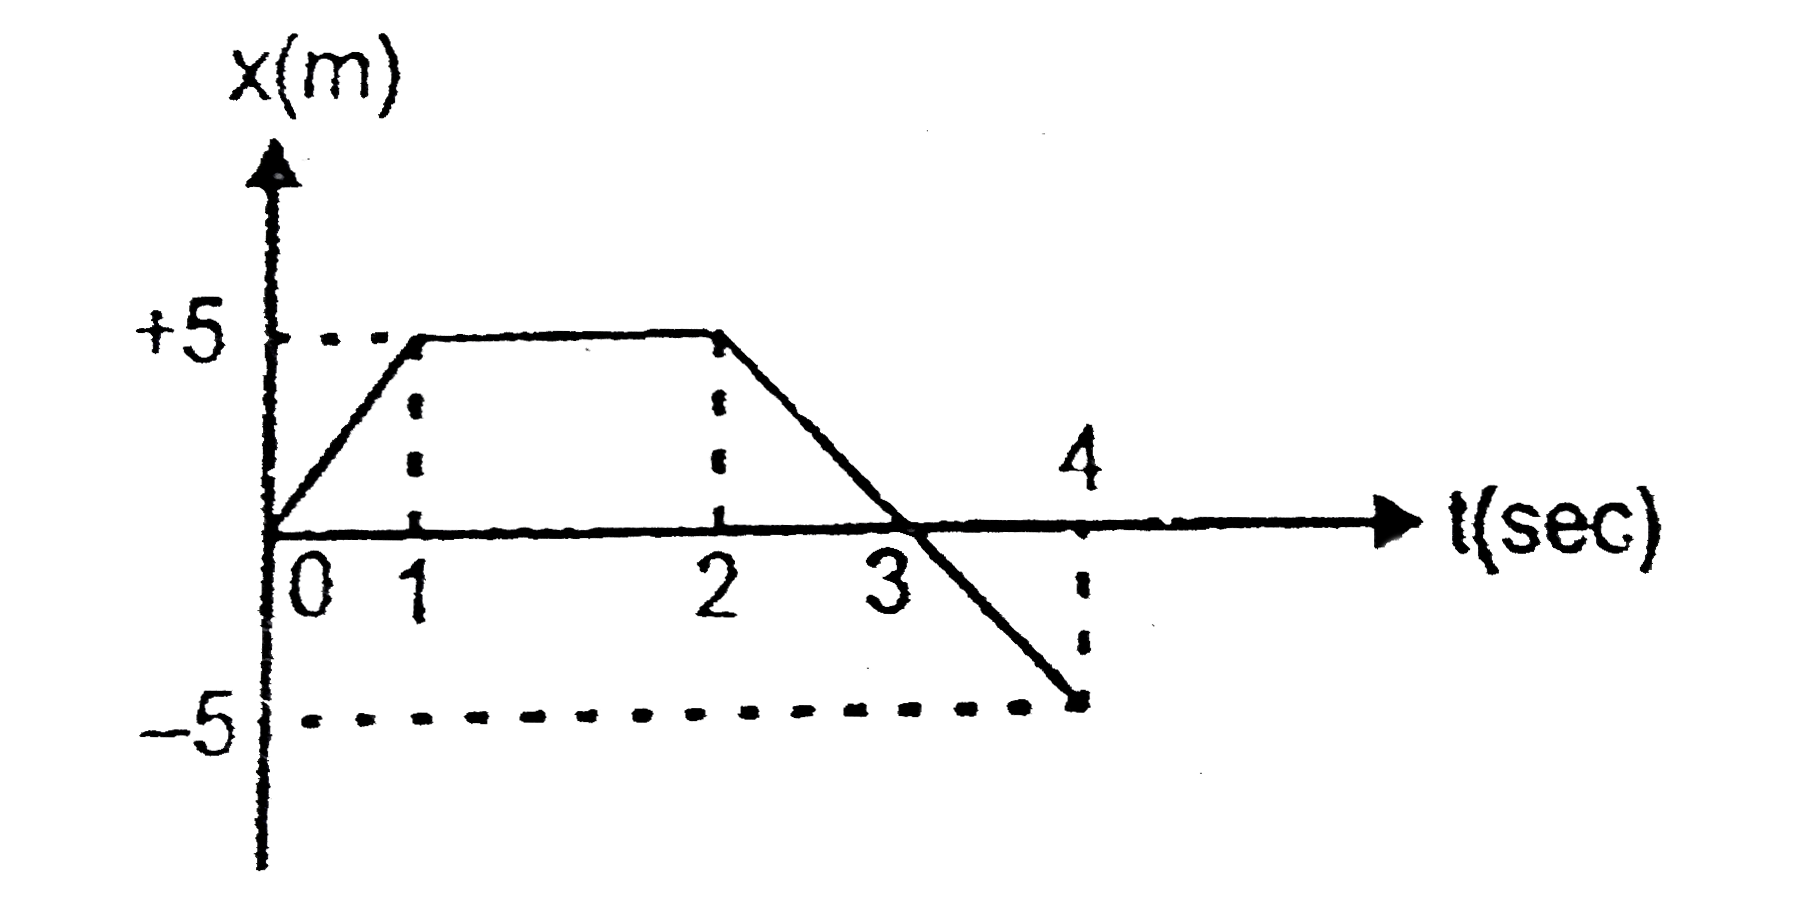
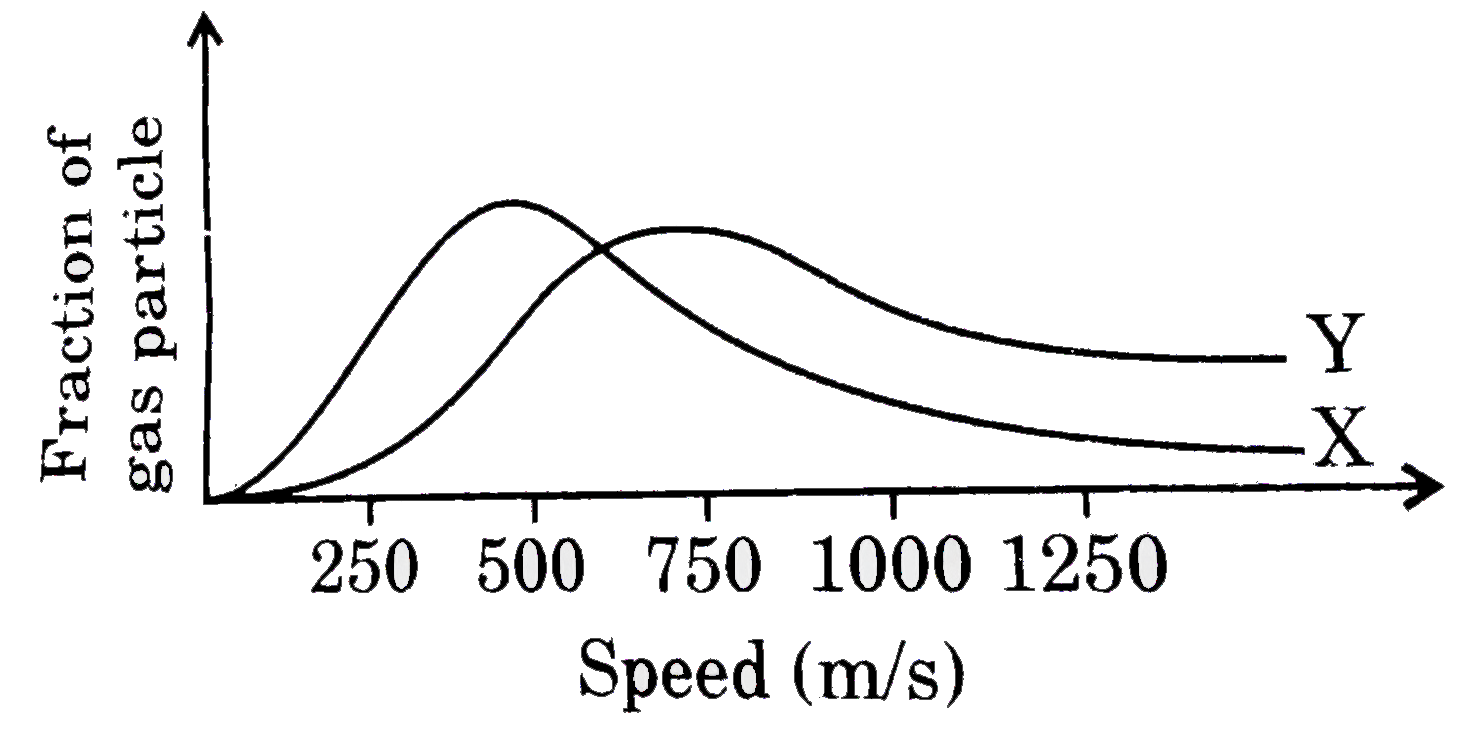
View SolutionThe graph below shows the distribution of molecular speeds of two ideal gases X and Y at 200 K . On the basis of the below graph, identify the correct statements .
View Solution
