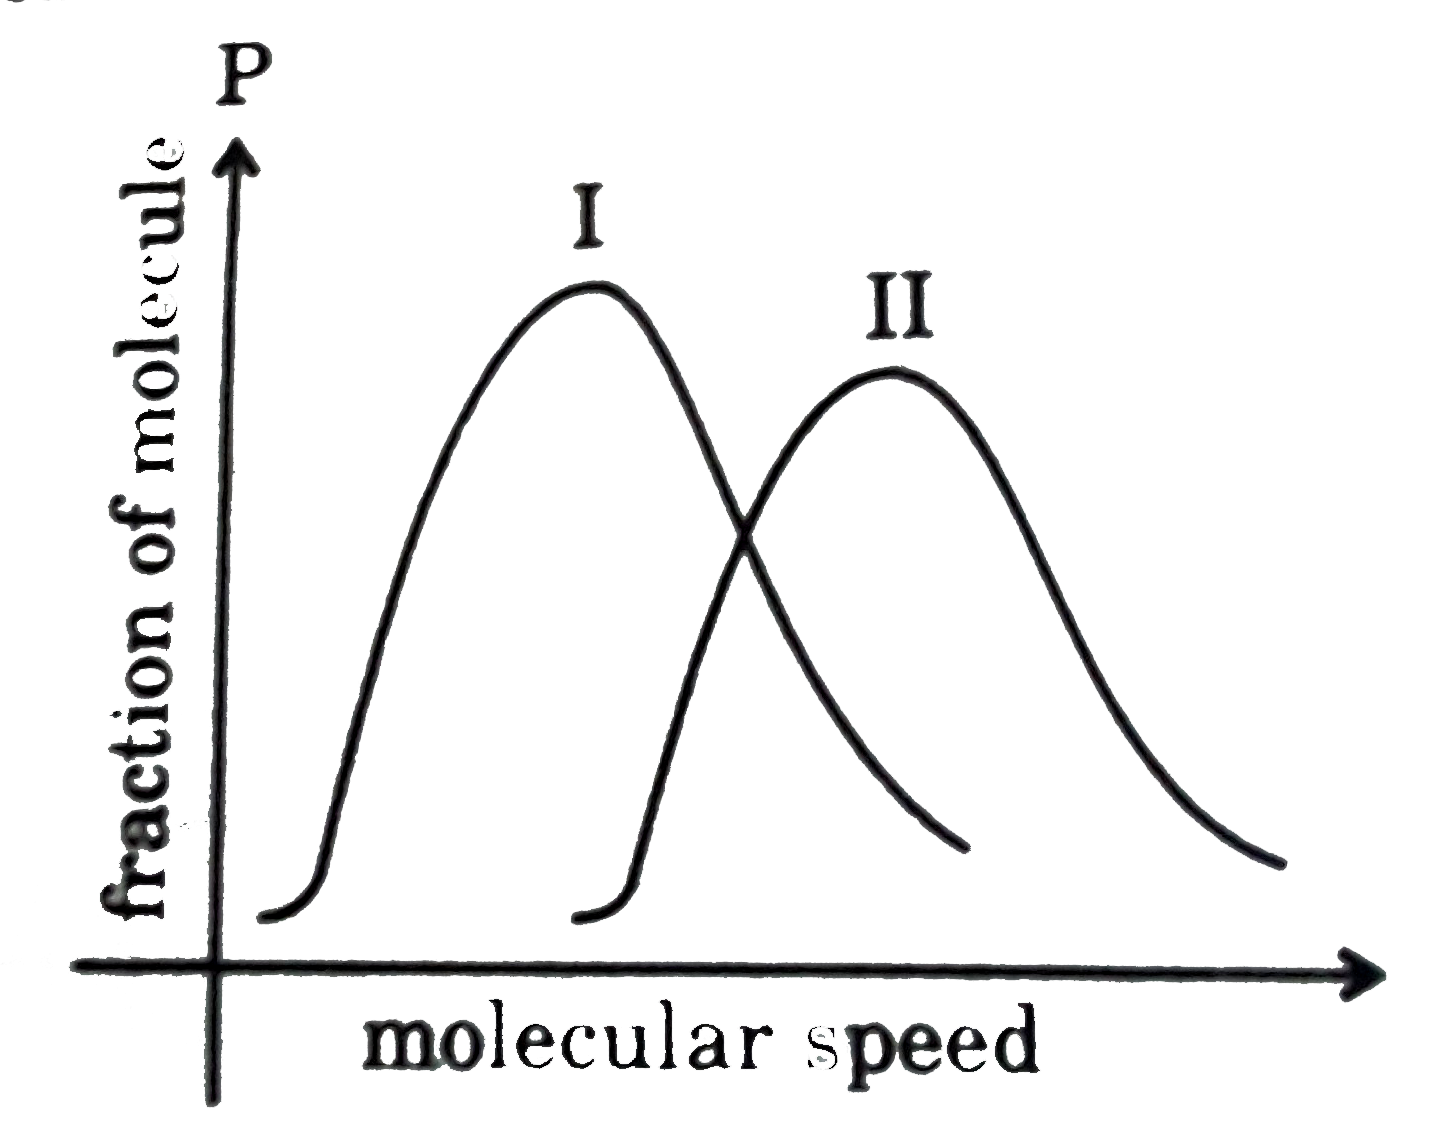
The graph below shows the distribution of molecular speeds of two ideal gases X and Y at 200 K . On the basis of the below graph, identify the correct statements .
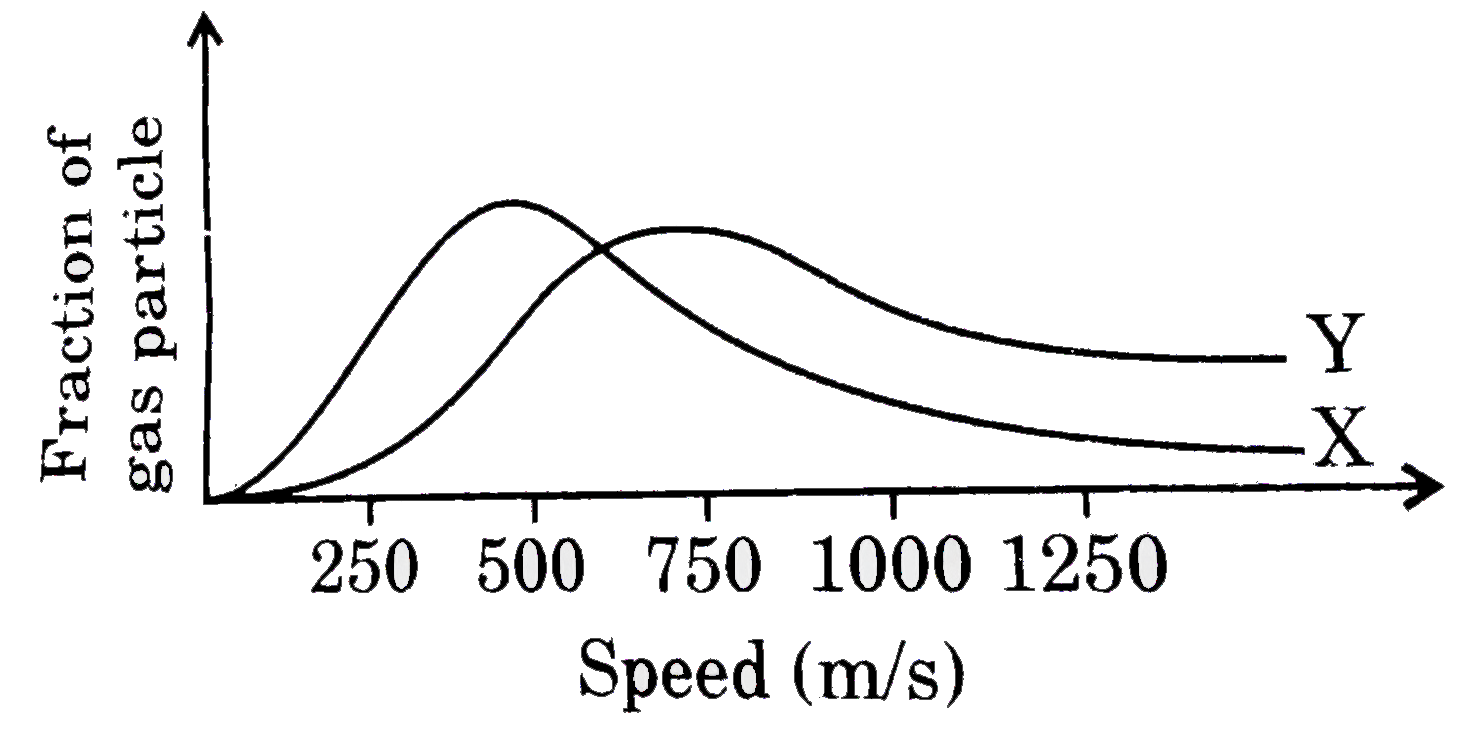
If gas X is methane, then gas Y can be CO2
Fraction of molecules of X must be grater then Y in a particular range of speed a 200K
Under identical conditions rate of effusion of Y is greater than that of X
The molar kinetic energy of gas X at 200K is equa to the molar kinetic energy of Y at 200 K
The correct Answer is:C, D
Step by step video, text & image solution for The graph below shows the distribution of molecular speeds of two ideal gases X and Y at 200 K . On the basis of the below graph, identify the correct statements . by Chemistry experts to help you in doubts & scoring excellent marks in Class 12 exams.
Topper's Solved these Questions
- BOOK - GRB PUBLICATIONCHAPTER - GRAPHICAL INTERPRETATIONEXERCISE - Comprehension 11videos
GRAPHICAL INTERPRETATION
- BOOK - GRB PUBLICATIONCHAPTER - GRAPHICAL INTERPRETATIONEXERCISE - Comprehension49videos
GRAPHICAL INTERPRETATION
- BOOK - GRB PUBLICATIONCHAPTER - GRAPHICAL INTERPRETATIONEXERCISE - Electrochemistry9videos
GRAPHICAL INTERPRETATION
- BOOK - GRB PUBLICATIONCHAPTER - F-BLOCK ELEMENTSEXERCISE - Subjective type7videos
F-BLOCK ELEMENTS
- BOOK - GRB PUBLICATIONCHAPTER - HYDROCARBON (ALIPHATIC)EXERCISE - Previous years jee questions28videos
HYDROCARBON (ALIPHATIC)
Similar Questions
Knowledge Check
- Question 1 - Select One
Identify the correct statement given below.
AAlpha rays have the highest penetrating poweBBeta rays have the highest penetrating powerCGamma rays have the highest penetrating powerDAll three kinds of rays have the same penetrating power - Question 2 - Select One
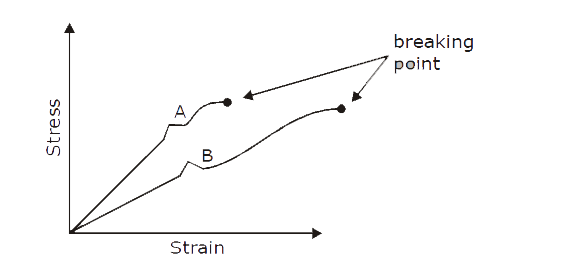
Select the correct statement on the basis of the given graph
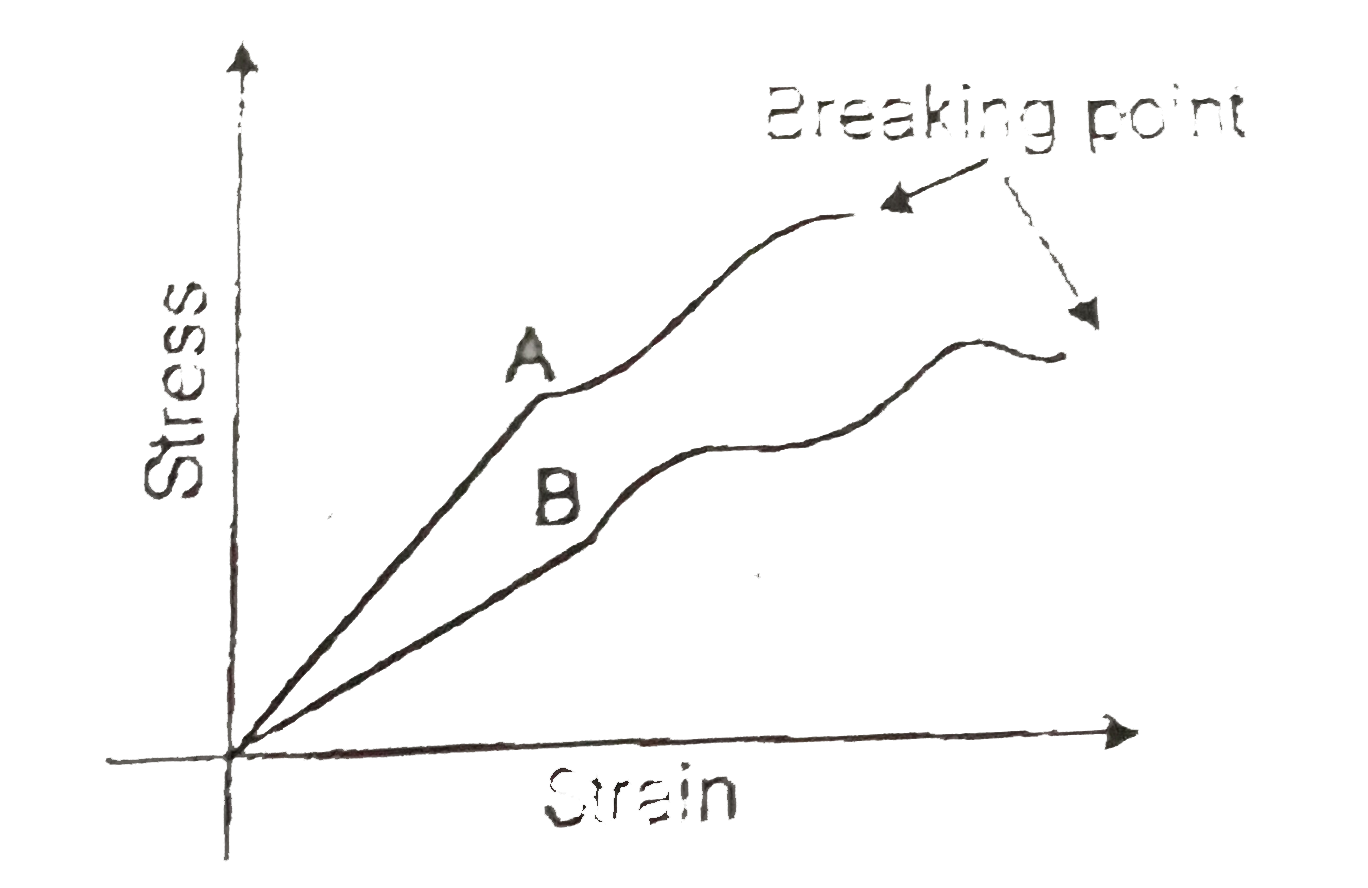 AYoung's modulus of A is greater but it is less ductileBYoung's modulus of A is greater and it is more ductileCYoung's modulus of A is less and it is less ductileDYoung's modulus of A is less but it is more ductile
 - Question 3 - Select One
The distribution of molecular speeds for CO2 at different temperatures is given below, which of the following statements is incorrect?
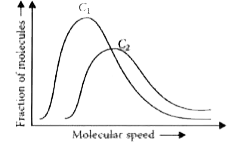 AIt represents Maxwell's distribution curve.BTemperature of C2 graph is more than that of C1.CThe average velocity of molecules in C2 graph is more than C1.DVelocity ∝1√M, therefore, molecular mass of molecules in C1<C2.
If graph of |y|=f(x)andy=|f(x)| are given as below. Then identify the correct statements
View SolutionSelect the correct statement on the basis of the given graph :
 View Solution
The graphs representing distribution of molecular speeds at 300 K for gases CI2 and N2 are as show in figure :
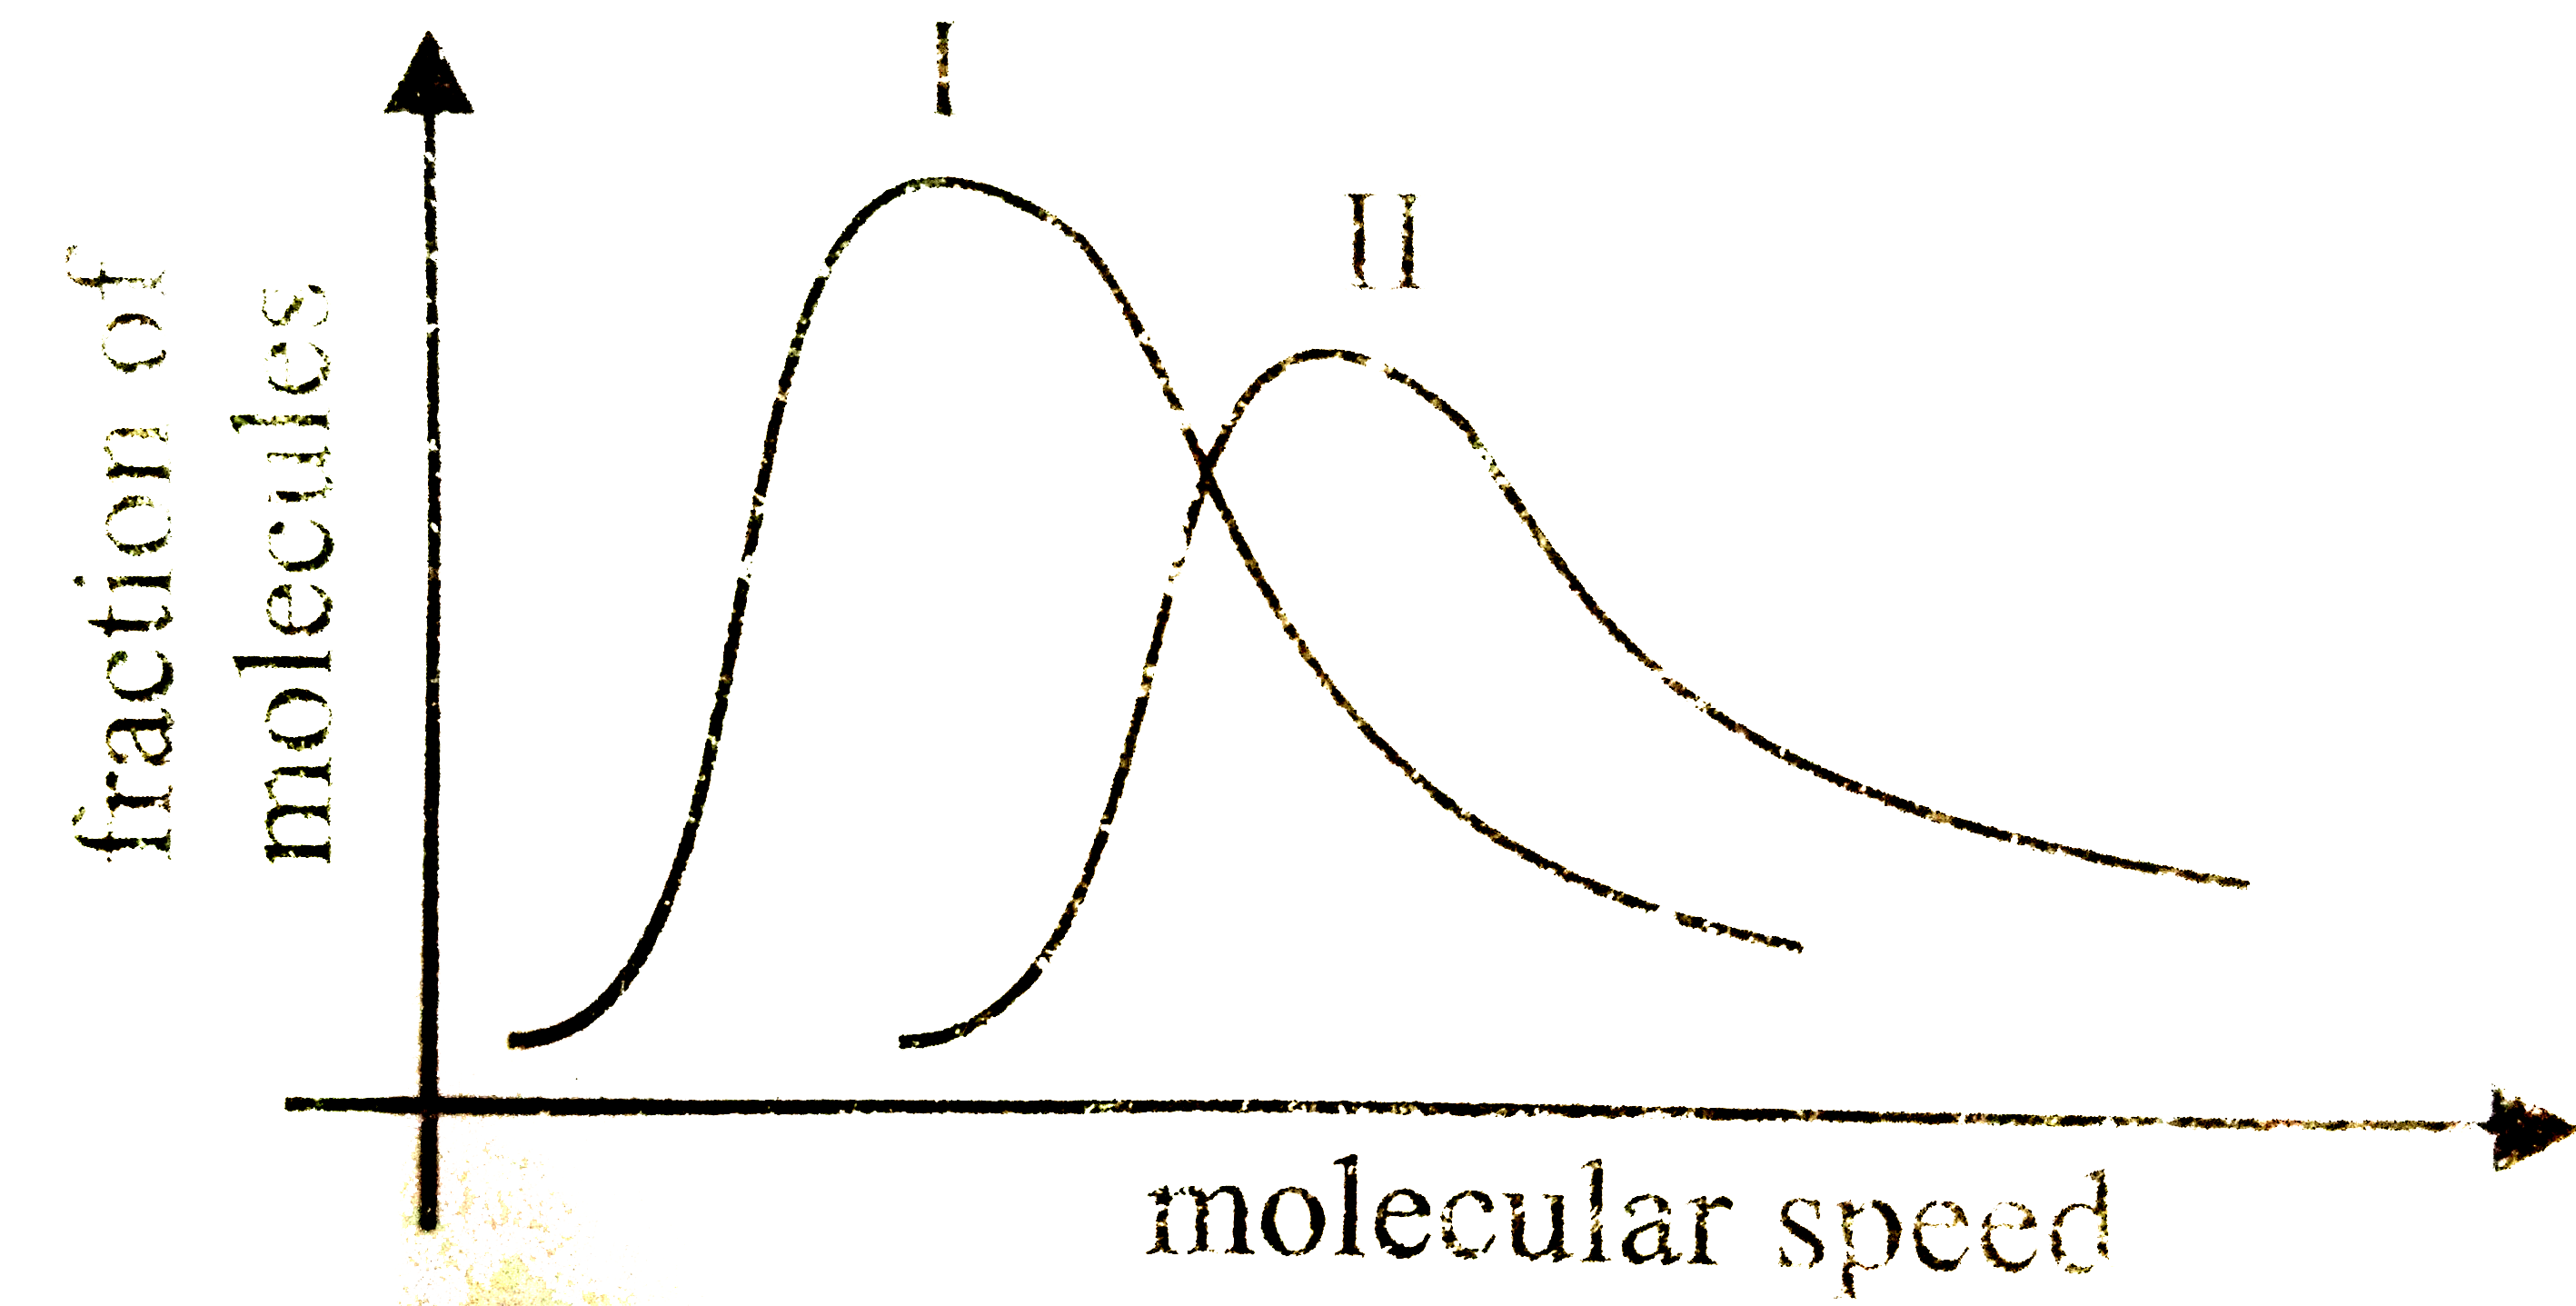
Select the correct option .View Solution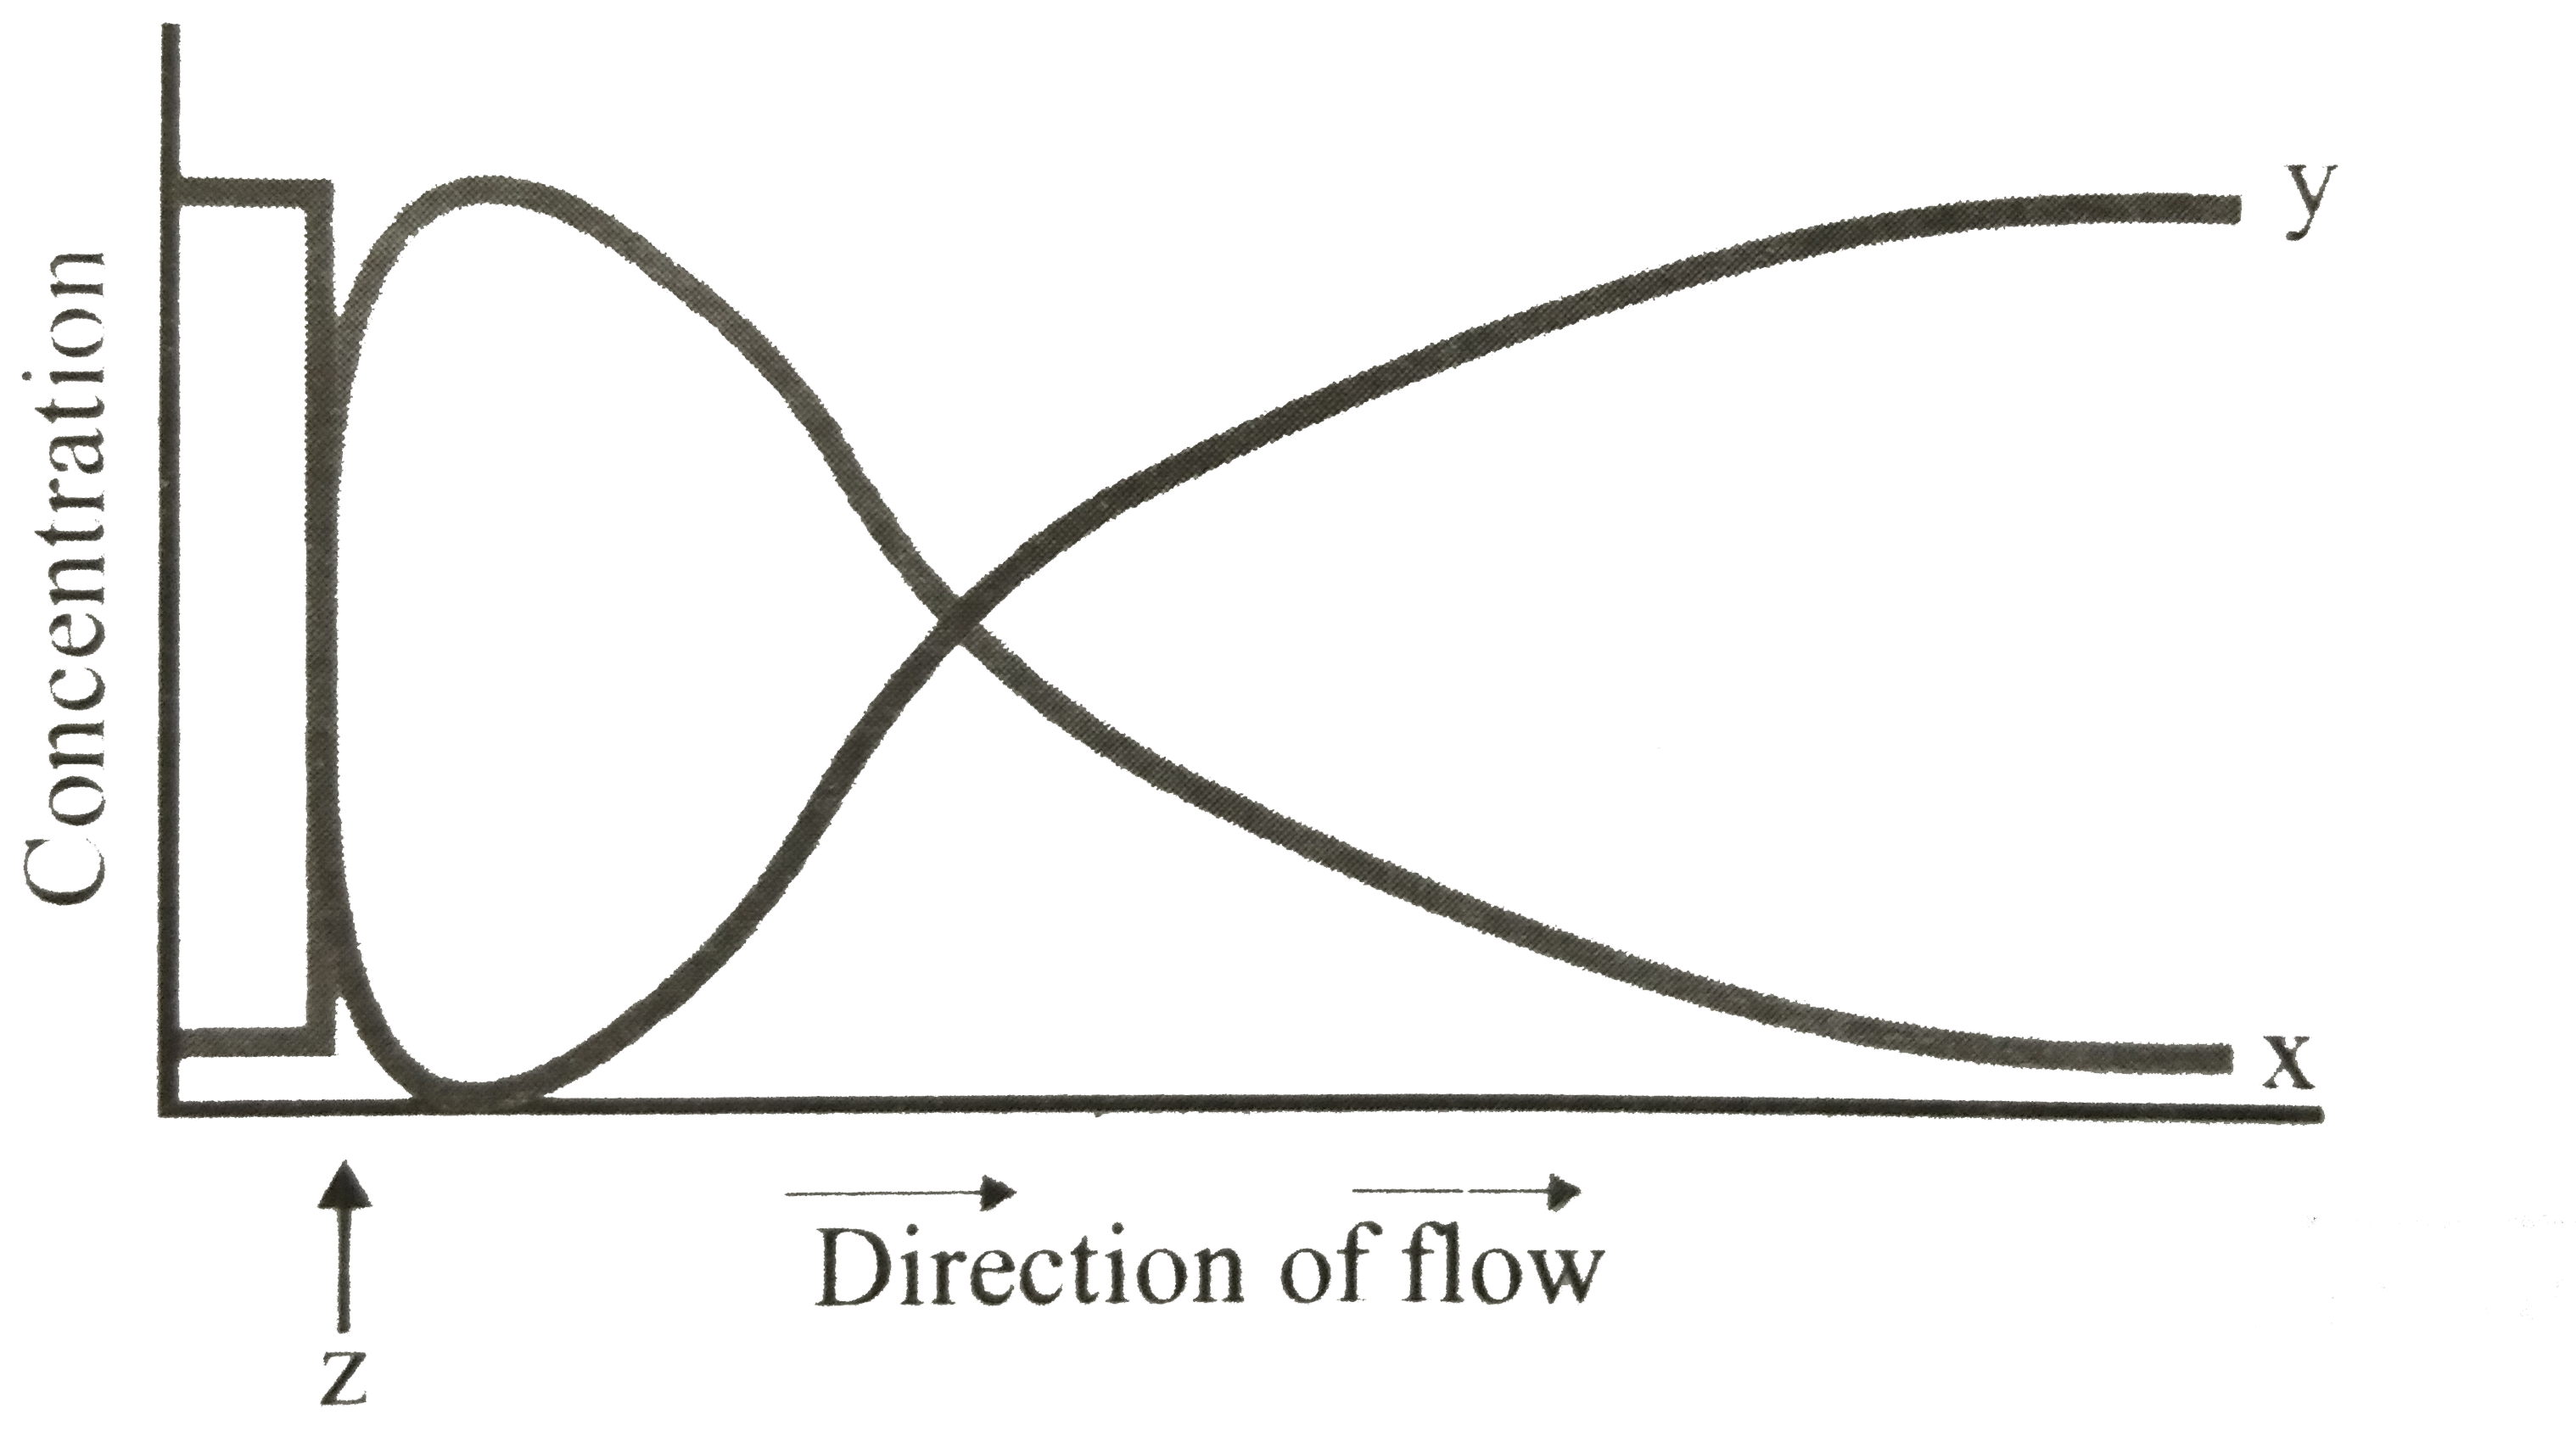
Observe the above graph and identify x, y, z.View SolutionThe graphs representing distribution of molecular speeds at 300 K for gases CI2 and N2 are as shown below (Atomic mass N=14,CI=35.5):
 View Solution

