If a particle is moving along a straight line and following is the graph showing acceleration varying with time then choose correct statement(s). At t=0,x=0 and v0=7ms−1
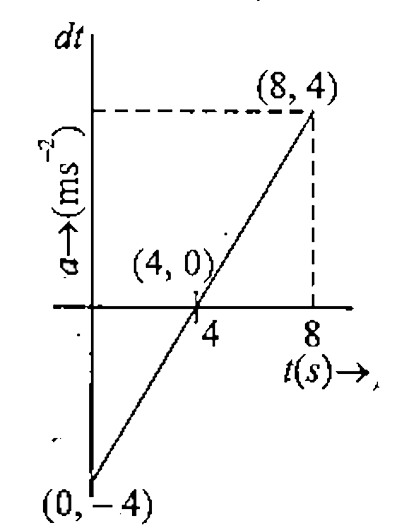
Its displacement can never become zero
Its velocity can never become zero
Its displacement can become zero
Its velocity can become zero
The correct Answer is:A, D
Step by step video, text & image solution for If a particle is moving along a straight line and following is the graph showing acceleration varying with time then choose correct statement(s). At t=0, x=0 and v_(0)=7 ms^(-1) by Physics experts to help you in doubts & scoring excellent marks in Class 11 exams.
Updated on:21/07/2023Topper's Solved these Questions
- KINEMATICSBOOK - PHYSICS GALAXY - ASHISH ARORACHAPTER - KINEMATICSEXERCISE - Unsolved Numerical Pro.
83 Videos
- KINEMATICSBOOK - PHYSICS GALAXY - ASHISH ARORACHAPTER - KINEMATICSEXERCISE - Numerical
111 Videos
- GRAVITATIONBOOK - PHYSICS GALAXY - ASHISH ARORACHAPTER - GRAVITATIONEXERCISE - Unsolved Numerical
94 Videos
- LINEAR MOMENTUM & ITS CONSERVATIONBOOK - PHYSICS GALAXY - ASHISH ARORACHAPTER - LINEAR MOMENTUM & ITS CONSERVATIONEXERCISE - exercise 1.3
3 Videos
Similar Questions
A particle is moving along a straight line whose v-s graph is shown, the dashed line is tangent to the curve. The magnitude of acceleration is ( in m/s2)
View SolutionThe x-t graph of a particle moving along a straight line is shown in figure
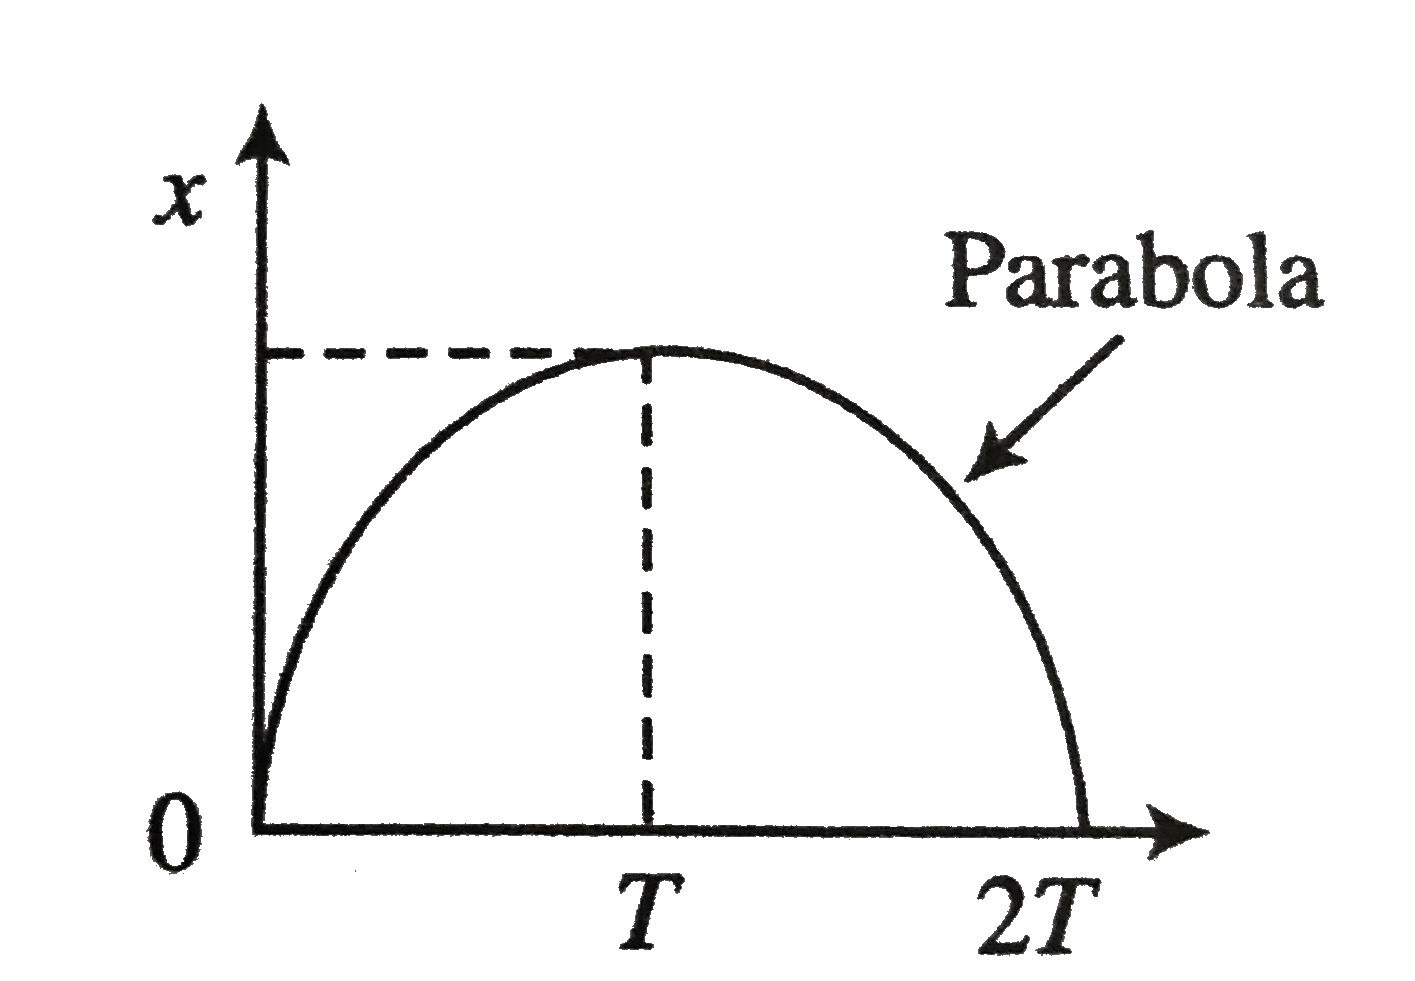
The speed-time graph of the particle is correctly shown by
View Solution
Knowledge Check
If a particle is moving along a straight line and following is the graph showing acceleration varying with time then choose the correct statement (s) for interval t = 0 to t = 8 sec, At t = 0, x = 0 and v0=7m/s
AIts displacement can never be zeroBIts velocity can never be zeroCIts displacement can become zeroDIts velocity can become zeroA particle is moving in a straight line according to graph given below : (a is acceleration, v is velocity, x is position, t is time) :
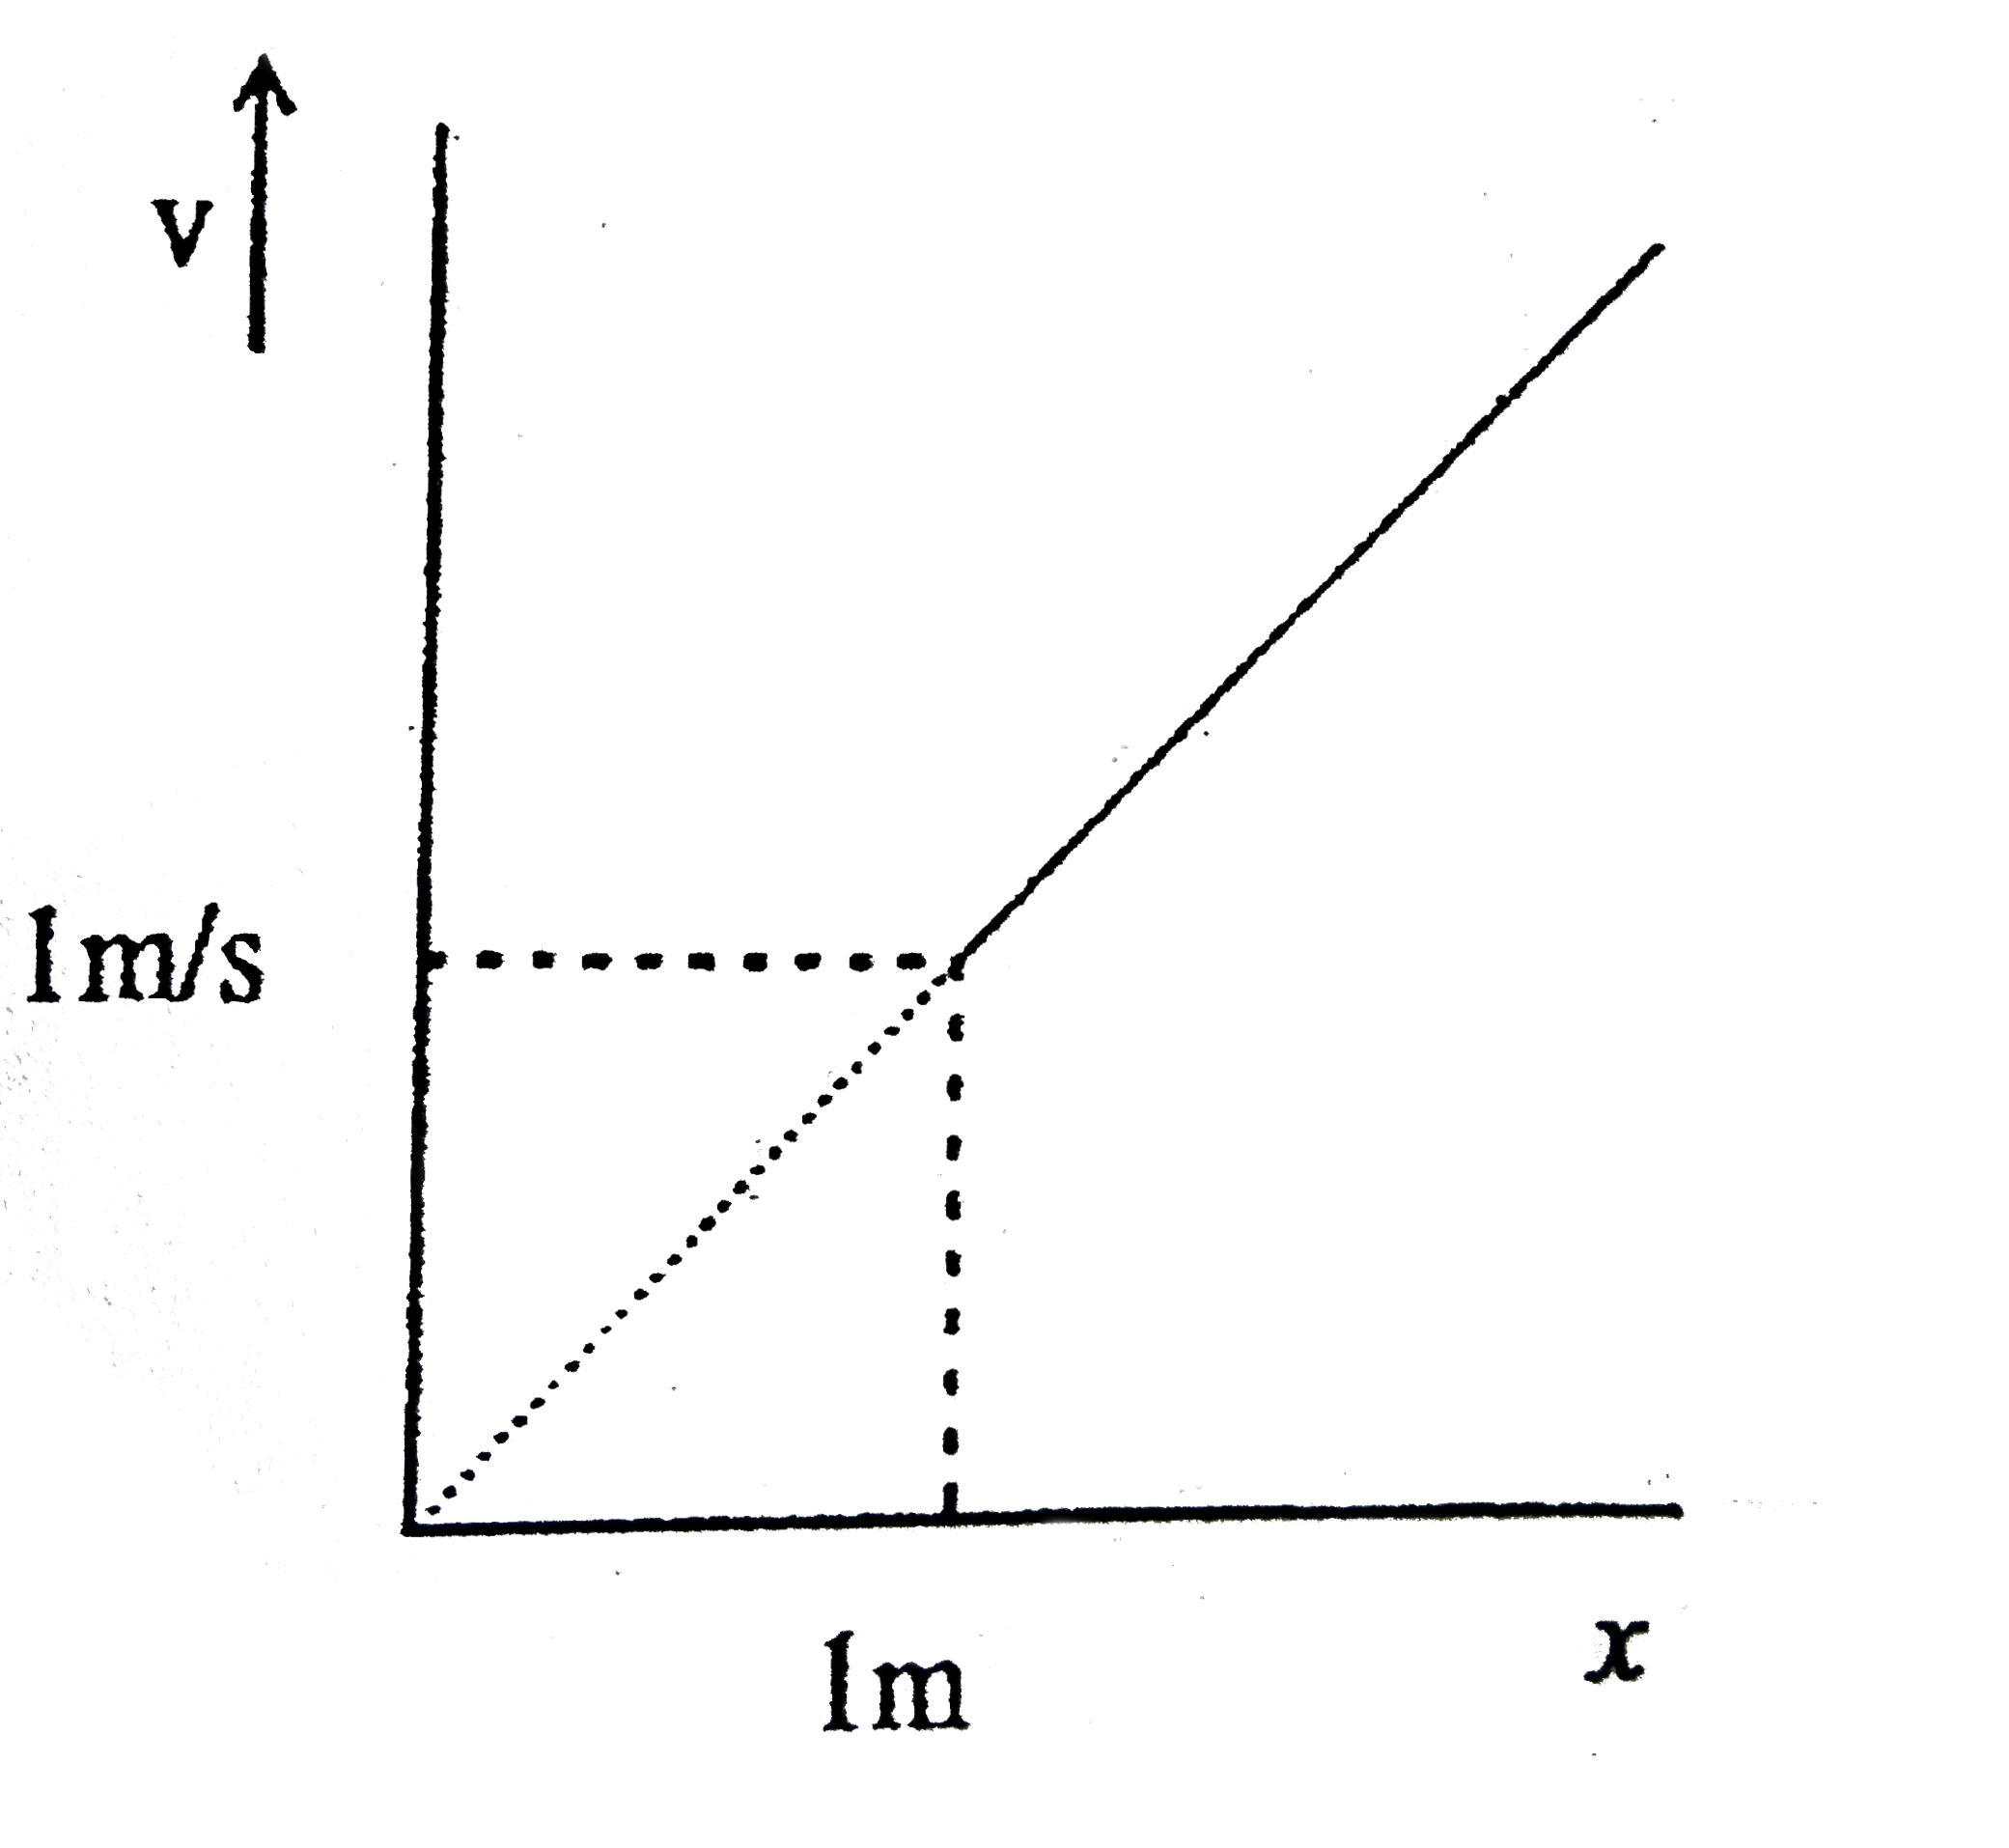 A
A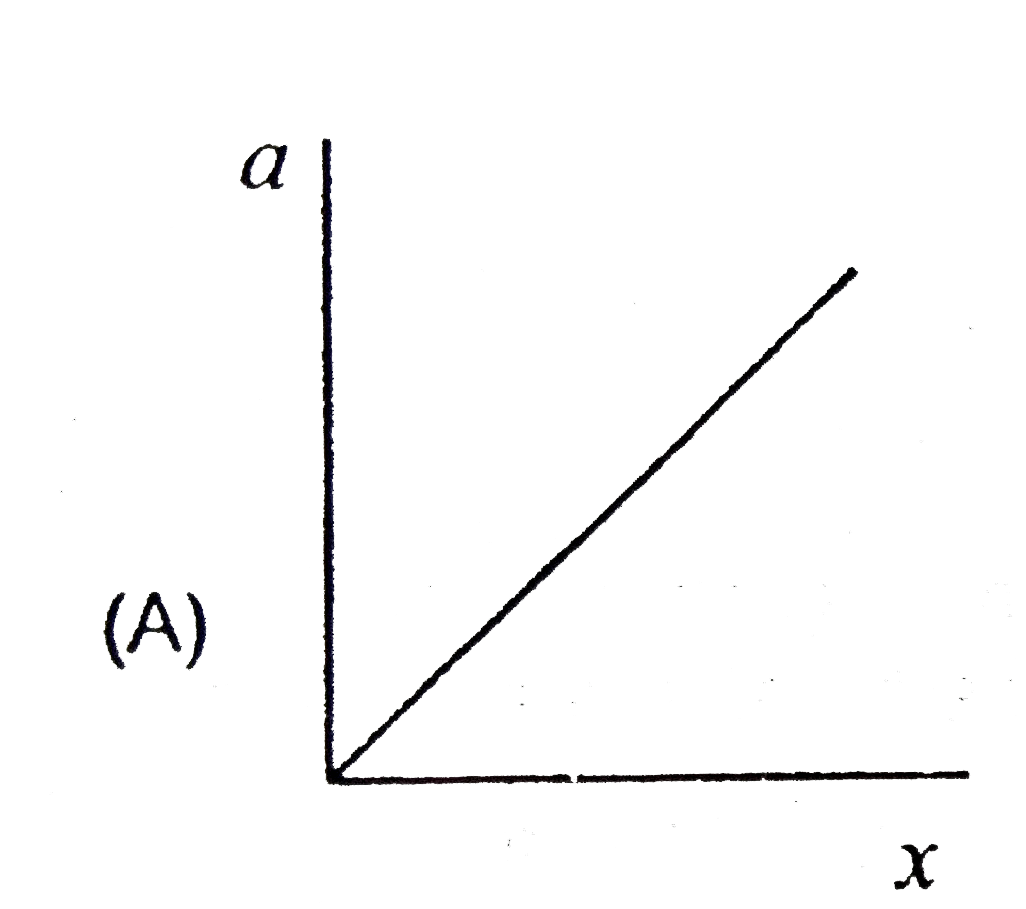 B
B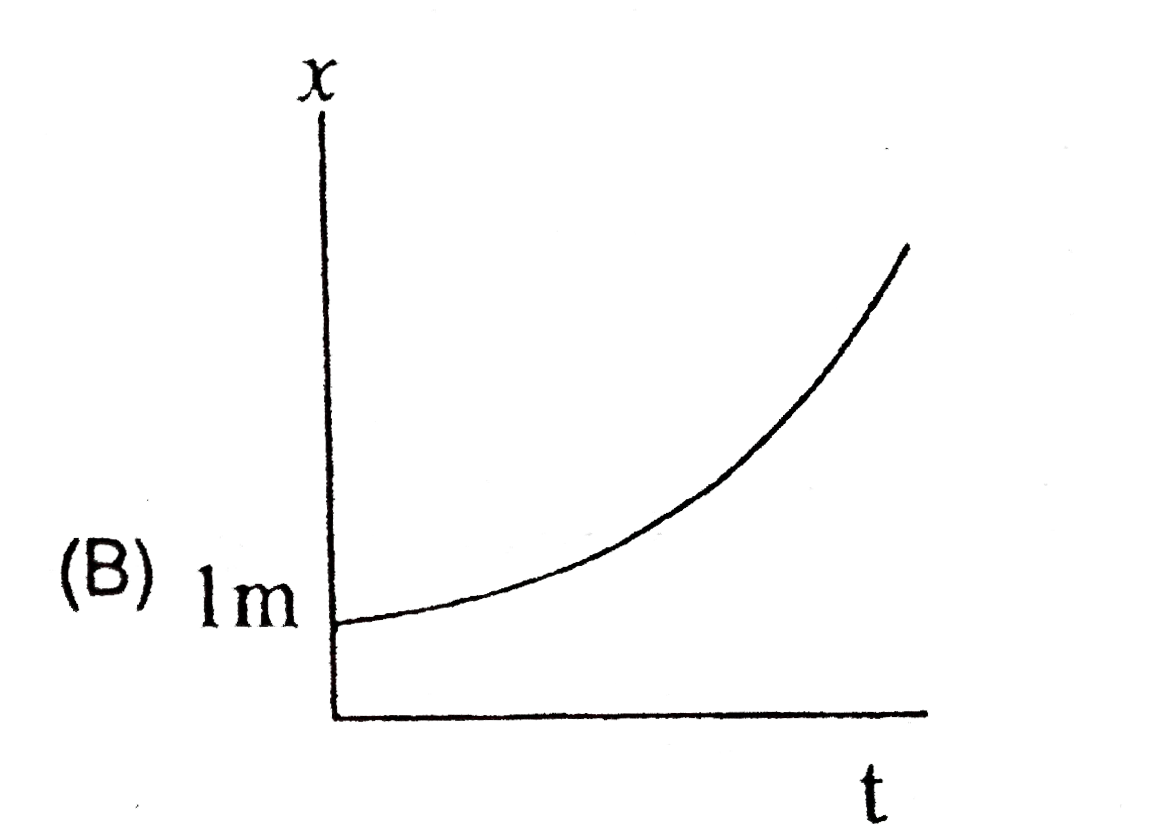 C
C D
D
Acceleration time graph of a particle moving along a straight line is given. Then average acceleration between t=0 & t=4 is :−
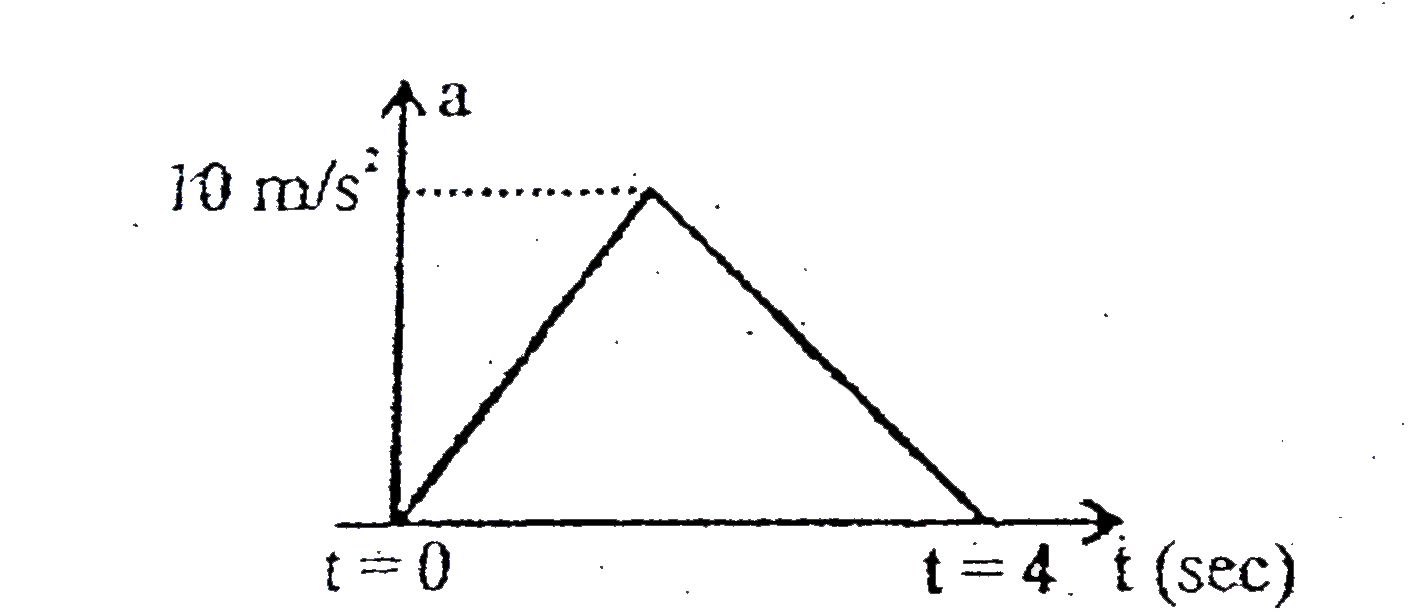 A0m/s2B5m/s2C10m/s2D7.5m/s2
The x-t graph of a particle moving along a straight line is shown in figure

The v-t graph of the particle is correctly shown by
View SolutionThe x−t graph of particle moving along a straight line is shown in figure
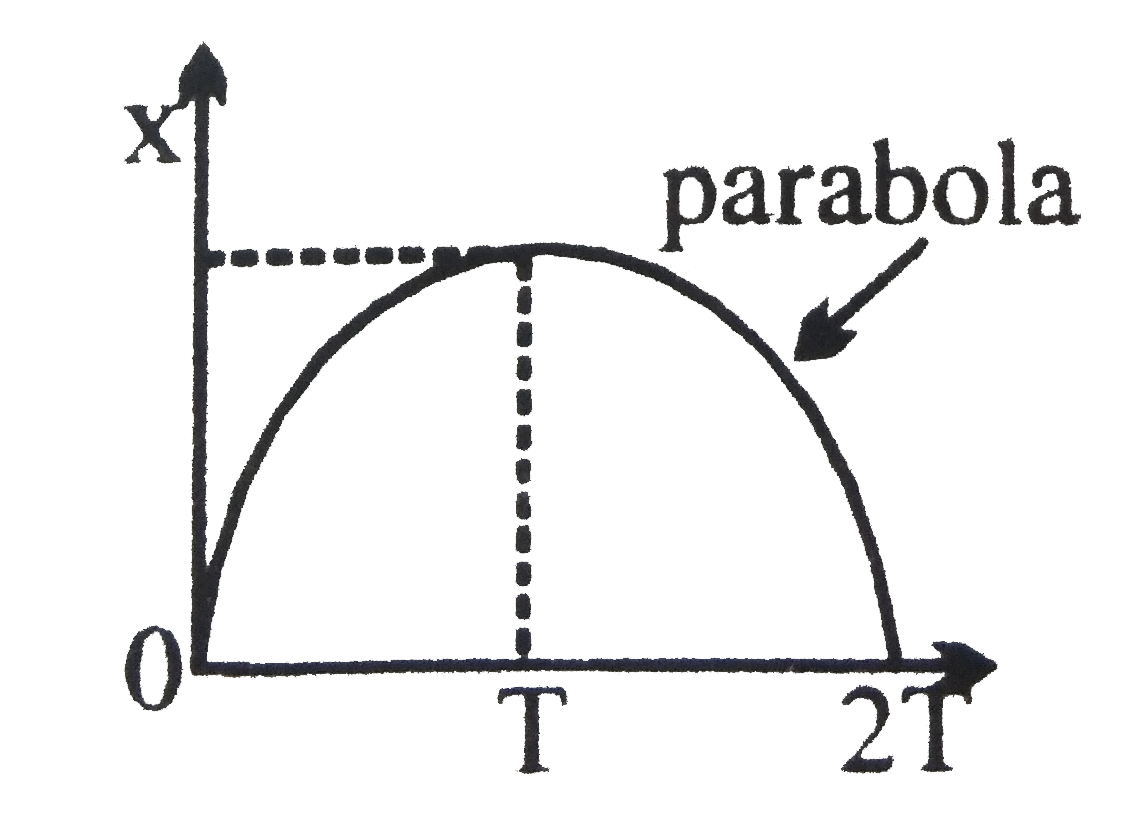
The v−t graph of the particles is correctly shown by
View SolutionThe x−t graph of particle moving along a straight line is shown in figure
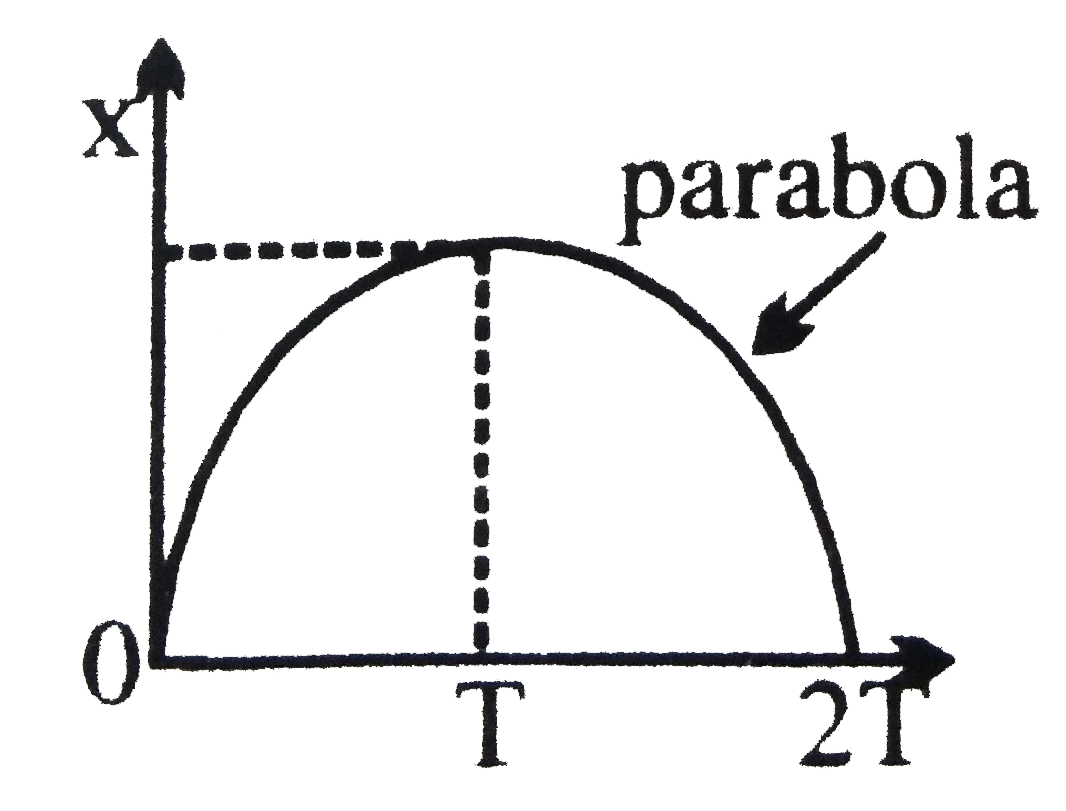
The a−t graph of the particle is correctly shown by
View SolutionThe x-t graph of a particle moving along a straight line is shown in figure
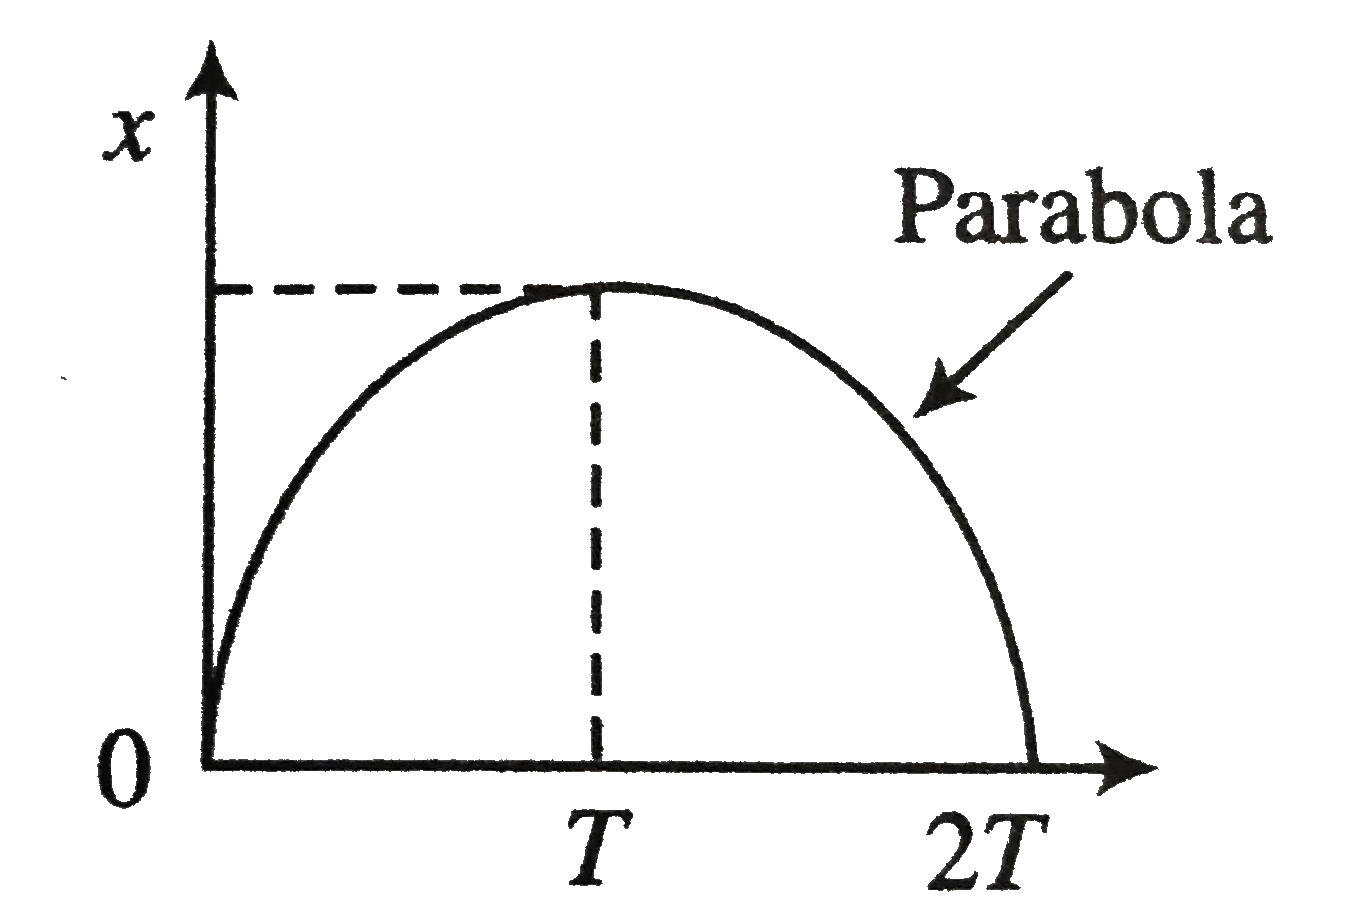
The a-t graph of the particle is correctly shown by
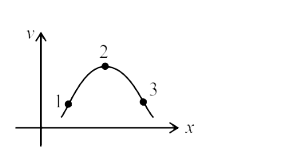
View SolutionThe v-x graph for a particle moving along a straight line is shown in the figure. At which of the points marked, the acceleration is negative?
View Solution
