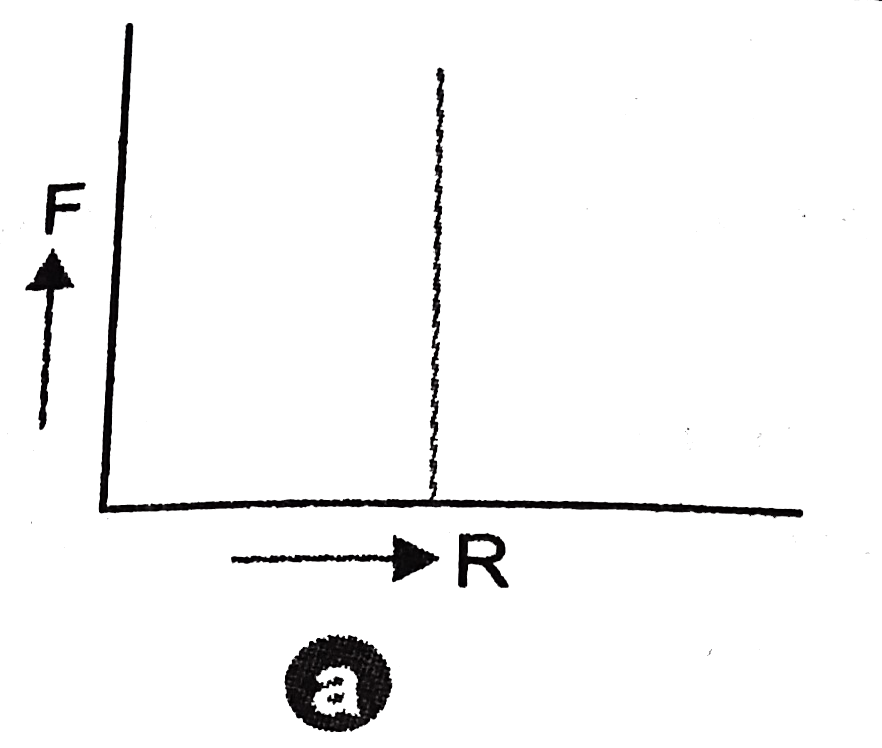
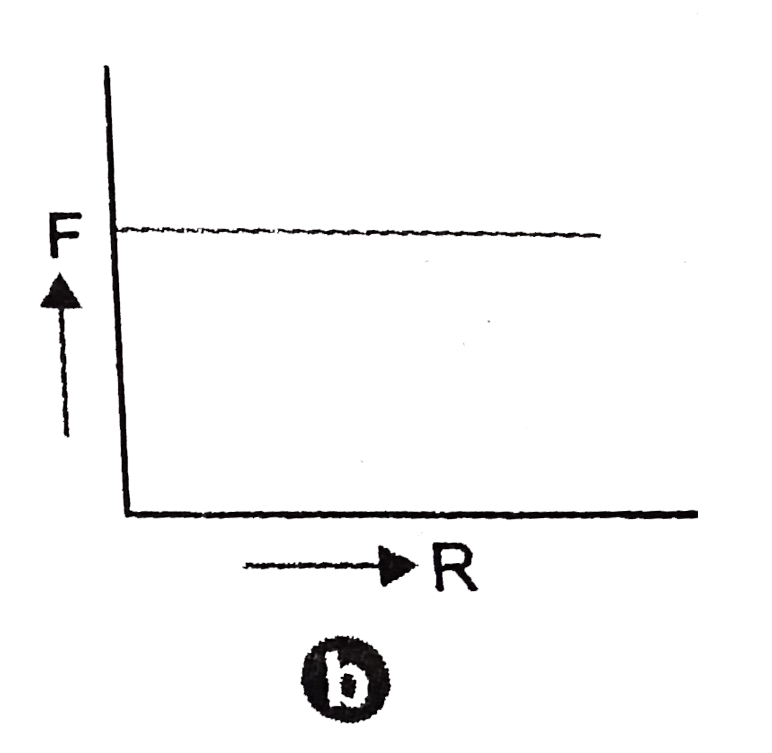
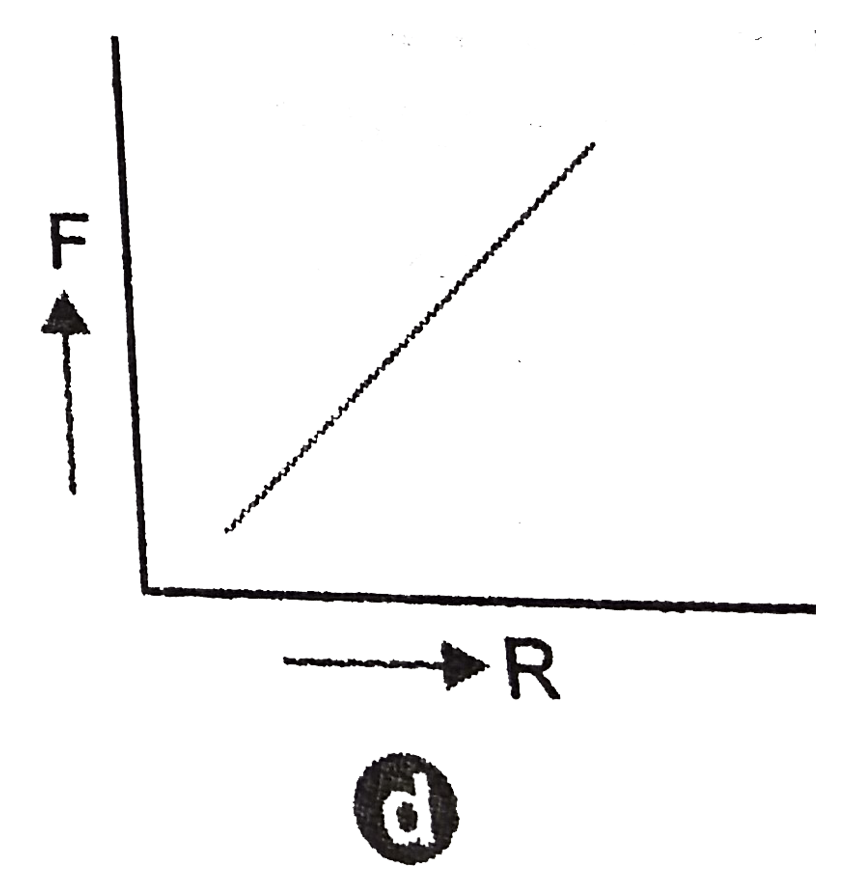
In a laboratory experiment four students plotted graphs between force of limiting friction (F) and normal reaction (R) Which one is correct .
 .
.
 .
.
 .
.
 .
.
The correct Answer is:d
As F∝R therefore, choice (d) is the correct graph between F and R .
Topper's Solved these Questions
- LAWS OF MOTIONBOOK - PRADEEPCHAPTER - LAWS OF MOTIONEXERCISE - Fill in the blanks
20 Videos
- LAWS OF MOTIONBOOK - PRADEEPCHAPTER - LAWS OF MOTIONEXERCISE - Problems for practice
112 Videos
- LAWS OF MOTIONBOOK - PRADEEPCHAPTER - LAWS OF MOTIONEXERCISE - Value Based Questions with Answers
5 Videos
- KINEMATICSBOOK - PRADEEPCHAPTER - KINEMATICSEXERCISE - 1 NCERT Comprehension
4 Videos
- MATHEMATICAL TOOLSBOOK - PRADEEPCHAPTER - MATHEMATICAL TOOLSEXERCISE - Fill in the blanks
5 Videos
Similar Questions
Knowledge Check
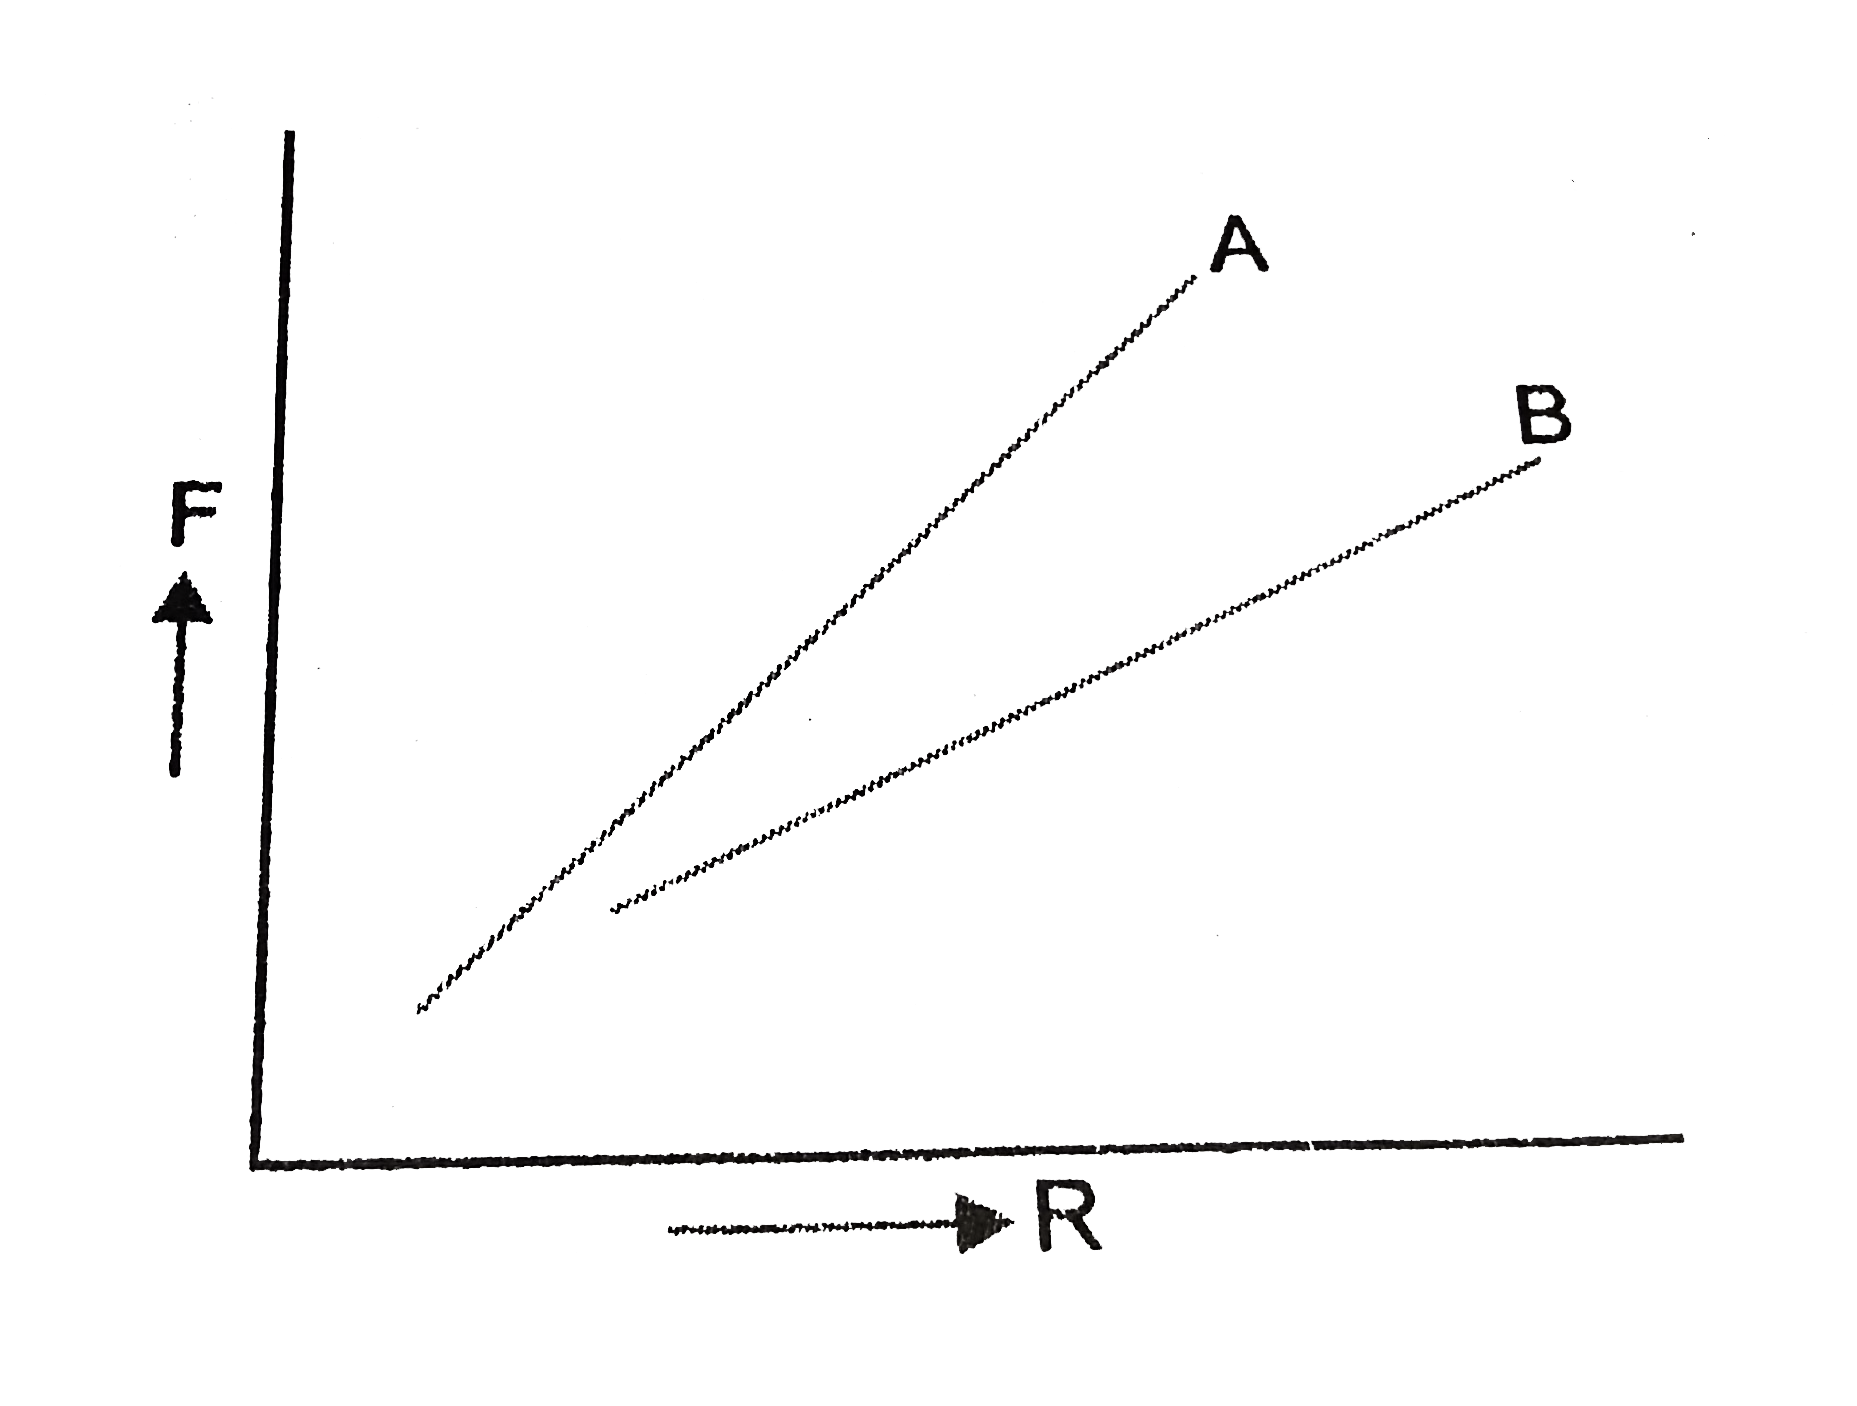
For two bodies A and B of same material held on a horizontal plane force of limitting friction F varsus normal reaction R graphs are as shown in Which one has smoother surface in contact with the plane .
 .AABBCBoth A and BDNeither A nor B
Friction between any two surfaces in contact is the force that opposes the relative motion between them The force of limiting friction (F) between any two surfaces in contact is directly proportional to the normal reaction (R) between them F∝R or F=μR where μ is coefficient of limiting friction If θ is angle of friction then μ=tanθ
A force of 49N is just able to move a block of wood weighing 10kg on a rough horizontal surface The coefficient of friction is .A0.5B4.9C10/49D49/9.8Friction between any two surfaces in contact is the force that opposes the relative motion between them The force of limiting friction (F) between any two surfaces in contact is directly proportional to the normal reaction (R) between them F∝R or F=μR where μ is coefficient of limiting friction If θ is angle of friction then μ=tanθ
A horizontal force of 1.2kg is applied on a 1.5kg block which rests on a horizontal surface If the coefficient of friction is 0.3 force of friction is .A0.45kgfB1.2kgfC1.5kgfD0.3kgf
Friction between any two surfaces in contact is the force that opposes the relative motion between them The force of limiting friction (F) between any two surfaces in contact is directly proportional to the normal reaction (R) between them F∝R or F=μR where μ is coefficient of limiting friction If θ is angle of friction then μ=tanθ
The angle of friction in the above question is .
View SolutionFriction between any two surfaces in contact is the force that opposes the relative motion between them The force of limiting friction (F) between any two surfaces in contact is directly proportional to the normal reaction (R) between them F∝R or F=μR where μ is coefficient of limiting friction If θ is angle of friction then μ=tanθ
The acceleration produce in the block in the above question is .
View SolutionThis section contains Assertion (A) and Reason (R) type questions. Each question has 4 choices (a), (b), (c) and (d), out of which only one is correct
42. Assertion (A) Coefficient of friction can be greater than unity.
Reason (R) Coefficient of friction is the ratio of force of friction and normal reaction which cannot exceed unity.
View Solution(A) : Friction forces does not depend on visible area of contact .
(R) : Limiting friction force is dependent on normal reaction .
View SolutionThis section contains Assertion (A) and Reason (R) type questions. Each question has 4 choices (a), (b), (c) and (d), out of which only one is correct
40. Assertion (A) During a turn, the value of centripetal force should be less than the limiting frictional force
Reason (R) The centripetal force is provided by the frictional force between the tyre and the road.
View Solution

