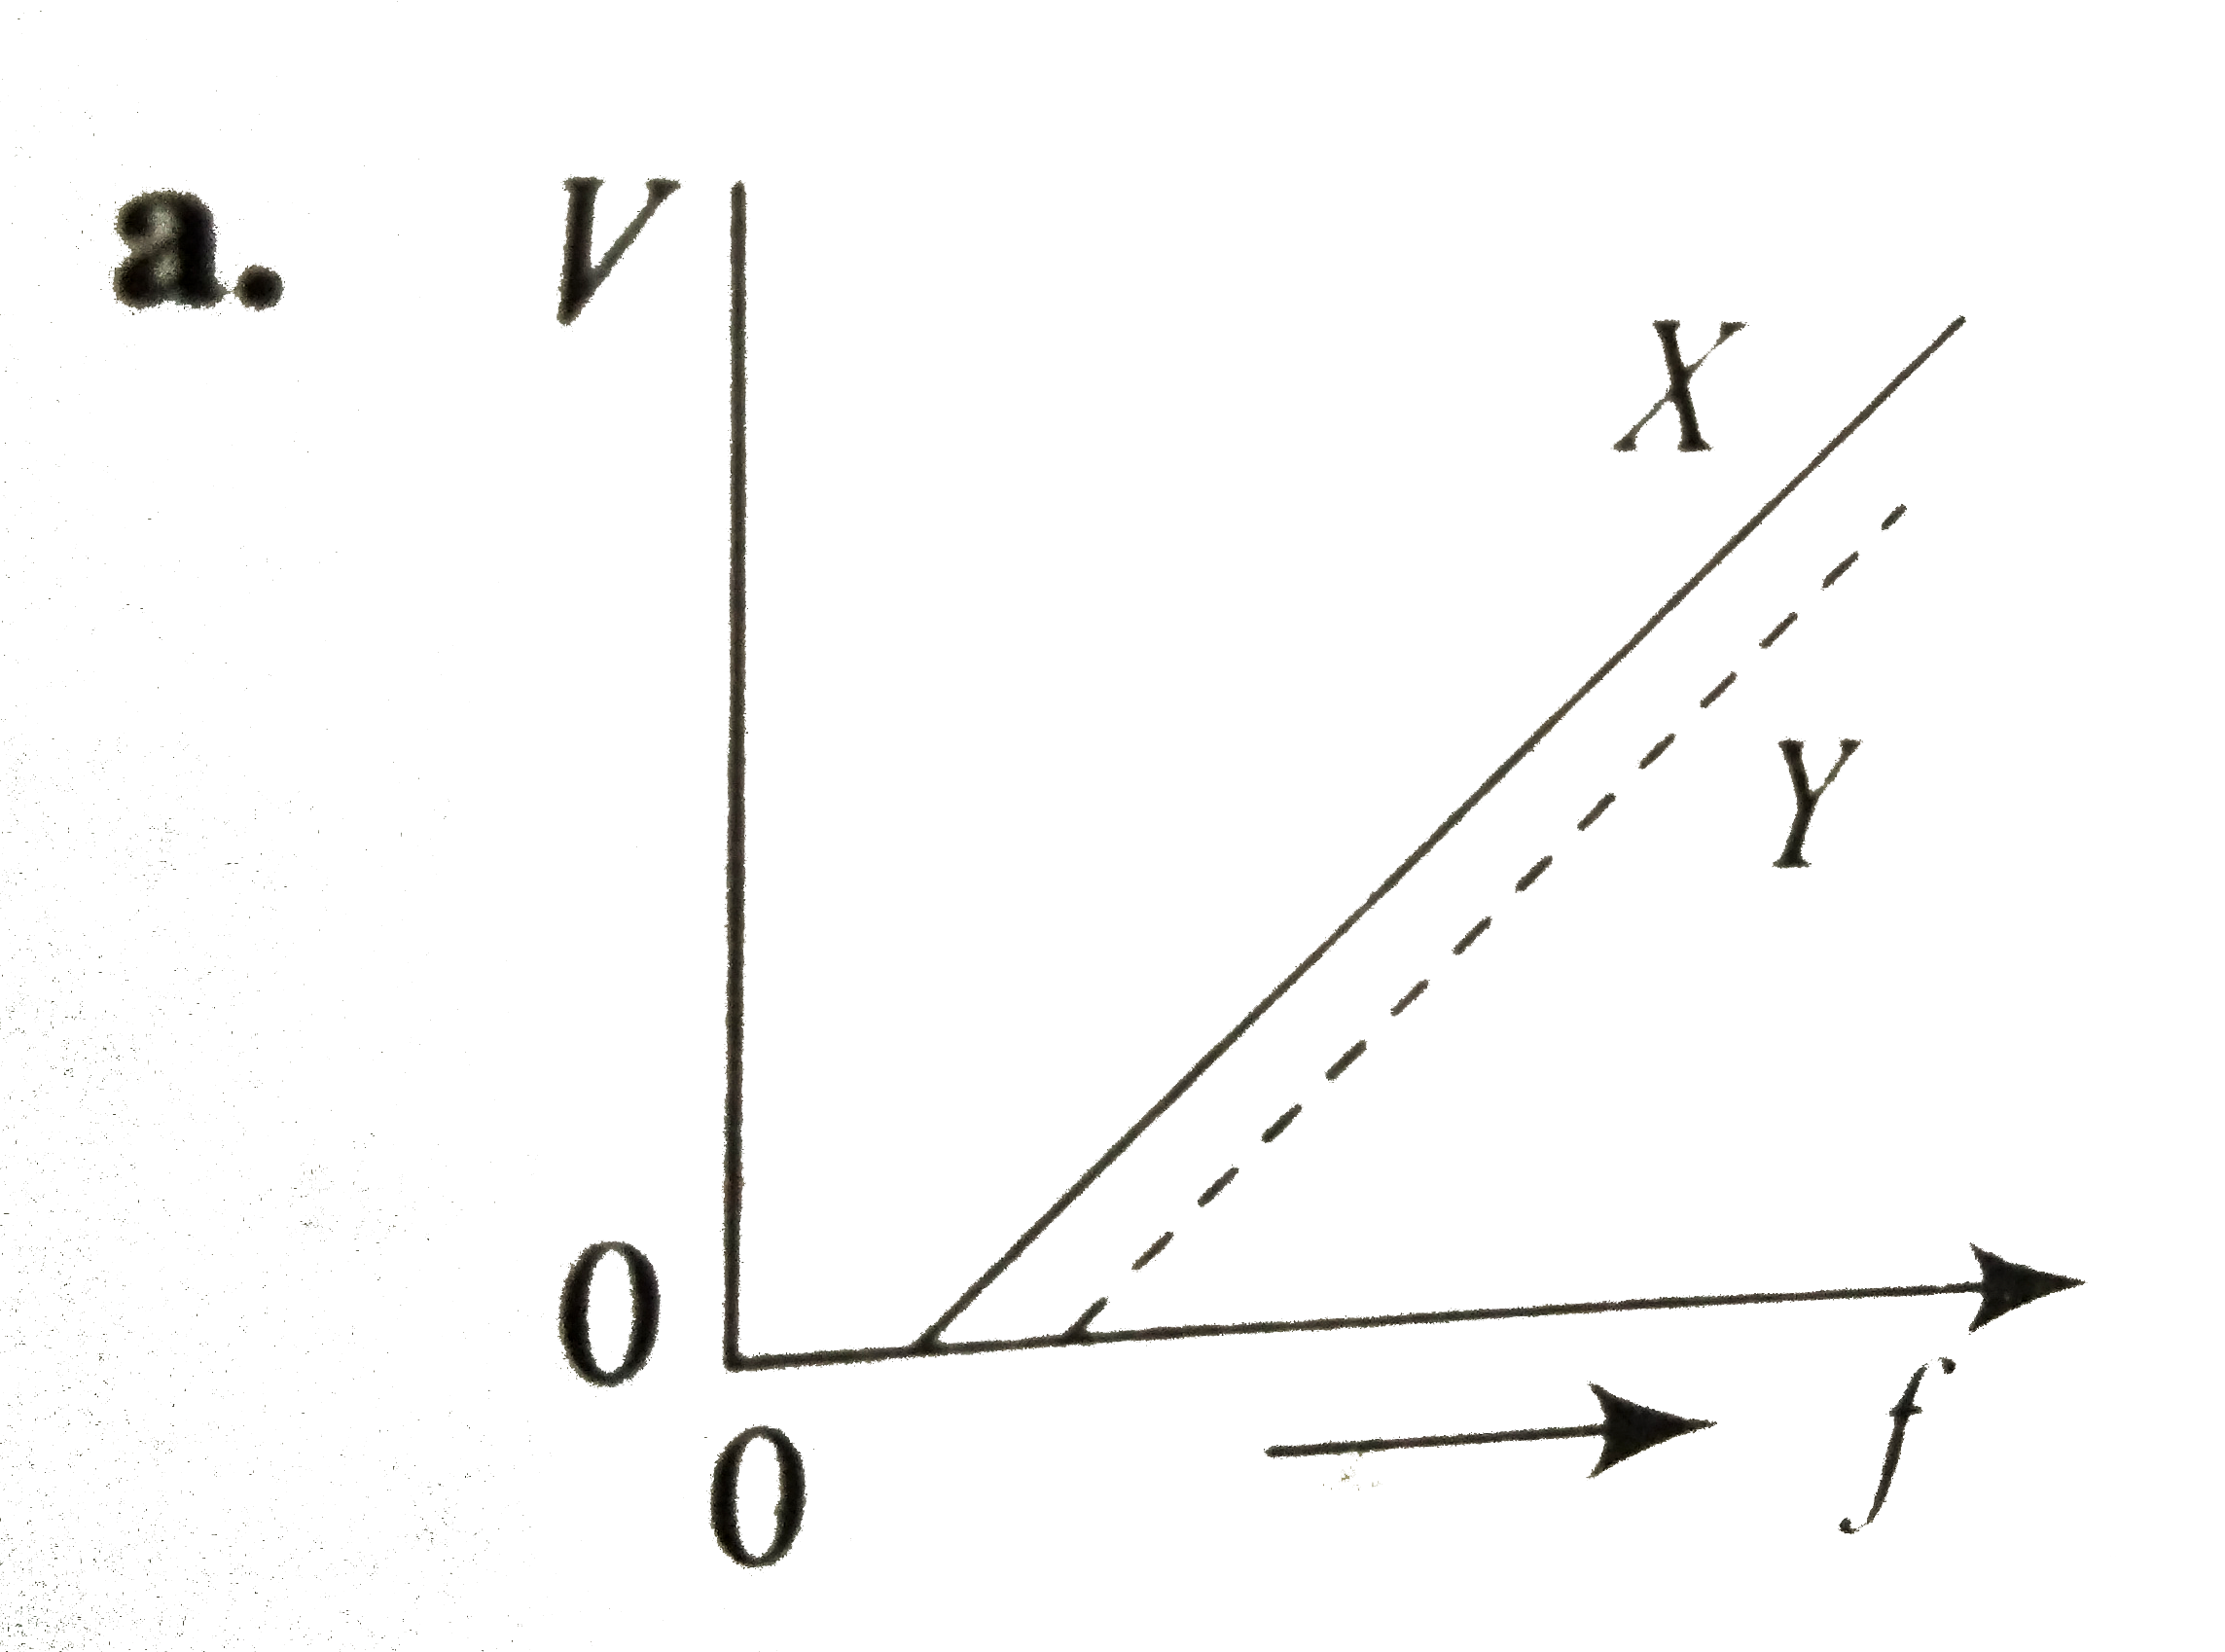
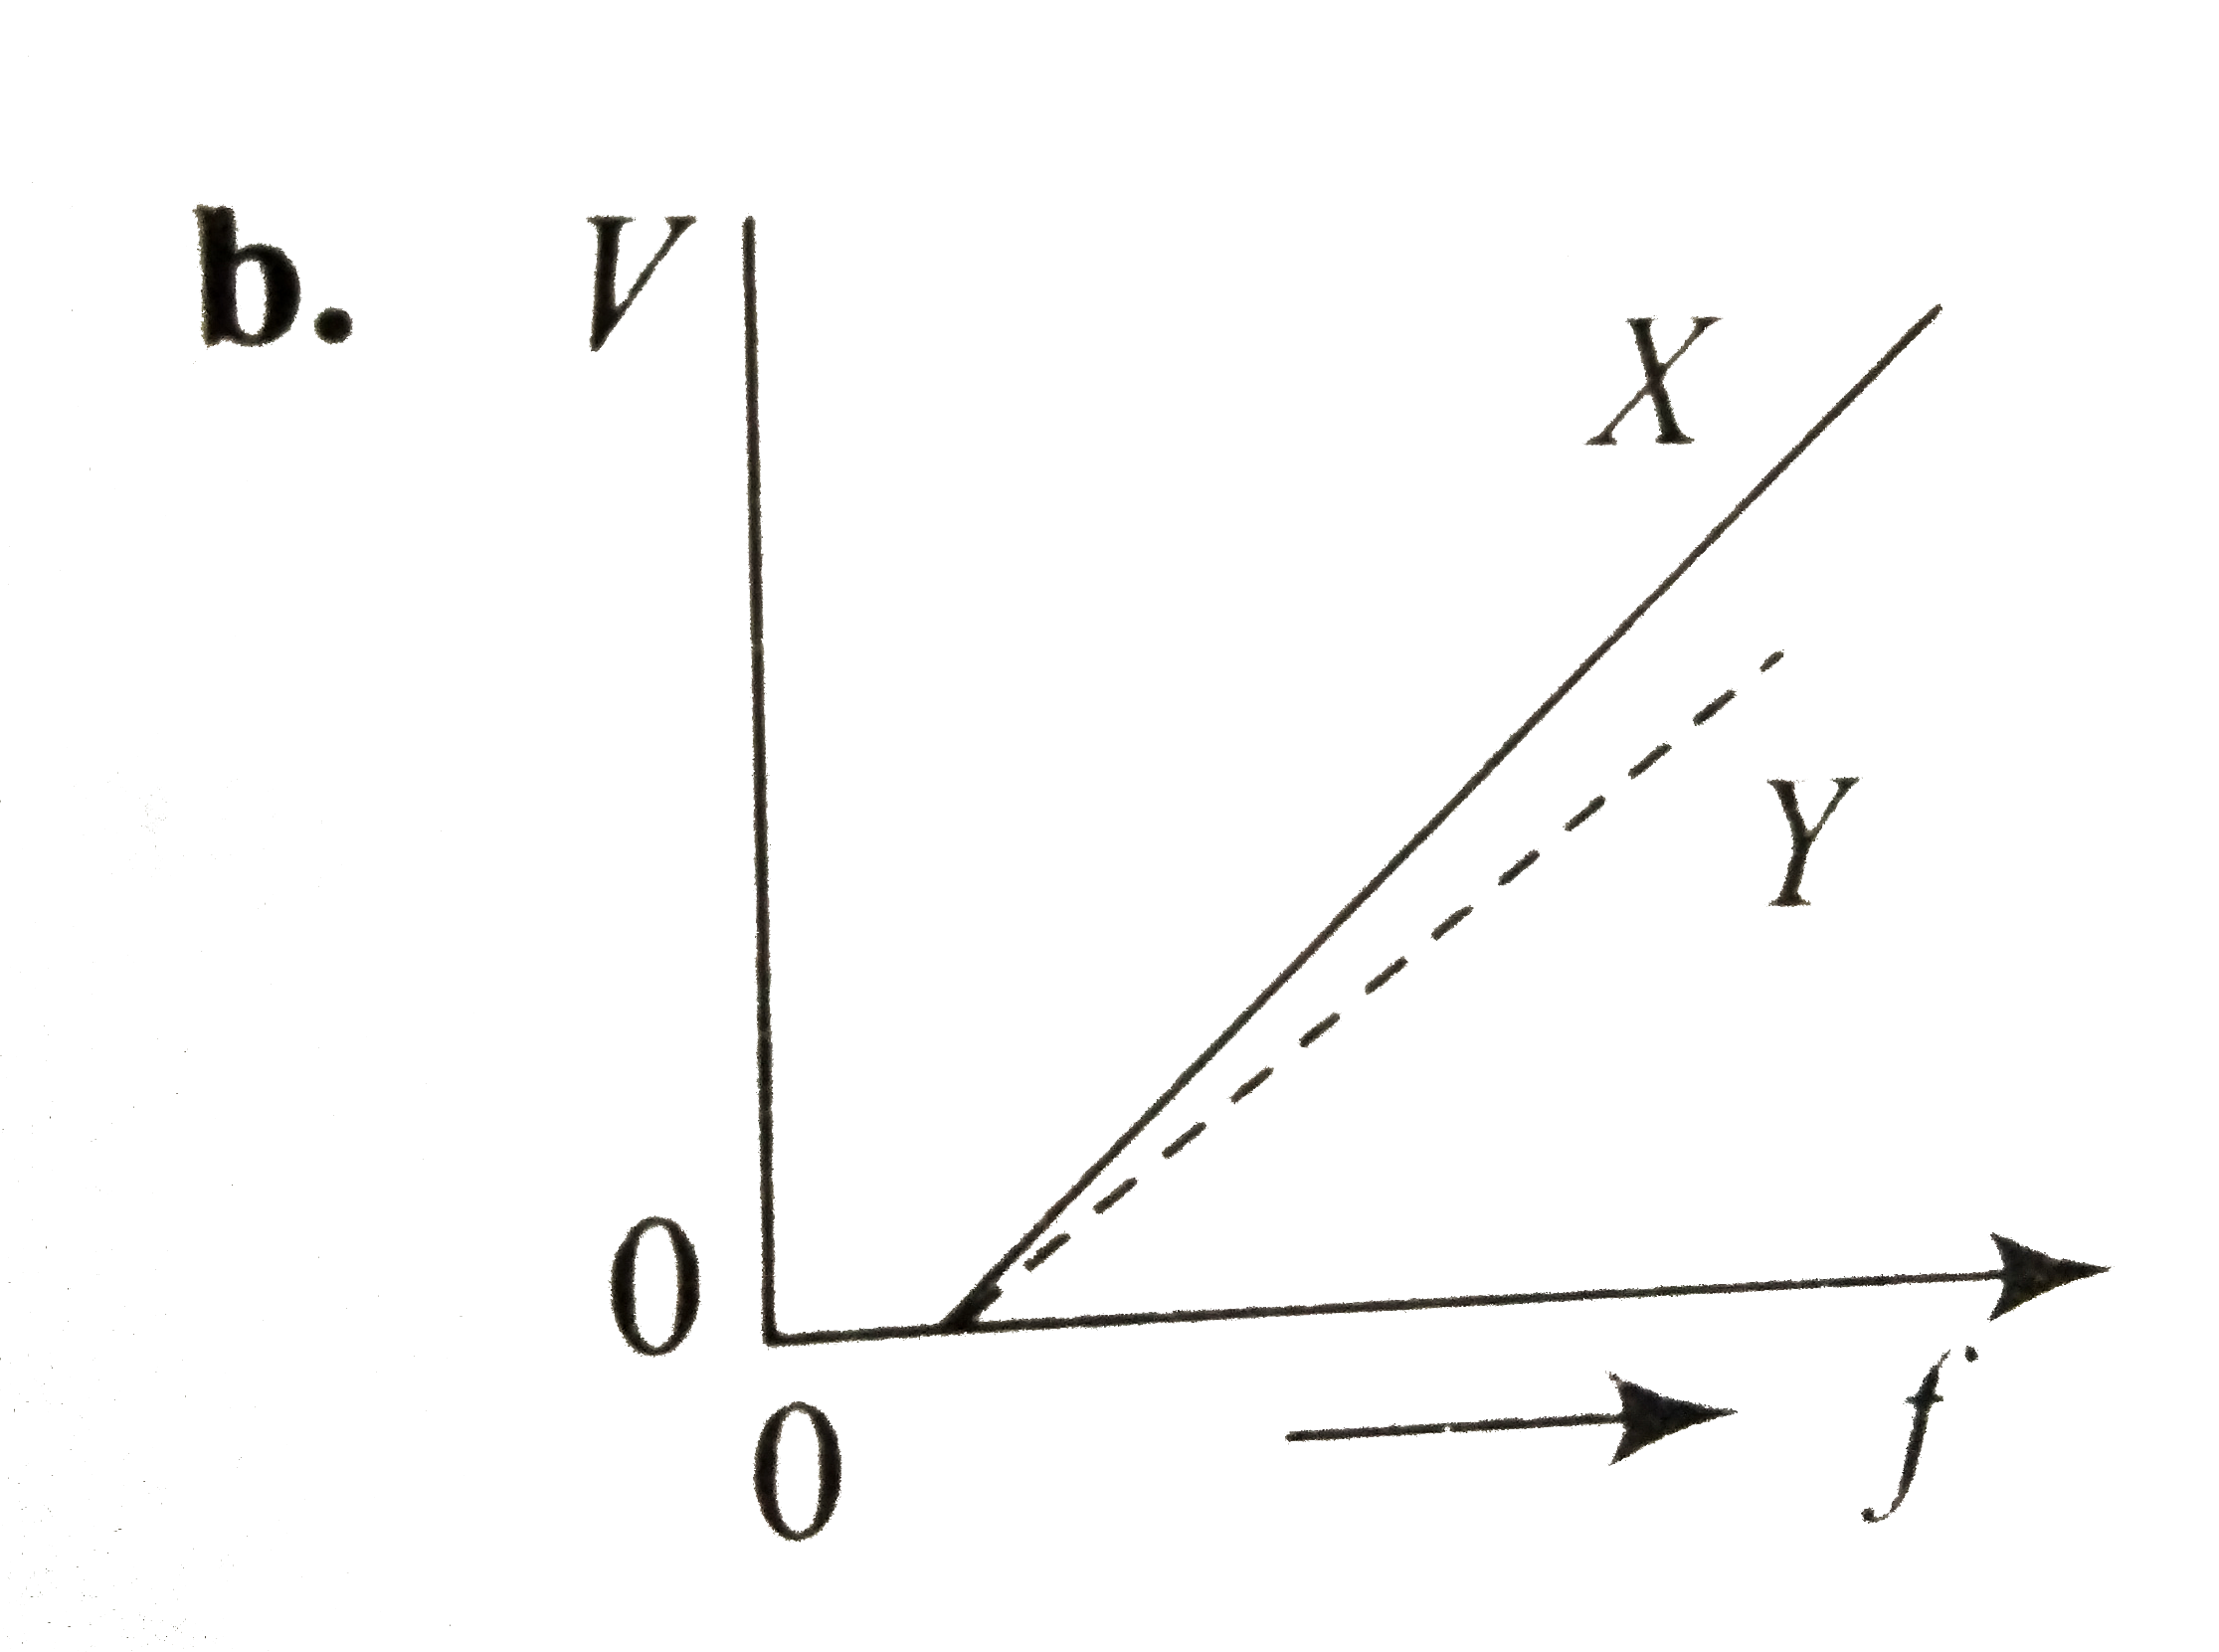
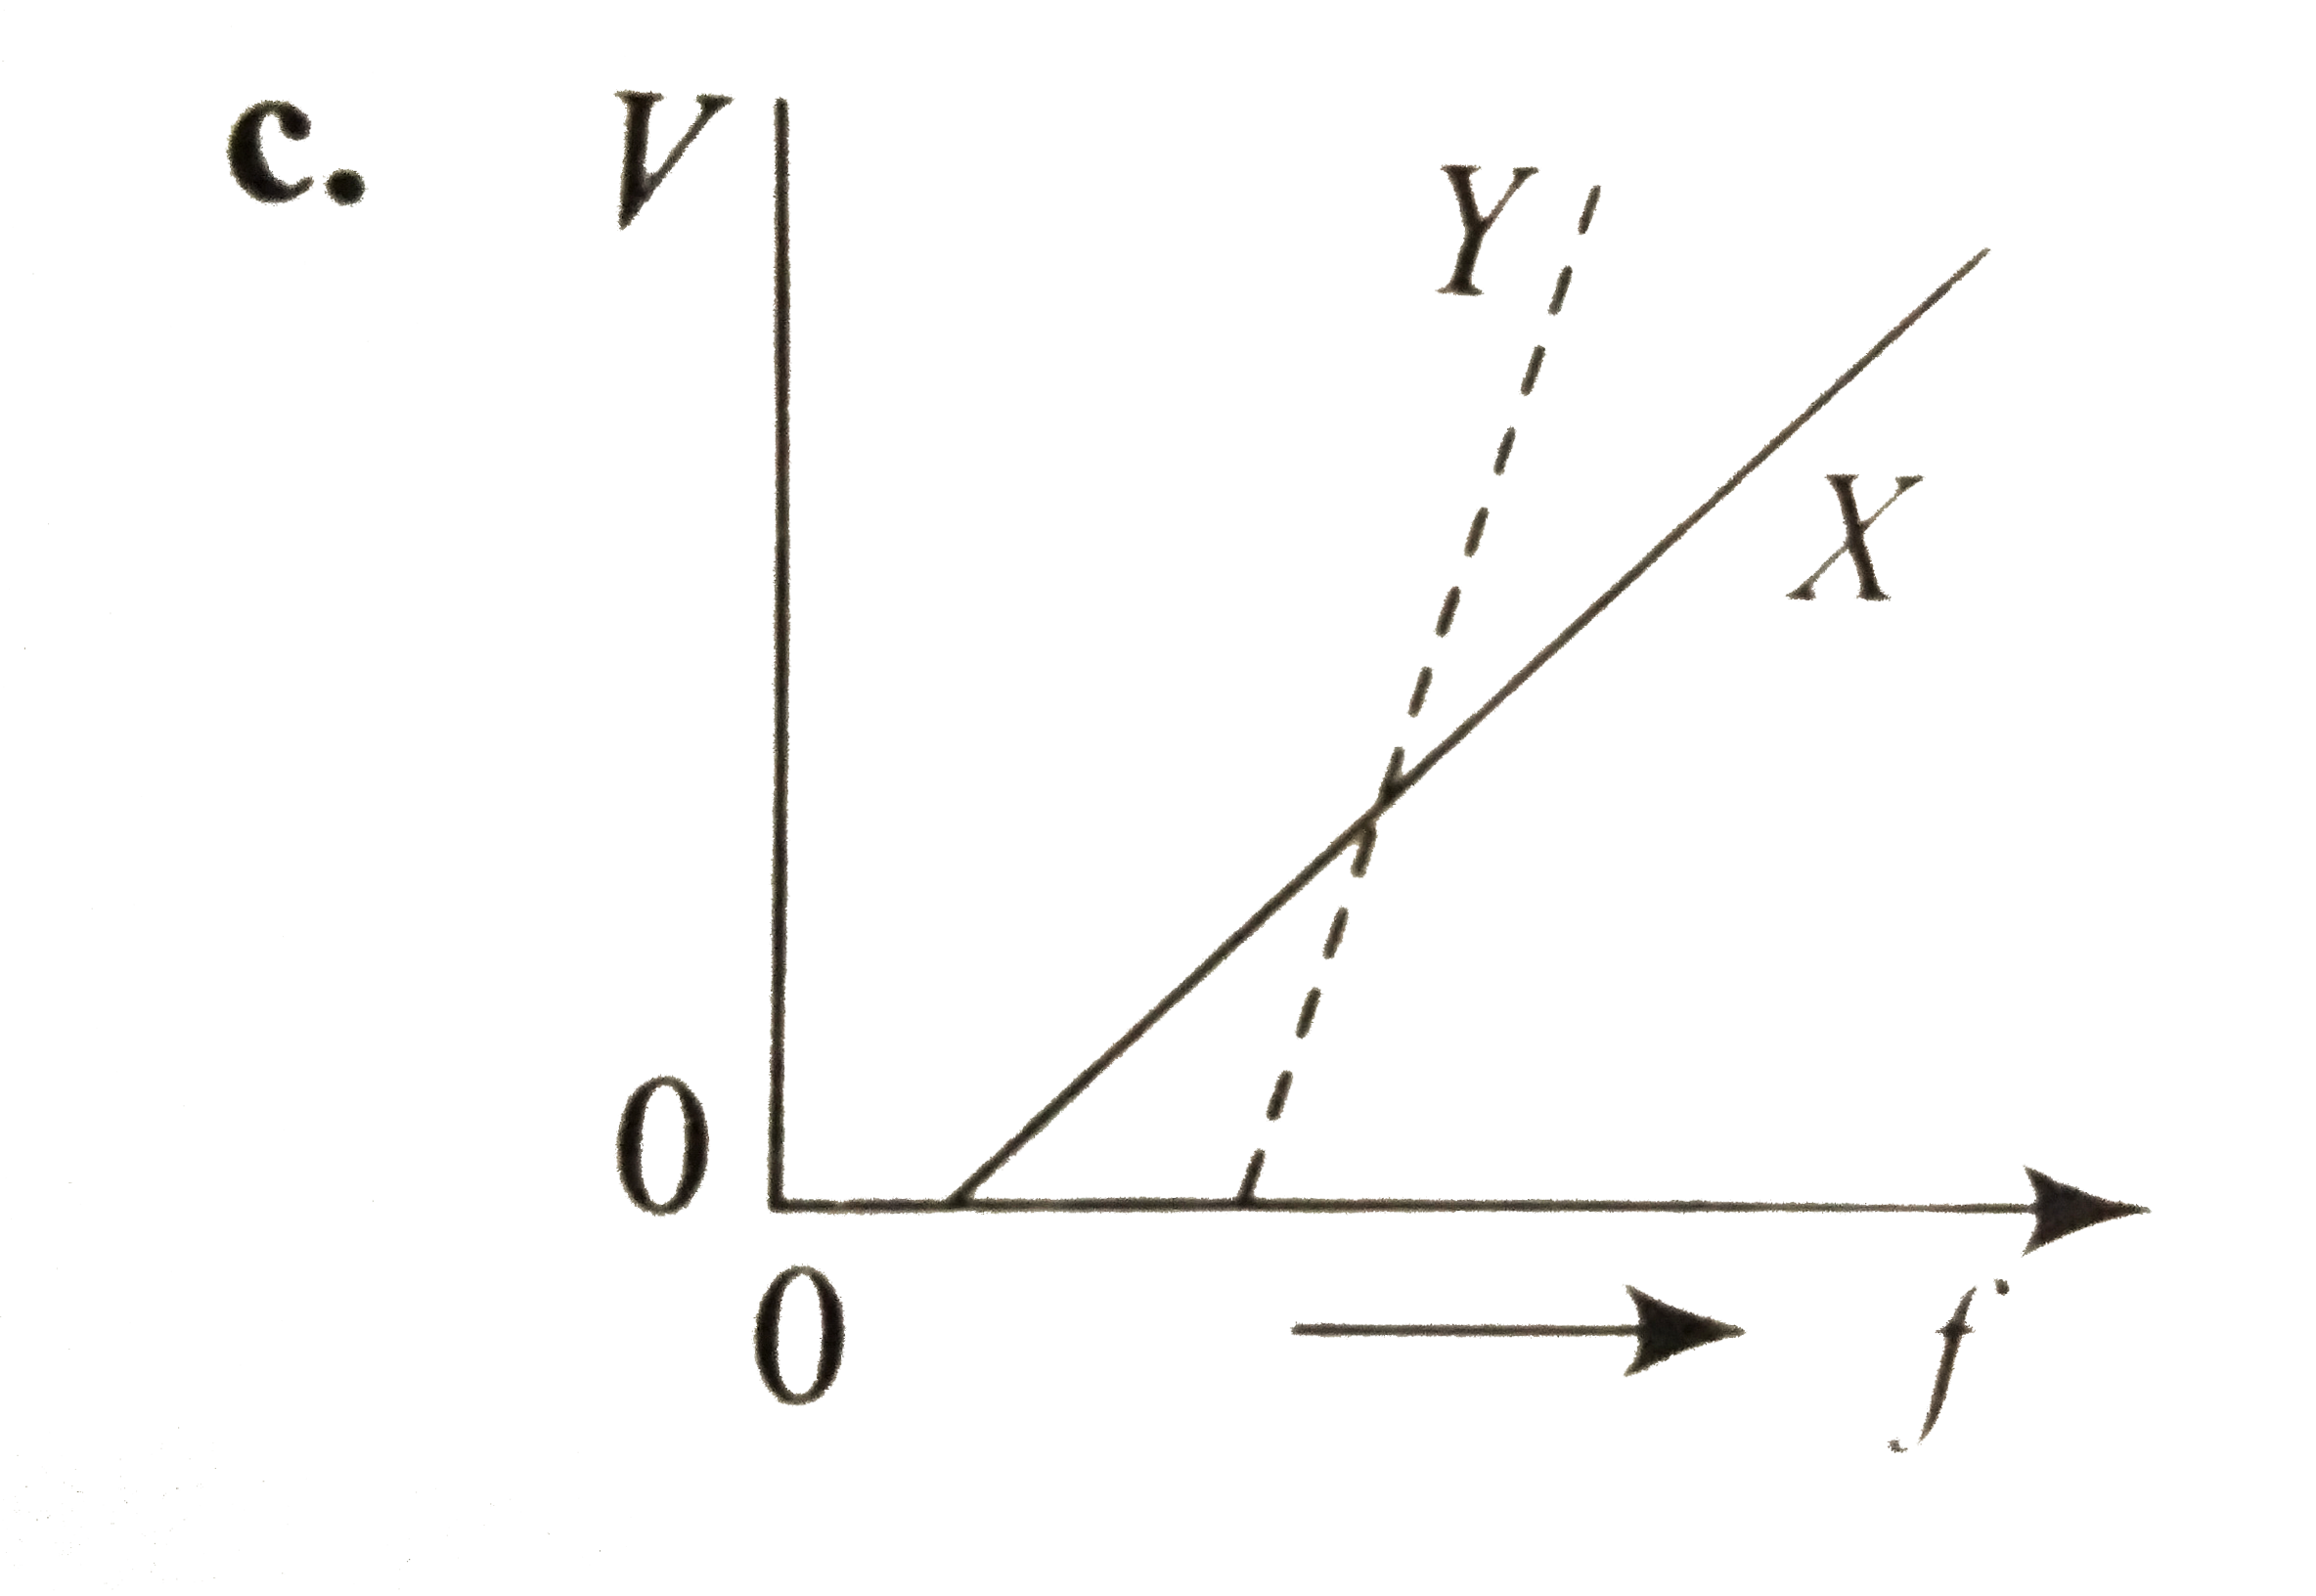
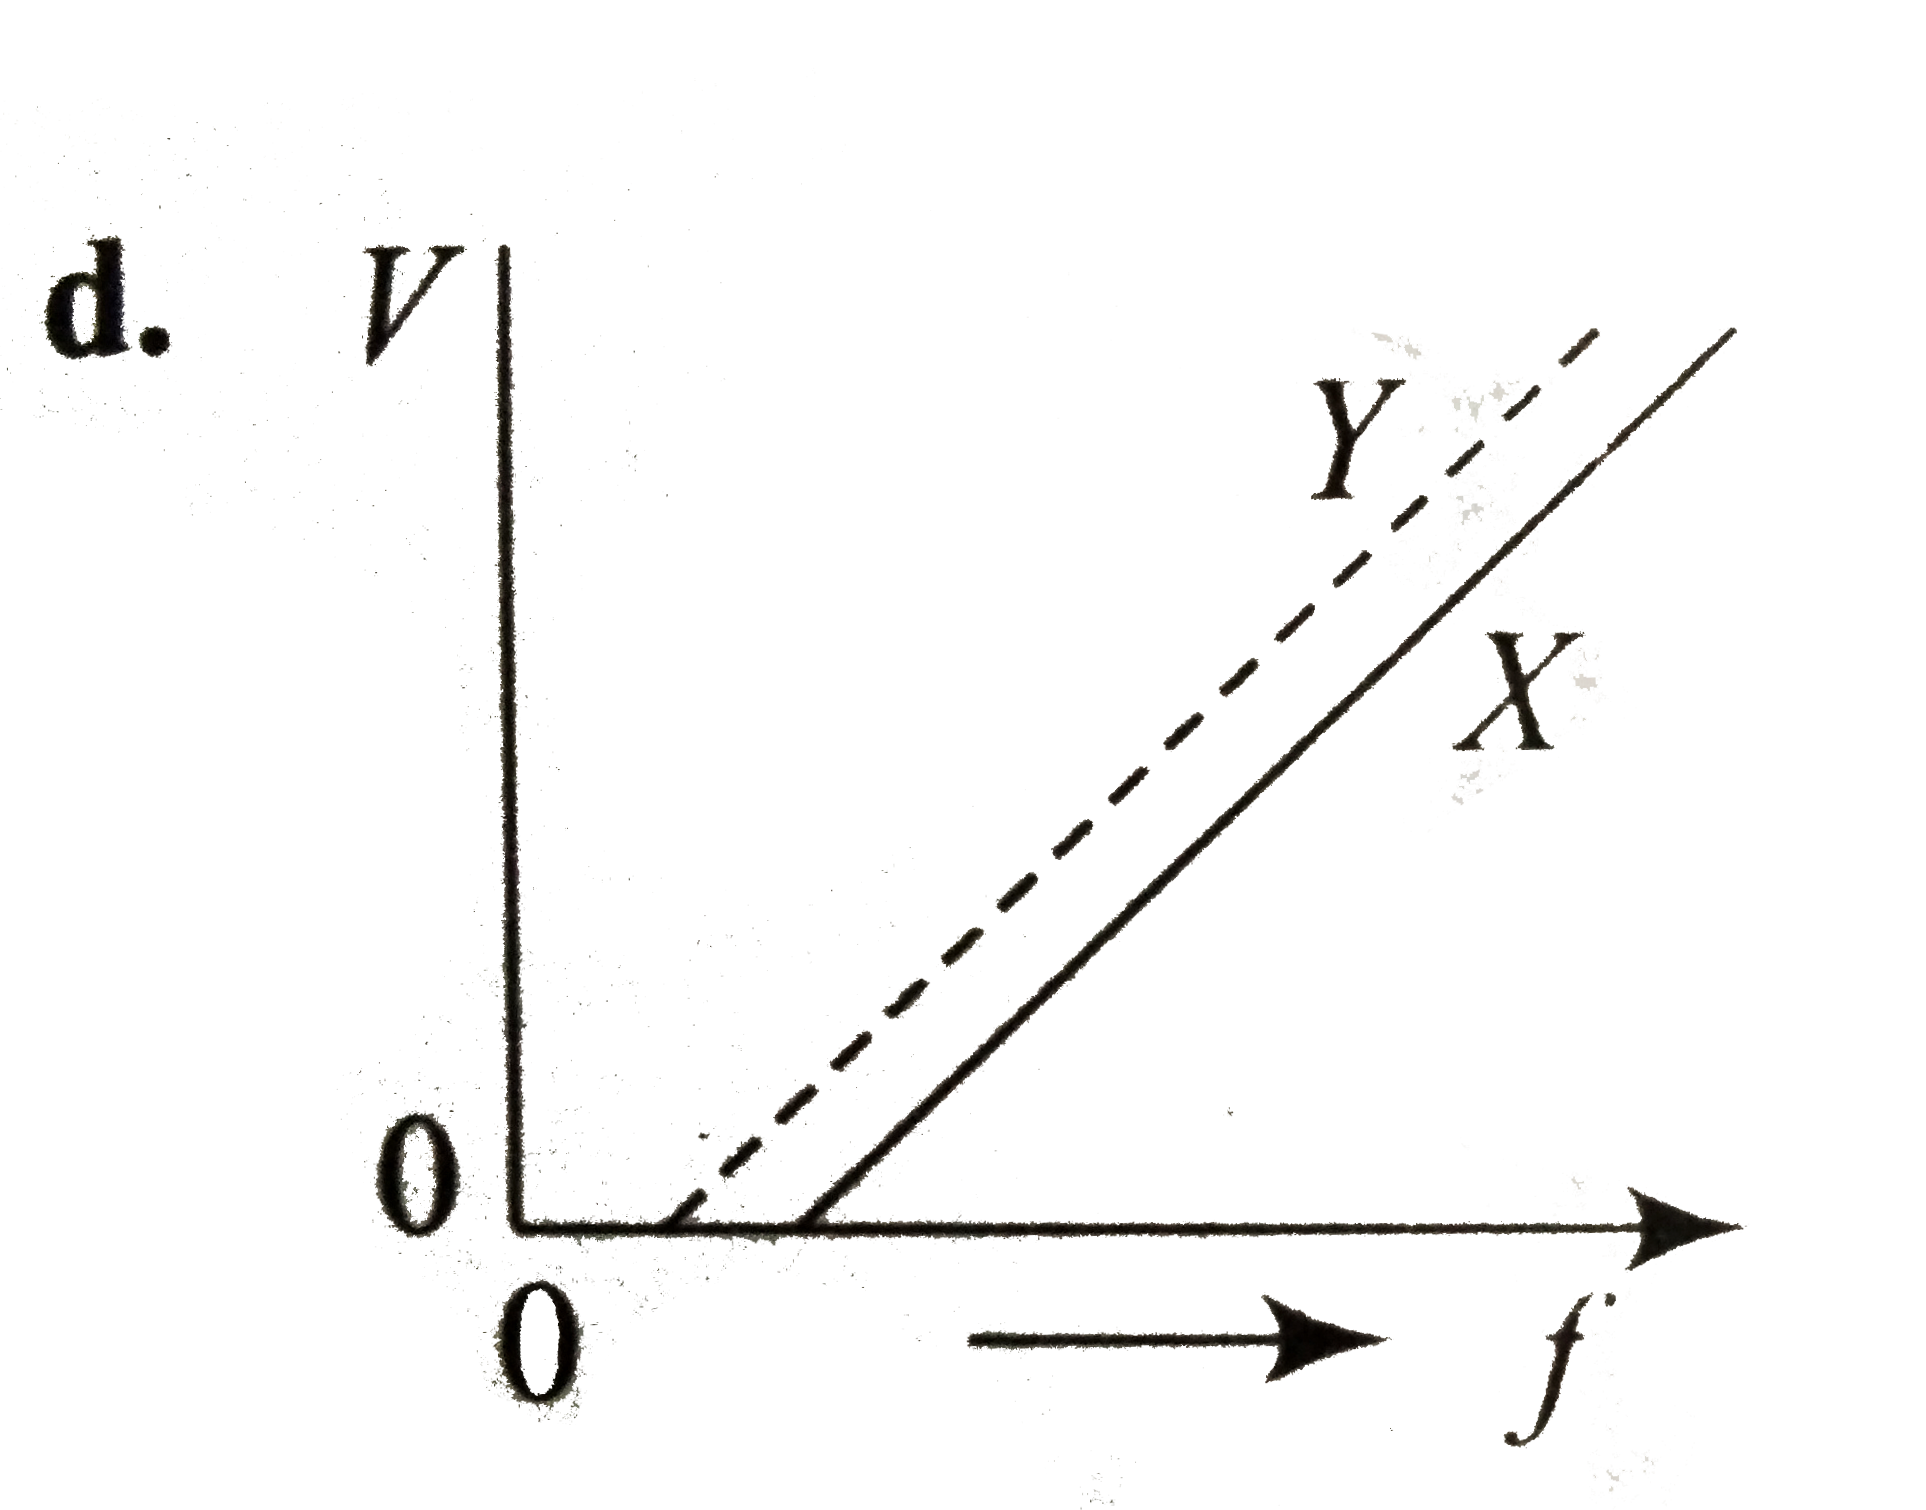
In a photoelectric emission, electrons are ejected from metals X and Y by light of frequency f. The potential difference V required to stop the electrons is measured for various frequencies.. If Y has a greater work function than X, which graph illustrates the expected results?


The correct Answer is:A
To solve the problem regarding the photoelectric emission from metals X and Y, we need to analyze the relationship between the stopping potential (V) and the frequency (f) of the incident light. Here are the steps to arrive at the solution:
Step 1: Understand the Work Function
The work function (φ) of a metal is the minimum energy required to eject an electron from the surface of that metal. It is related to the threshold frequency (ν₀) by the equation:
ϕ=hν0
where h is Planck's constant.
Given that metal Y has a greater work function than metal X, we can express this as:
ϕY>ϕX
This implies:
hν0Y>hν0X
Thus, the threshold frequency for metal Y is greater than that for metal X:
ν0Y>ν0X
Step 2: Einstein's Photoelectric Equation
The stopping potential (V) is related to the frequency of the incident light (f) by Einstein's photoelectric equation:
eV=hf−ϕ
where e is the charge of the electron.
For metals X and Y, we can write:
1. For metal X:
eVX=hf−hν0X
Rearranging gives:
VX=hfe−hν0Xe
2. For metal Y:
eVY=hf−hν0Y
Rearranging gives:
VY=hfe−hν0Ye
Step 3: Analyze the Graphs
From the equations derived, we can see that both VX and VY are linear functions of frequency f with the same slope of he. However, the y-intercepts will differ due to the different work functions (or threshold frequencies).
- The y-intercept for metal X will be at −hν0Xe.
- The y-intercept for metal Y will be at −hν0Ye.
Since ν0Y>ν0X, the y-intercept for metal Y will be lower than that for metal X.
Step 4: Conclusion
The graph that illustrates the expected results will show:
- Both lines having the same slope (indicating the same value of he).
- The line for metal Y starting at a lower value on the V-axis (indicating a higher threshold frequency).
Final Answer
The correct graph will depict two straight lines with the same slope, where the line for metal Y is positioned lower than that for metal X on the V-axis.
---
The work function (φ) of a metal is the minimum energy required to eject an electron from the surface of that metal. It is related to the threshold frequency (ν₀) by the equation:
ϕ=hν0
where h is Planck's constant.
ϕY>ϕX
This implies:
hν0Y>hν0X
Thus, the threshold frequency for metal Y is greater than that for metal X:
ν0Y>ν0X
The stopping potential (V) is related to the frequency of the incident light (f) by Einstein's photoelectric equation:
eV=hf−ϕ
where e is the charge of the electron.
1. For metal X:
eVX=hf−hν0X
Rearranging gives:
VX=hfe−hν0Xe
2. For metal Y:
eVY=hf−hν0Y
Rearranging gives:
VY=hfe−hν0Ye
From the equations derived, we can see that both VX and VY are linear functions of frequency f with the same slope of he. However, the y-intercepts will differ due to the different work functions (or threshold frequencies).
- The y-intercept for metal Y will be at −hν0Ye.
The graph that illustrates the expected results will show:
- Both lines having the same slope (indicating the same value of he).
- The line for metal Y starting at a lower value on the V-axis (indicating a higher threshold frequency).
The correct graph will depict two straight lines with the same slope, where the line for metal Y is positioned lower than that for metal X on the V-axis.
Topper's Solved these Questions
- PHOTOELECTRIC EFFECTBOOK - CENGAGE PHYSICS ENGLISHCHAPTER - PHOTOELECTRIC EFFECTEXERCISE - Multiple Correct
10 Videos
- PHOTOELECTRIC EFFECTBOOK - CENGAGE PHYSICS ENGLISHCHAPTER - PHOTOELECTRIC EFFECTEXERCISE - Linked Comprehension
44 Videos
- PHOTOELECTRIC EFFECTBOOK - CENGAGE PHYSICS ENGLISHCHAPTER - PHOTOELECTRIC EFFECTEXERCISE - Subjective
16 Videos
- NUCLEAR PHYSICSBOOK - CENGAGE PHYSICS ENGLISHCHAPTER - NUCLEAR PHYSICSEXERCISE - ddp.5.5
14 Videos
- RAY OPTICSBOOK - CENGAGE PHYSICS ENGLISHCHAPTER - RAY OPTICSEXERCISE - DPP 1.6
12 Videos
Similar Questions
In photoelectric emission process from a metal of work function 1.8eV , the kinetic energy of most energetic electrons is 0.5eV. The corresponding stopping potential is
View SolutionFind the retarding potential requred to stop the escape of photo electrons from the metal surface of work function 1.07 eV , which is irradiated with light of wavelength 332 mn
View SolutionThe threshold wavelength for ejection of electrons from a metal is 430 nm. The work function for the photoelectric emission from the metal is
View SolutionThe threshold wavelength for ejection of electrons from a metal is 250 nm. The work function for the photoelectric emission from the metal is
View SolutionThe threshold wavelength for ejection of electrons from a metal is 300 nm. The work function for the photoelectric emission from the metal is
View SolutionThe threshold wavelength for ejection of electrons from a metal is 230 nm. The work function for the photoelectric emission from the metal is
View SolutionThe threshold wavelength for ejection of electrons from a metal is 330 nm. The work function for the photoelectric emission from the metal is
View SolutionThe threshold wavelength for ejection of electrons from a metal is 650 nm. The work function for the photoelectric emission from the metal is
View SolutionThe threshold wavelength for ejection of electrons from a metal is 450 nm. The work function for the photoelectric emission from the metal is
View SolutionThe threshold wavelength for ejection of electrons from a metal is 150 nm. The work function for the photoelectric emission from the metal is
View Solution
