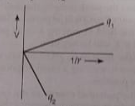
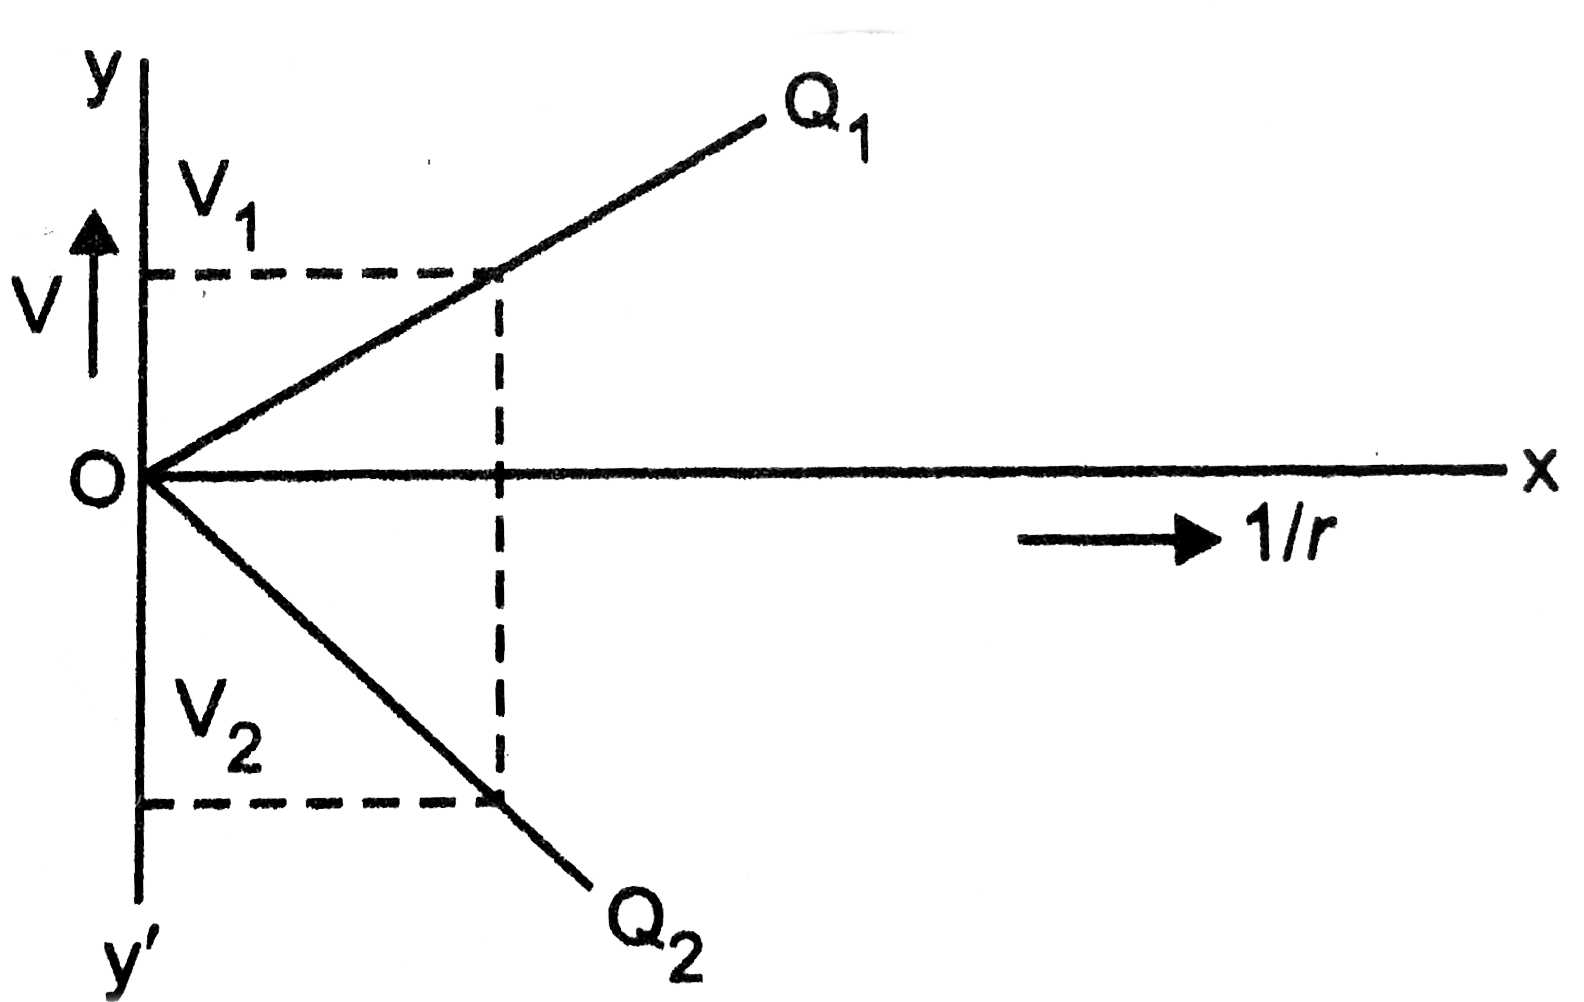
In figure, the two graphs show the variation of electrostatic potential (V) with 1/r (r being distance of the field point form the point charge) for two point charges q1andq2
 Which of the two charges has a larger magnitude and why?Solution in Punjabi
Step by step video & image solution for In figure, the two graphs show the variation of electrostatic potential (V) with 1/r (r being distance of the field point form the point charge) for two point charges q_1 and q_2 Which of the two charges has a larger magnitude and why? by Physics experts to help you in doubts & scoring excellent marks in Class 12 exams.
Updated on:21/07/2023Topper's Solved these Questions
Similar Questions
Find an expression for line integral of electric intensity.
View SolutionIn defining electric field due to a point charge, the test charge has to be vanishingly small. How this condition can be justified, when we know that charge less than the on an electron or a proton is not possible?
View SolutionState and explain Kirchhoff's laws.
View SolutionTwo point charges Q_1 and Q_2 lie along a line at a distance from each other. Figure 3.7 shows the potential variation along the line of charges. At which of the points 1, 2, and 3 is the electric field zero ? What are the singns of the charges Q_1 and Q_2 and which of the two charges is greater in magnitude ? .
View SolutionTwo point charges q_1 and q_2 are placed in an external uniform electric field as shown in figure. The potential at the location of q_1 and q_2 are V_1 and V_2 , i.e., V_1 and V_2 are potentials at location of q_1 and q_2 due to external unspecified charges only. Then electric potential energy for this configuration of two charged particle is
View SolutionFig.1 shows the variation of electric potential V with 1/r, where r is the distance from the two charges Q1andQ2. Determine

(i) signs of two charges Q1andQ2
(ii) Which of the two charges has a larger magnitude ? Justify.
View SolutionTwo charge +q_1 and +q_2 placed on x-axis at posiution A and B as shown in figure. Which graph best represent potential as a function of distance r from charge q_1
View SolutionTwo graphs drawn in Fig. 3.38, two point charges q_(1) And q_(2) For the electrostatic potential, we show the change of V with (1 / r) (here r is the distance from the point charge to the area point). (a) What are the signs of both charges? (b) Which of the two charges has a larger magnitude and why?
View SolutionDraw a graph for variation of potential V with distance r for a point charge Q.
View SolutionTwo charge +q1 and +q2 placed on x-axis at posiution A and B as shown in figure. Which graph best represent potential as a function of distance r from charge q1

View SolutionIf two charges and q1are separated by a distance r, q2then potential energy of the system is
View SolutionTwo point charges q1 and q2 are separated by a distance r in space:-What happens to the force between the charges:-When the magnitude of the point charge Increases.
View SolutionTwo point charges q_1 and q_2 are separated by a distance r in space What happens to the force between the charges, i) When the magnitude of one of the point charges is doubled. ii) When the distance of separation is halved.
View SolutionTwo point charges Q_1 and Q_2 lie along a line at a distance from each other. Figure 3.7 shows the potential variation along the line of charges. At which of the points 1, 2, and 3 is the electric field zero ? What are the singns of the charges Q_1 and Q_2 and which of the two charges is greater in magnitude ? .
View SolutionTwo point charges q_1 and q_2 are placed in an external uniform electric field as shown in figure. The potential at the location of q_1 and q_2 are V_1 and V_2 , i.e., V_1 and V_2 are potentials at location of q_1 and q_2 due to external unspecified charges only. Then electric potential energy for this configuration of two charged particle is
View SolutionThe force between two point charges q_1 and q_2 separated by a distance r is F = (k q_1 q_2)/(r^2) where k is a constant. Find the potential energy of the system of charges.
View Solution
