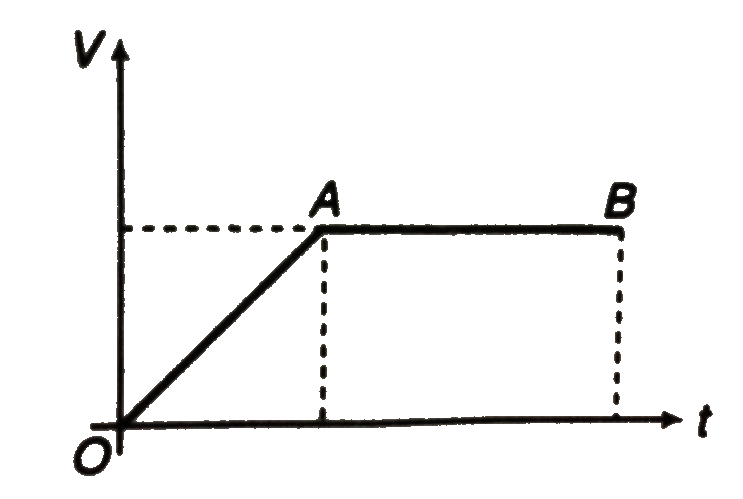
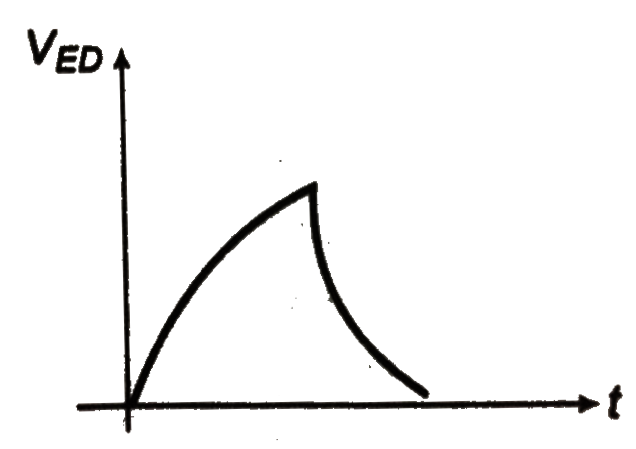
In the above problem if given graph is between VAB and time. Then plot graph between VED and time.
The correct Answer is:A
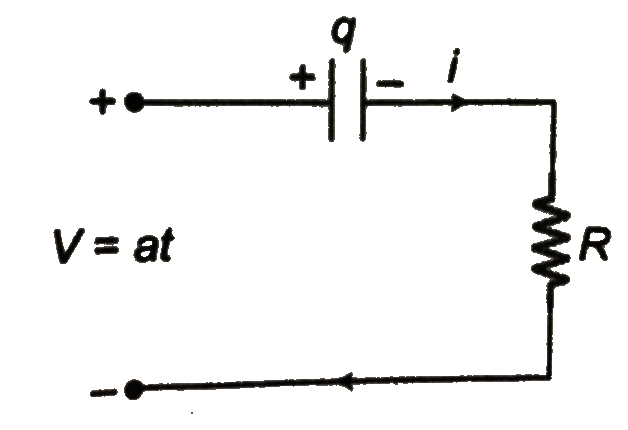
From O to A V=at
∴At=qC+iR
Differentiating w.r.t time we have
a=1C(dqdt)+(didt)R
or (di(dt)RR=a−iC (as i=dqdt)
∴∫i0dia−i/C=∫10dtR
∴i=aC(1−e−t/CR)
i.e. Curren in the circuit increases exponentially
∴VED=iR=aCR(1−e−t/CR)
or VED also increases exponentially
From A onwards When V=constant (sayV0)
V0=at or t=V0a
∴VED=aCR(1−e−V0/aCR)
After this VED will decrease exponentially.
Hence, a rough graph is as shown in figure.
Topper's Solved these Questions
- BOOK - DC PANDEYCHAPTER - CAPACITORSEXERCISE - OBJECTIVE_TYPE1videos
CAPACITORS
- BOOK - DC PANDEYCHAPTER - CAPACITORSEXERCISE - OBJECTIVE_TYPE1videos
CAPACITORS
- BOOK - DC PANDEYCHAPTER - ATOMSEXERCISE - MEDICAL ENTRANCES GALLERY42videos
ATOMS
- BOOK - DC PANDEYCHAPTER - COMMUNICATION SYSTEMEXERCISE - Subjective11videos
COMMUNICATION SYSTEM
Similar Questions
Knowledge Check
- Question 1 - Select One
The graph between E and v is
A B
B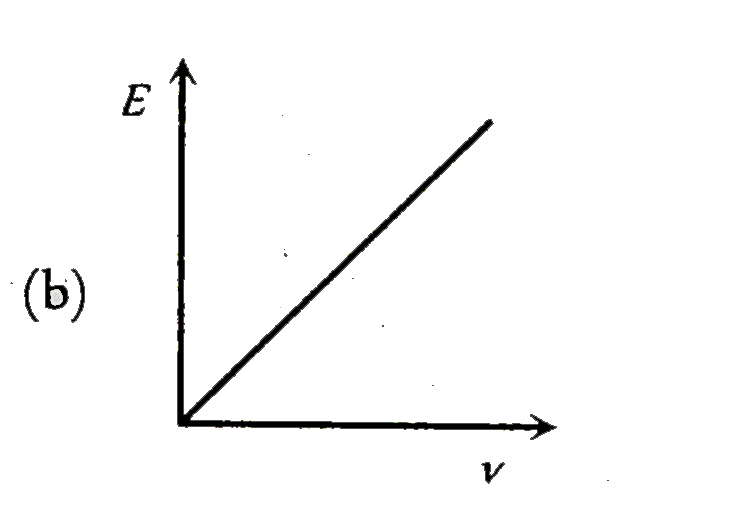 C
C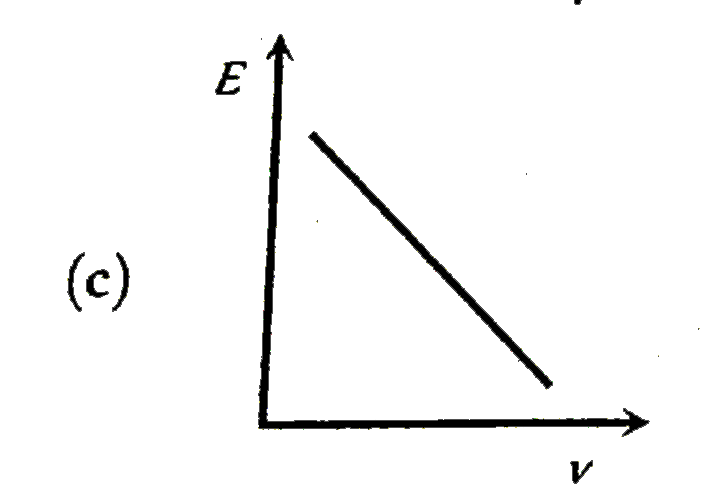 D
D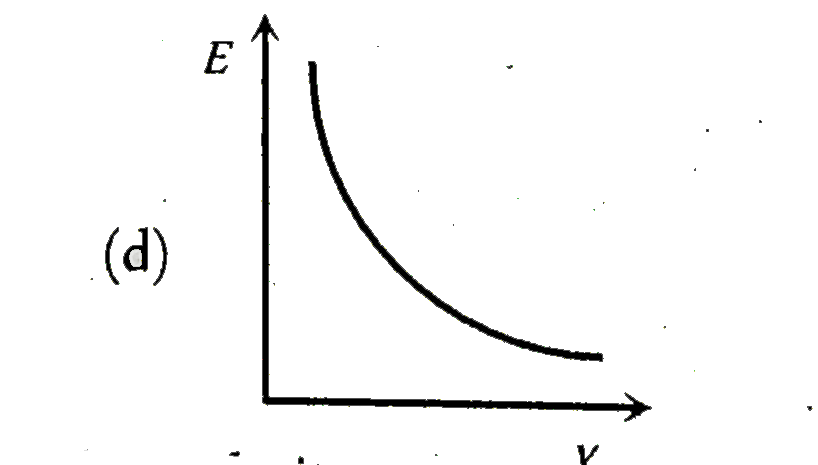
- Question 2 - Select One
The graph between E and v is
A B
B C
C D
D
- Question 3 - Select One
In the given isobaric process shown by graph between T and V.
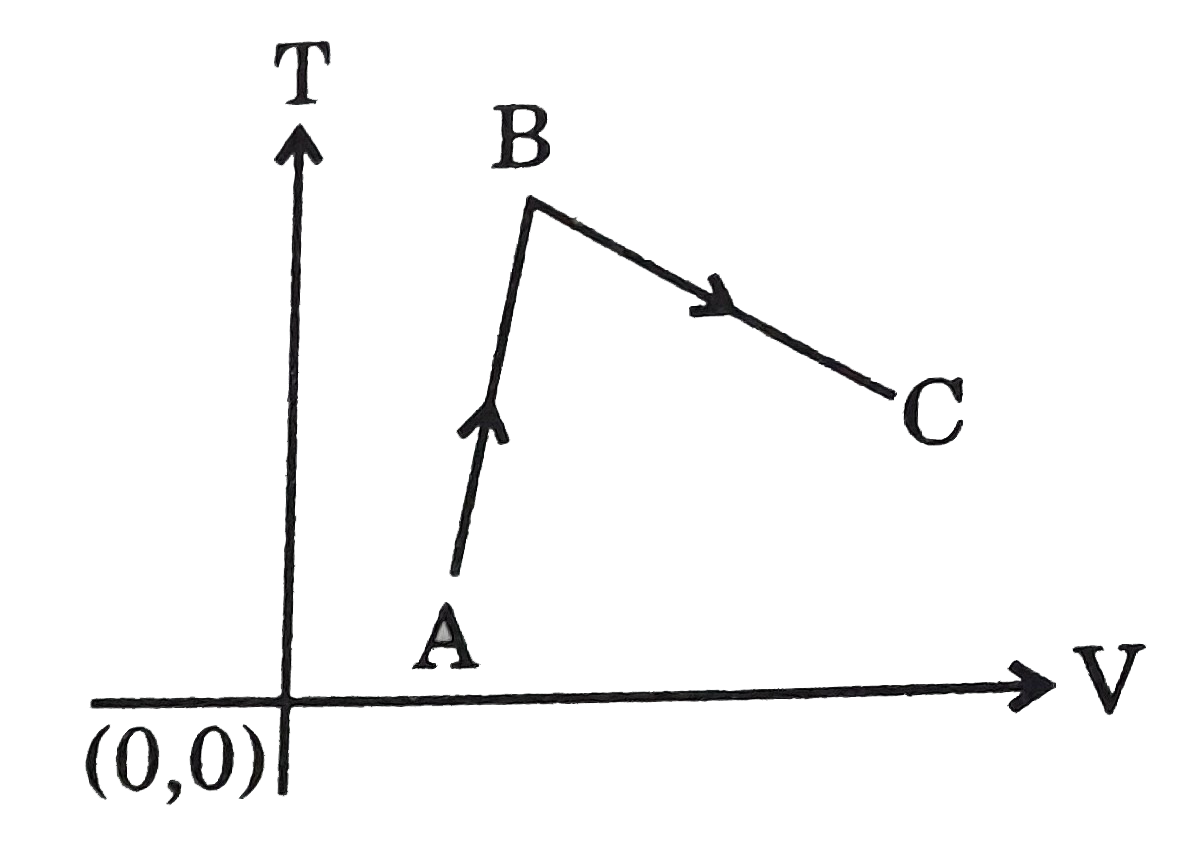 AMoles decreases throughoutBMoles first increases then deceasesCMoles first decreases then increasesDMoles cannot be predicted form given data
Which of the graph between velocity and time is correct ?
View SolutionWhich of the graph between acceleration and time is correct ?
View SolutionFor a simple pendulum the graph between length and time period will be
View SolutionUnder constant temperature, graph between P and 1/V is a
View SolutionGraphs are very useful to represent a physical situation. Various quantities can be easily represented on graphs and other quantites can be determined from the graph. For example the slope of velocity-time graph represents instantaneous acceleration. For a motion with constant acceleration slope of velocity-time graph is constant. If acceleration is changing with time, slope with change and thus velocity-time graph will be a non-linear curve. Further the area of velocity-time graph gives displacement.
The correct relation between v0,a1,a2andt0 isView Solution
