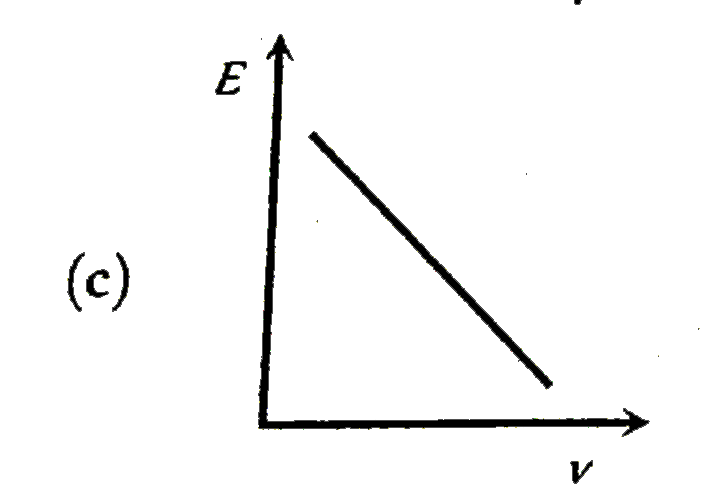
Under constant temperature, graph between P and 1/V is a
parabola
hyperbola
straight line
circle
The correct Answer is:C
Step by step video, text & image solution for Under constant temperature, graph between P and 1/V is a by Physics experts to help you in doubts & scoring excellent marks in Class 12 exams.
Topper's Solved these Questions
- BOOK - TARGET PUBLICATIONCHAPTER - KINETIC THEORY OF GASES AND RADIATION EXERCISE - critical thinking104videos
KINETIC THEORY OF GASES AND RADIATION
- BOOK - TARGET PUBLICATIONCHAPTER - KINETIC THEORY OF GASES AND RADIATION EXERCISE - Competitive thinking187videos
KINETIC THEORY OF GASES AND RADIATION
- BOOK - TARGET PUBLICATIONCHAPTER - INTERFERENCE AND DIFFRACTIONEXERCISE - EVALUATION TEST20videos
INTERFERENCE AND DIFFRACTION
- BOOK - TARGET PUBLICATIONCHAPTER - MAGNETIC EFFECT OF ELECTRIC CURRENTEXERCISE - EVALUATION TEST19videos
MAGNETIC EFFECT OF ELECTRIC CURRENT
Similar Questions
Knowledge Check
- Question 1 - Select One
Under constant pressure, graph between p and 1V is a
AparabolaBhyperbolaCstraight lineDcircle - Question 2 - Select One
The graph between E and v is
A B
B C
C D
D
- Question 3 - Select One
The graph between E and v is
A B
B C
C D
D
At constant temperature for given amount of an ideal gas the correct graph between PV vs P is
View SolutionFor a given exothermic reaction, KpandK′p are the equilibrium constants at temperatures T1andT2 respectively. Assuming that heat of reaction is constant in temperature range between T1andT2, it is readily water that
View SolutionAt constant temperature if a graph plotted between logP and log(1V) has an intercept of unity then what will be the value of constant (k)
View SolutionFor a given exothermic reaction , Kp and k'p are the equilibrium constants at temperatures T1 and T2 respectively. Assuming that heat of reaction is constant in temperature range reaction is constant in temperature range between T1andT2 , it is readily observed that
View SolutionFor one mole of ideal gas if P=P01+(VV0) where P0 and V0 are constant, then temperature of gas when V=V0 is:
View Solution

