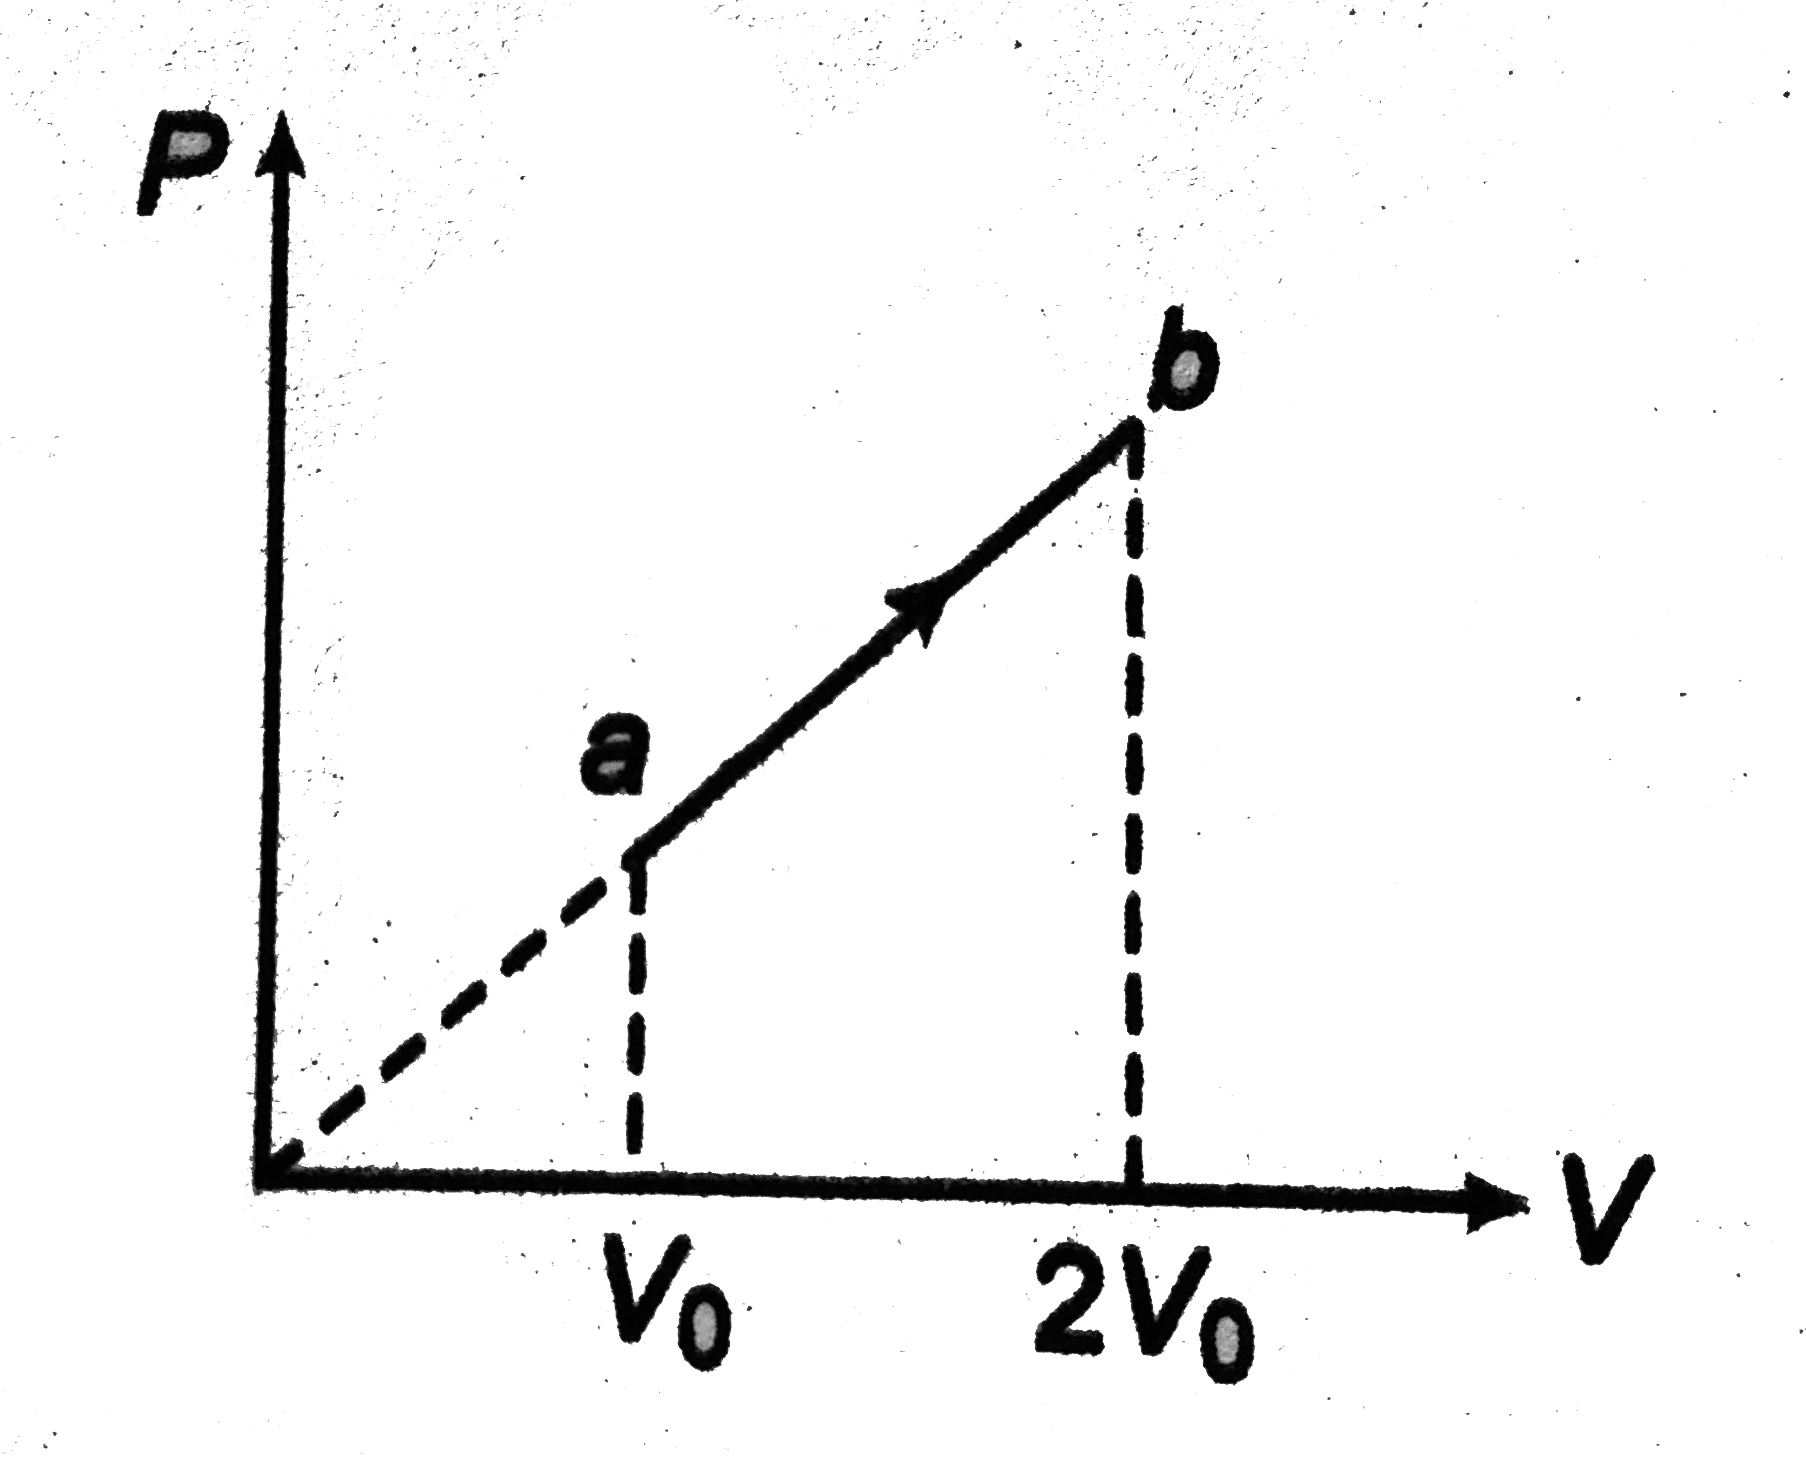
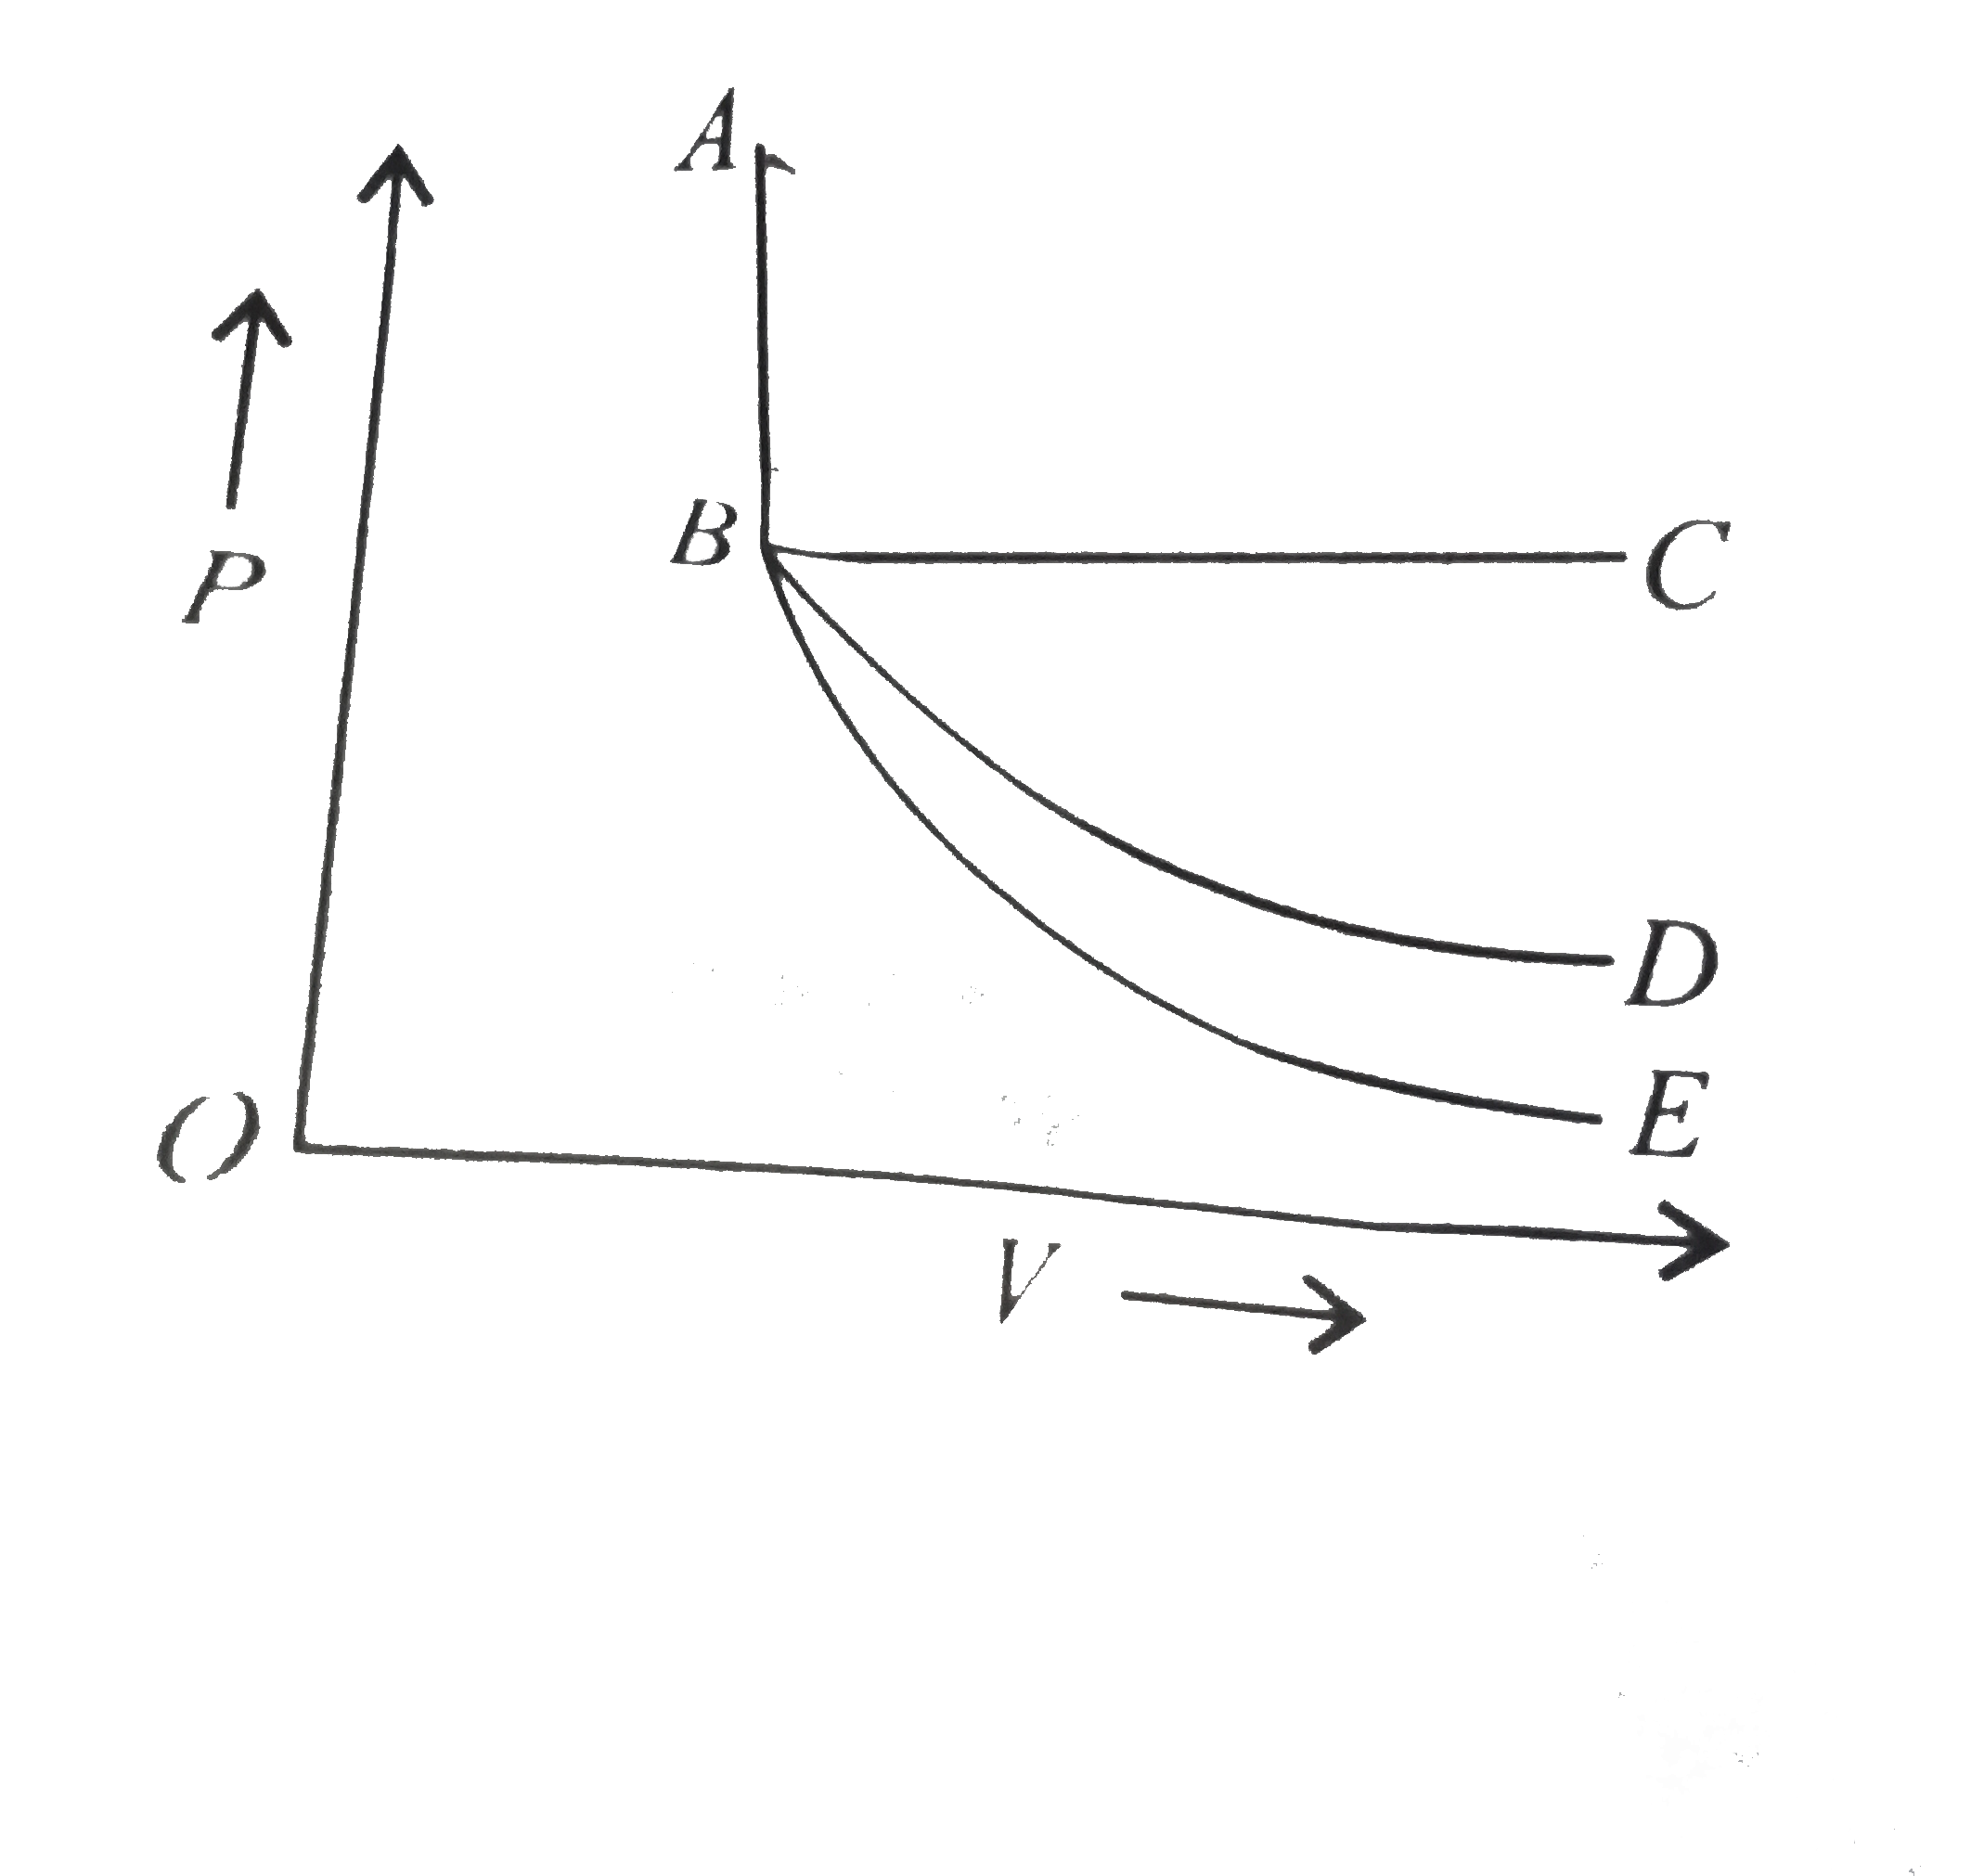
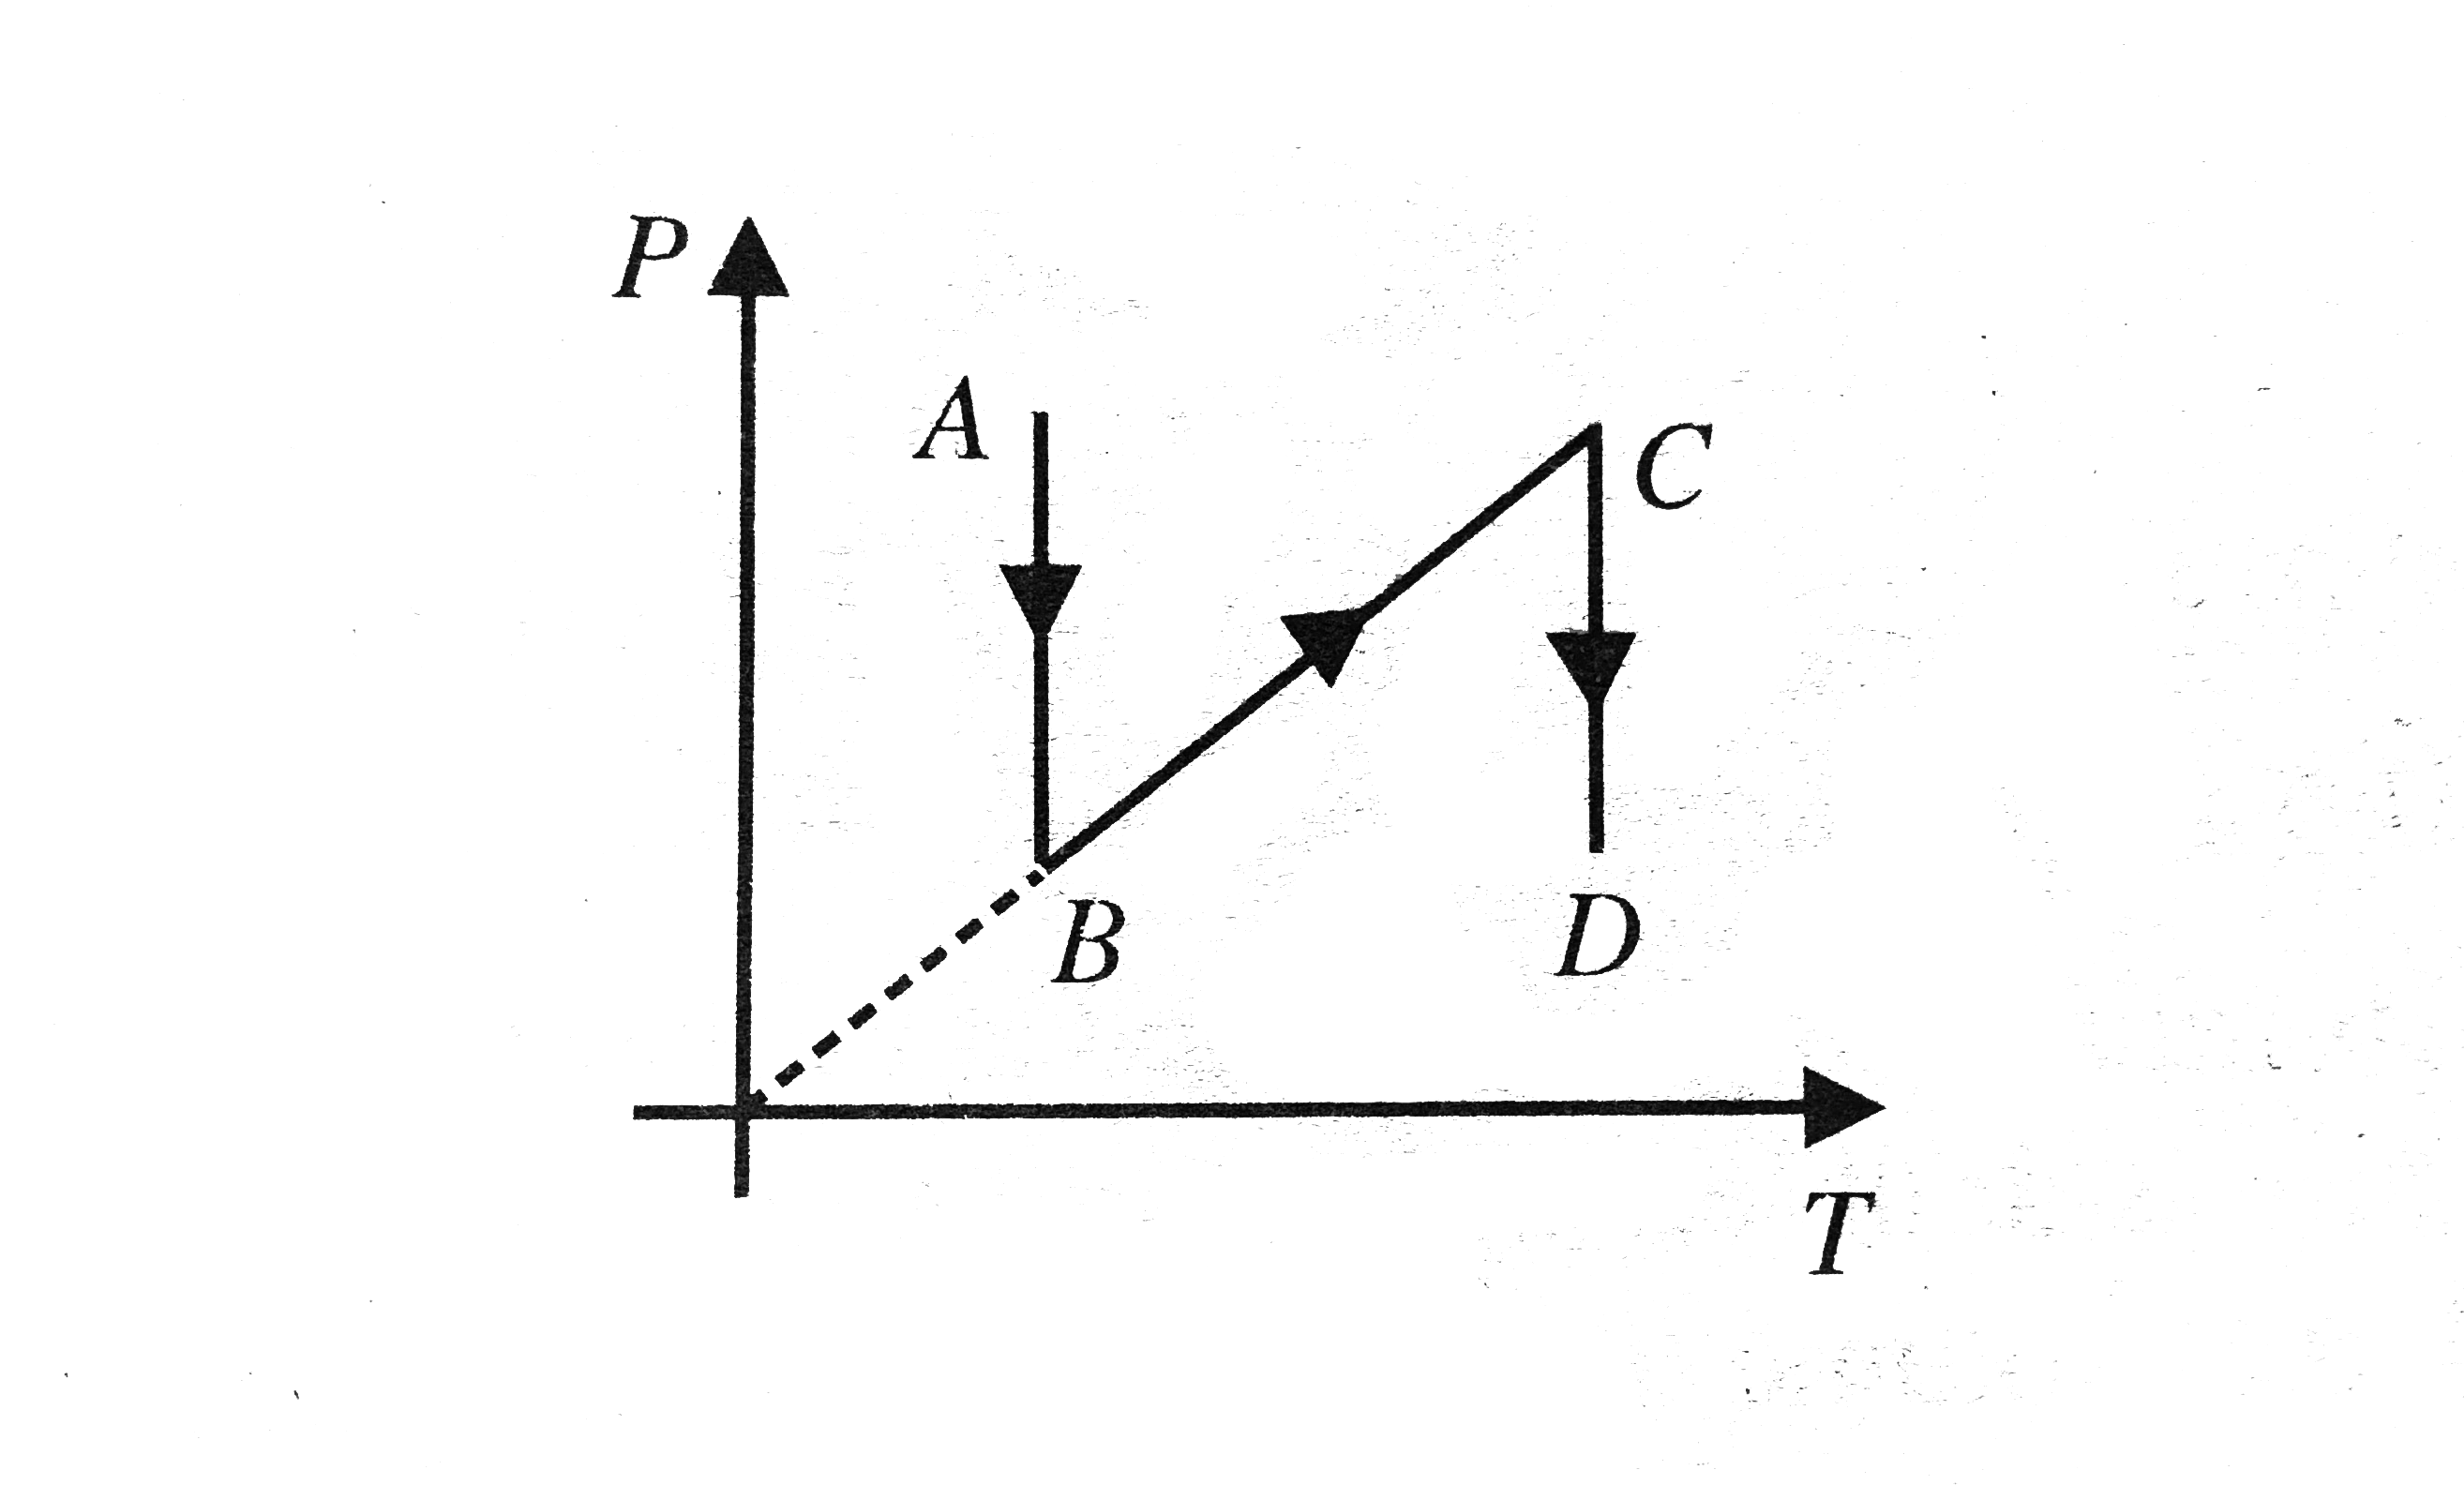
In the (p - V) diagram shown in figure, choose the correct options for the the process (a - b) :
 .
.
A
debsity of gas reduced to half
B
temperature of gas has increased to two times.
C
internal energy of gas has increased to four times
D
(T - V)graph is a parabola passing thriugh origin
Video Solution
Text Solution
The correct Answer is:A, C, D
ρ∝1V
(V) is doubled so (rho) will remain half.
U∝T∝pV
According to given graph, p∝V
∴U∝T∝p2orV2
(V) is doubled, so (U) and (T) both will become four times.
p∝V
∴TV∝V (as p∝TV)
∴T∝V2,
or (T - V) garph is a parabola passing through origin.
|
Topper's Solved these Questions
- THERMOMETRY,THERMAL EXPANSION & KINETIC THEORY OF GASESBOOK - DC PANDEYCHAPTER - THERMOMETRY,THERMAL EXPANSION & KINETIC THEORY OF GASESEXERCISE - Level 2 Subjective
9 Videos
- THERMOMETRY,THERMAL EXPANSION & KINETIC THEORY OF GASESBOOK - DC PANDEYCHAPTER - THERMOMETRY,THERMAL EXPANSION & KINETIC THEORY OF GASESEXERCISE - Level 2 Single Correct
12 Videos
- THERMOMETRY THERMAL EXPANSION AND KINETIC THEORY OF GASESBOOK - DC PANDEYCHAPTER - THERMOMETRY THERMAL EXPANSION AND KINETIC THEORY OF GASESEXERCISE - Medical entrance gallary
30 Videos
- UNIT AND DIMENSIONSBOOK - DC PANDEYCHAPTER - UNIT AND DIMENSIONSEXERCISE - Assertion And Reason
2 Videos
Similar Questions
Knowledge Check
for the given figure, choose the correct option
 AThe body Is In rotational equilibriumBF=net ext0Cτ=net ext0DBoth (1) and (2) are correct
Consider the situation as shown in the figure. Choose the correct option.
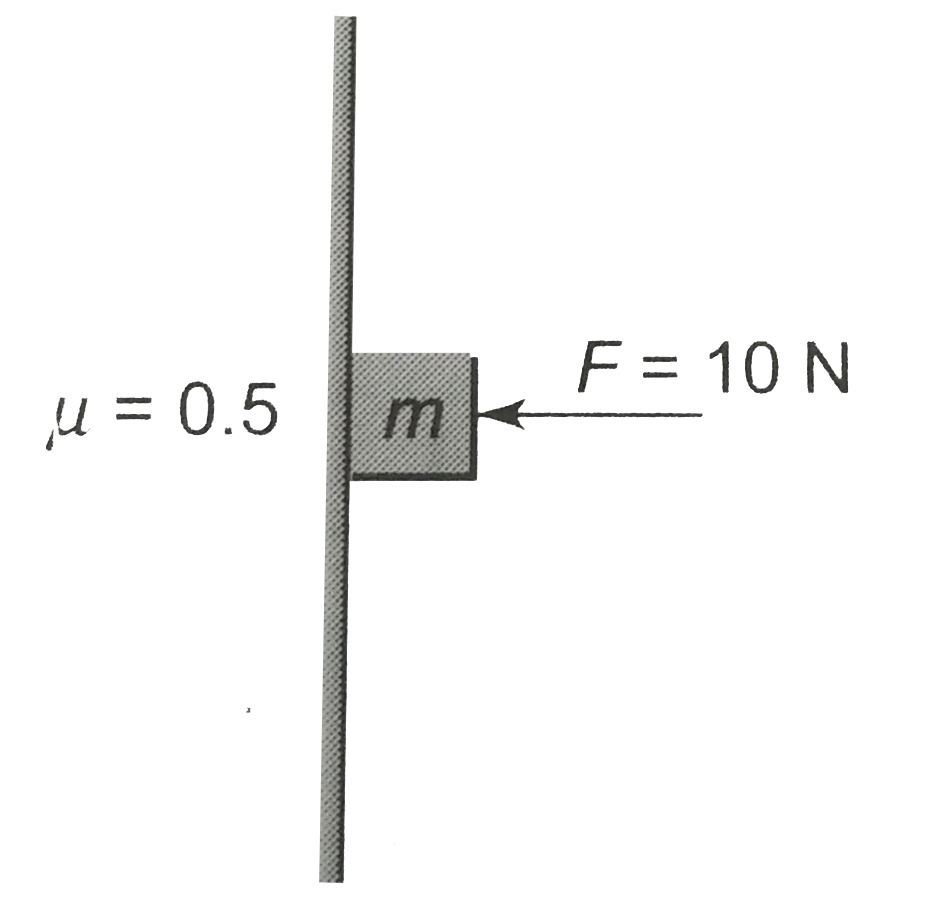 AThe friction force on the block is 1Nifm=0.1kgBThe friction on the block is 5Nifm=1.0kgCBoth (1) and (2) are correctDBoth (1) and (2) are incorrect
For the resistance network shown in the figure, choose the correct options (s)
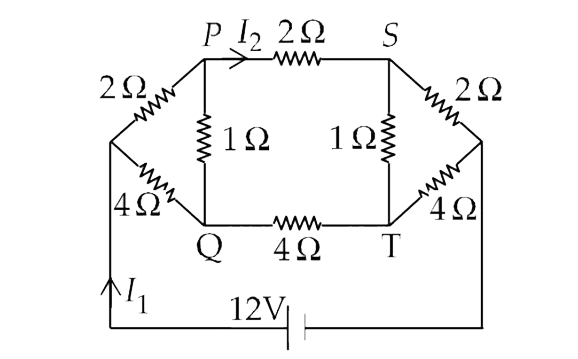 AThe current through PQ is zero.BI1=3ACThe potential at S is less than that at Q.DI2=2A
Consider the diagram given below and choose the correct option.
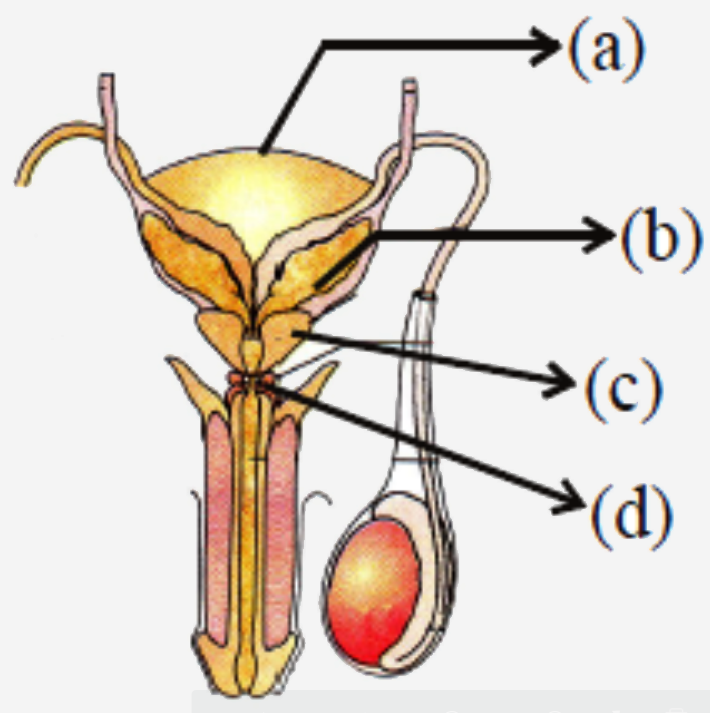
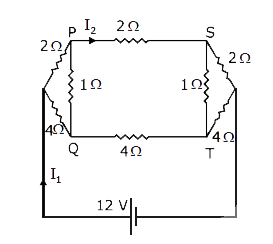
View SolutionFor the resistance network shown in the figure , choose the correct options (s ).
View SolutionObserve the given diagram and choose the correct option :

View SolutionIn P−V diagram shown below,
View SolutionP−T diagram is shown in Fig. Choose the corresponding V−T diagram.
View Solution

