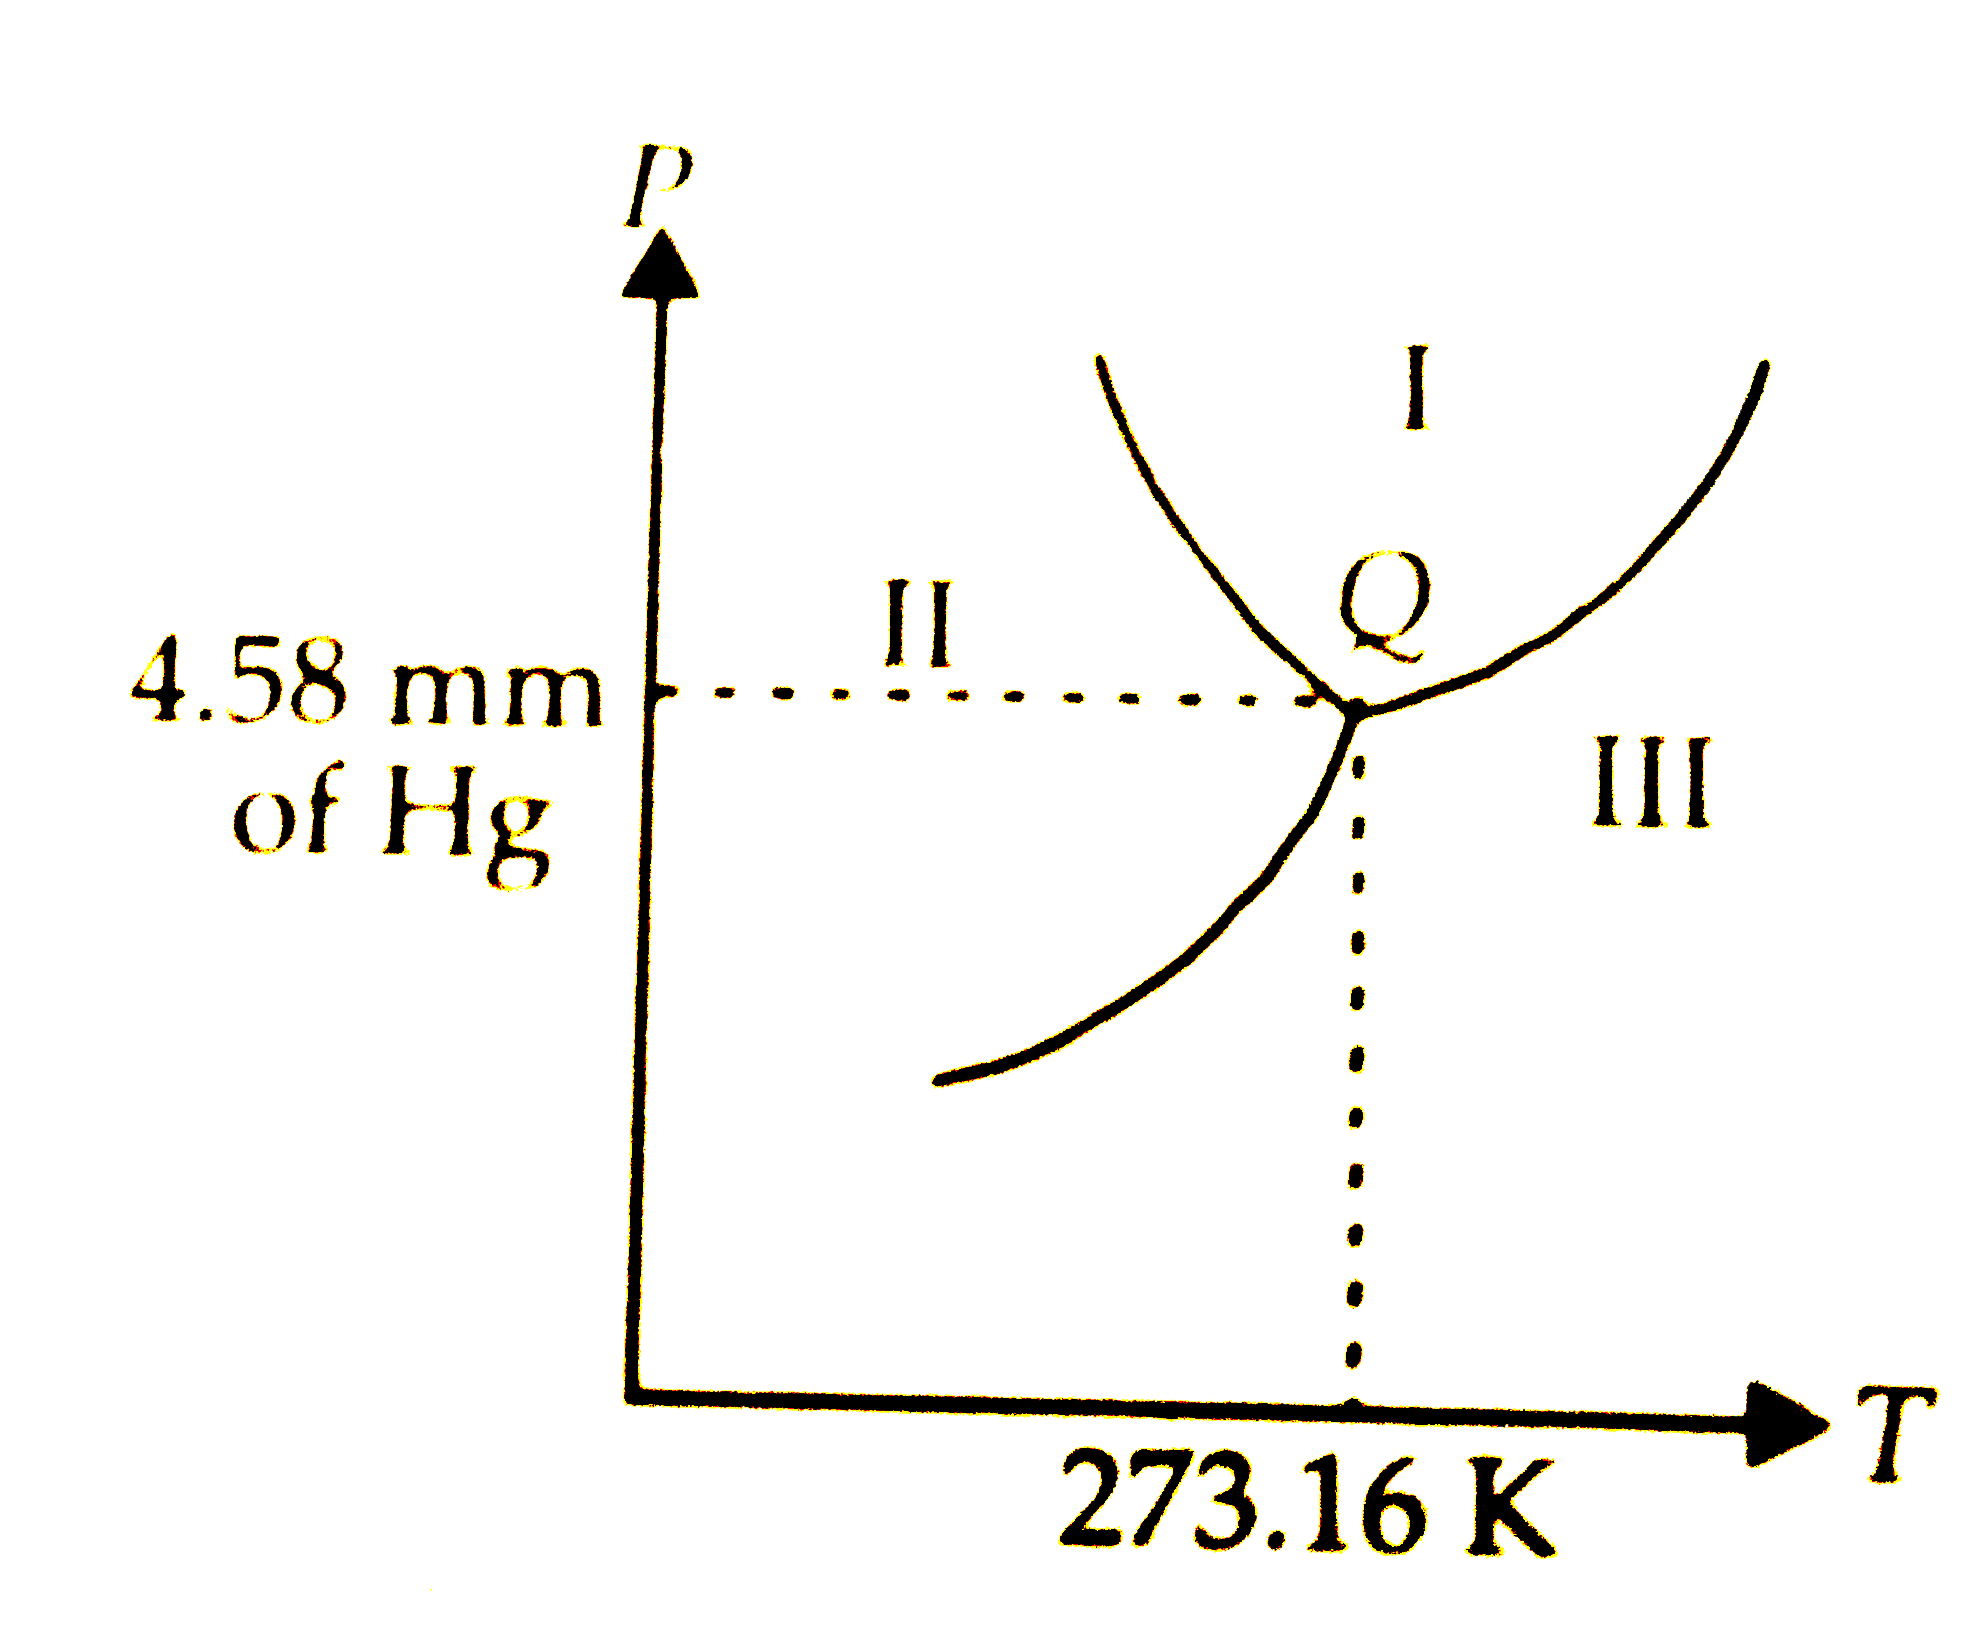
In the phase diagram showns, the point Q corresponds to the triple point of water. The region I, II and III respectively correspond to phases
liquid, solid, vapour
solid, liquid, vapour
liquid, vapour, solid
solid, vapour, liquid
The correct Answer is:A
In the given P-T diagram,
Region I - Liquid
Region II - Solid
Region III - Vapour
Topper's Solved these Questions
- THERMAL PROPERTIES OF MATTERBOOK - NCERT FINGERTIPSCHAPTER - THERMAL PROPERTIES OF MATTEREXERCISE - Heat Transfer
26 Videos
- THERMAL PROPERTIES OF MATTERBOOK - NCERT FINGERTIPSCHAPTER - THERMAL PROPERTIES OF MATTEREXERCISE - Newton'S Law Of Cooling
3 Videos
- THERMAL PROPERTIES OF MATTERBOOK - NCERT FINGERTIPSCHAPTER - THERMAL PROPERTIES OF MATTEREXERCISE - Calorimetry
4 Videos
- SYSTEM OF PARTICLES AND ROTATIONAL MOTIONSBOOK - NCERT FINGERTIPSCHAPTER - SYSTEM OF PARTICLES AND ROTATIONAL MOTIONSEXERCISE - Assertion And Reason
15 Videos
- THERMODYNAMICSBOOK - NCERT FINGERTIPSCHAPTER - THERMODYNAMICSEXERCISE - Assertion And Reason
15 Videos
Similar Questions
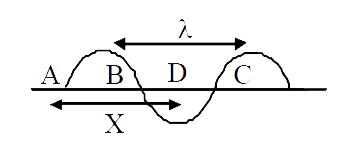
The phase difference corresponding to path difference of x is
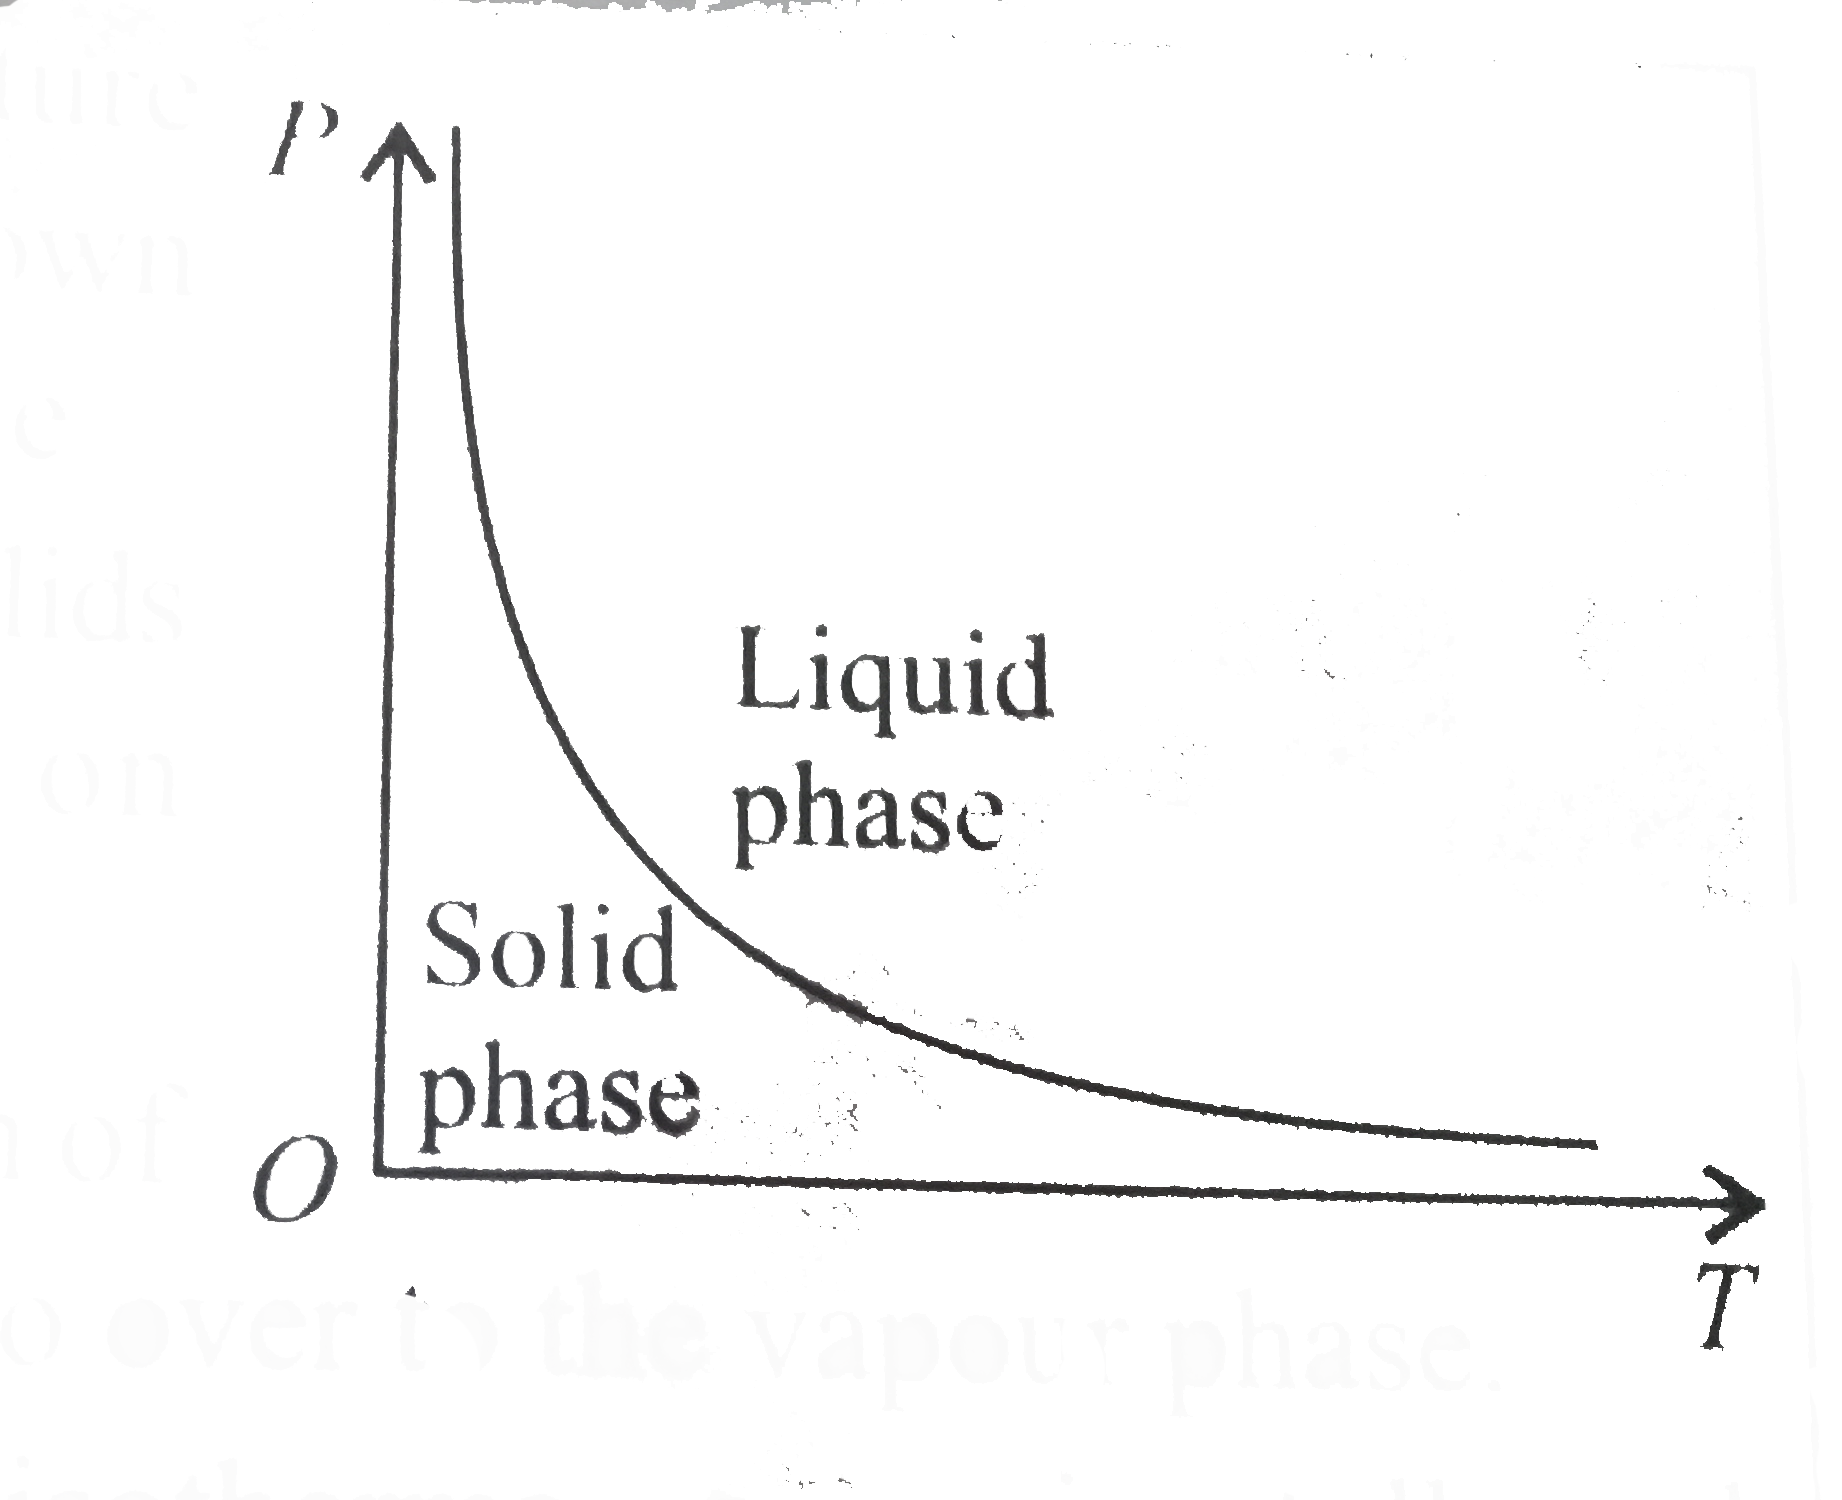
View SolutionThe pressure -temperature (P−T) phase diagram shown below corresponds to the
a. Curve of fusion of solids that expand on solidification.
b. Curve of sublimation of solides that directly go over to the vapour phase.
View Solution
Knowledge Check
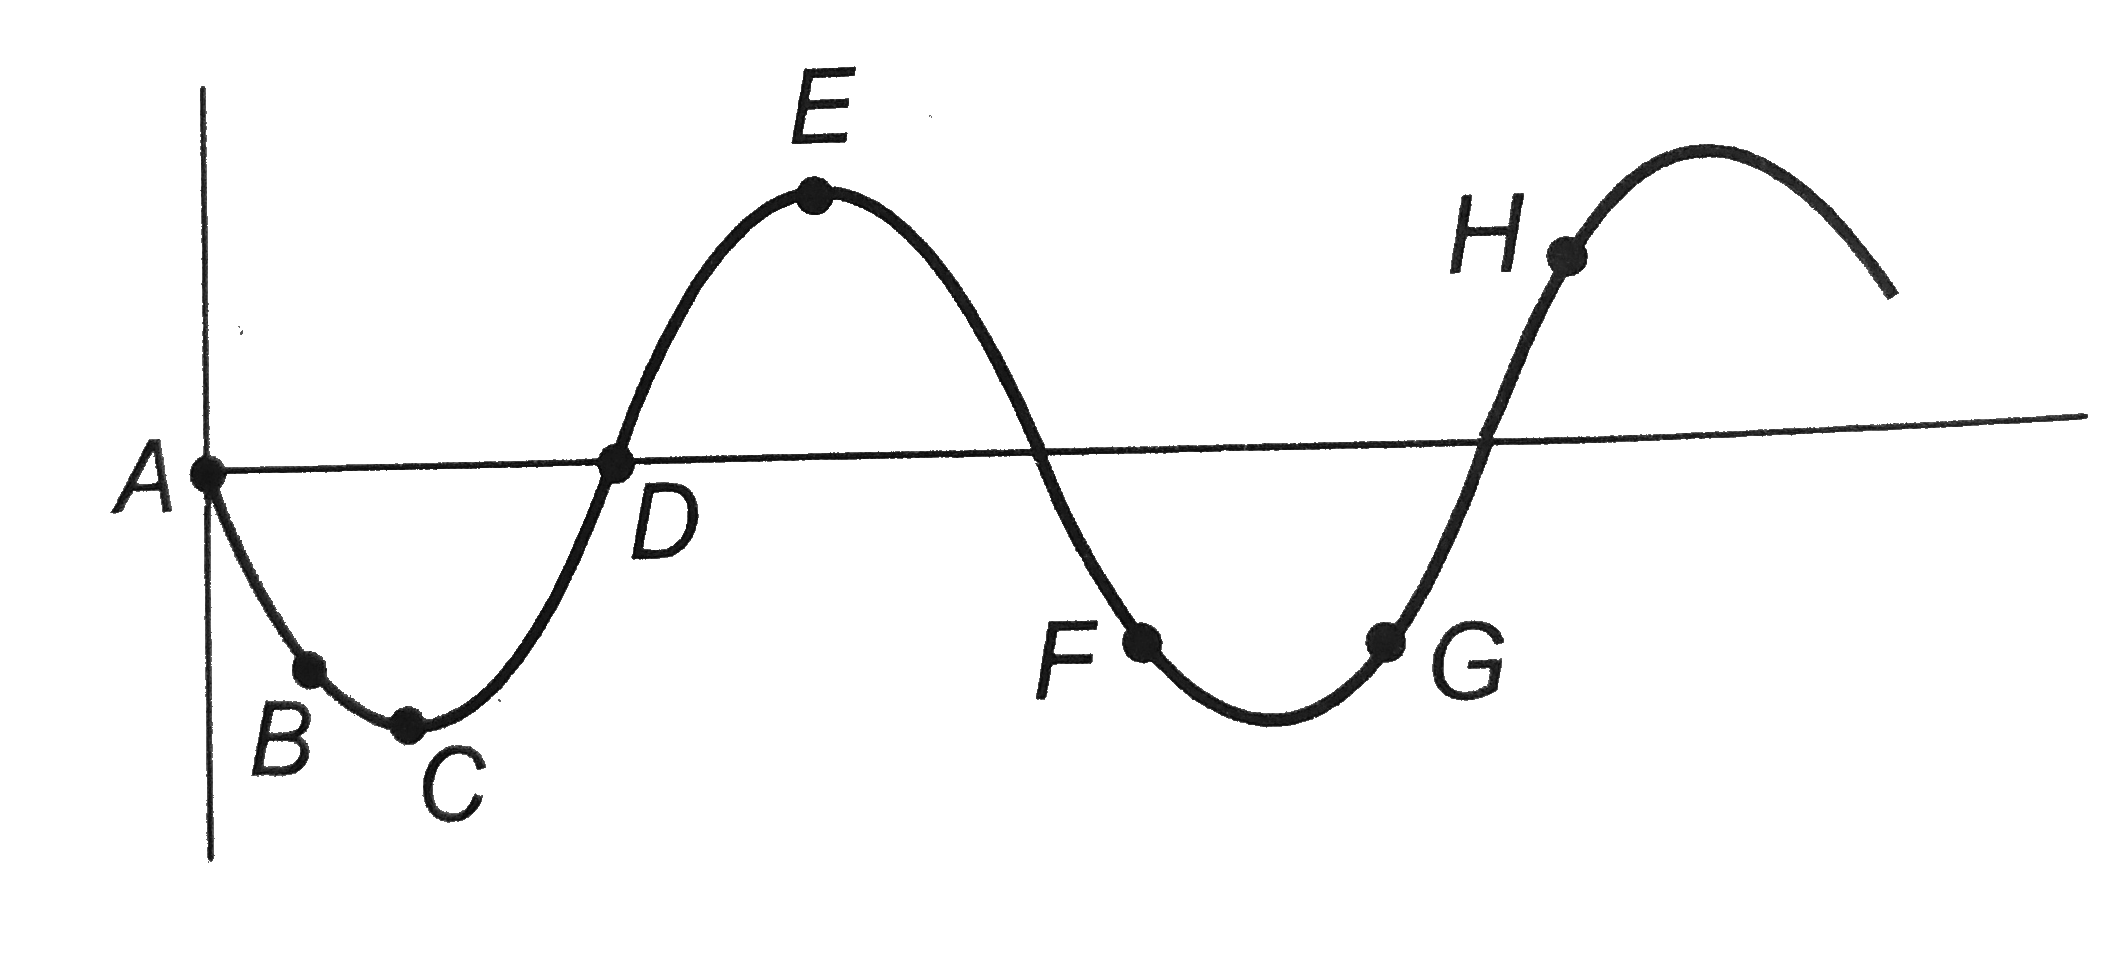
The diagram below shows the propagation of a wave. Which points are in same phase?
 .AF and GBC and FCB and GDB and F
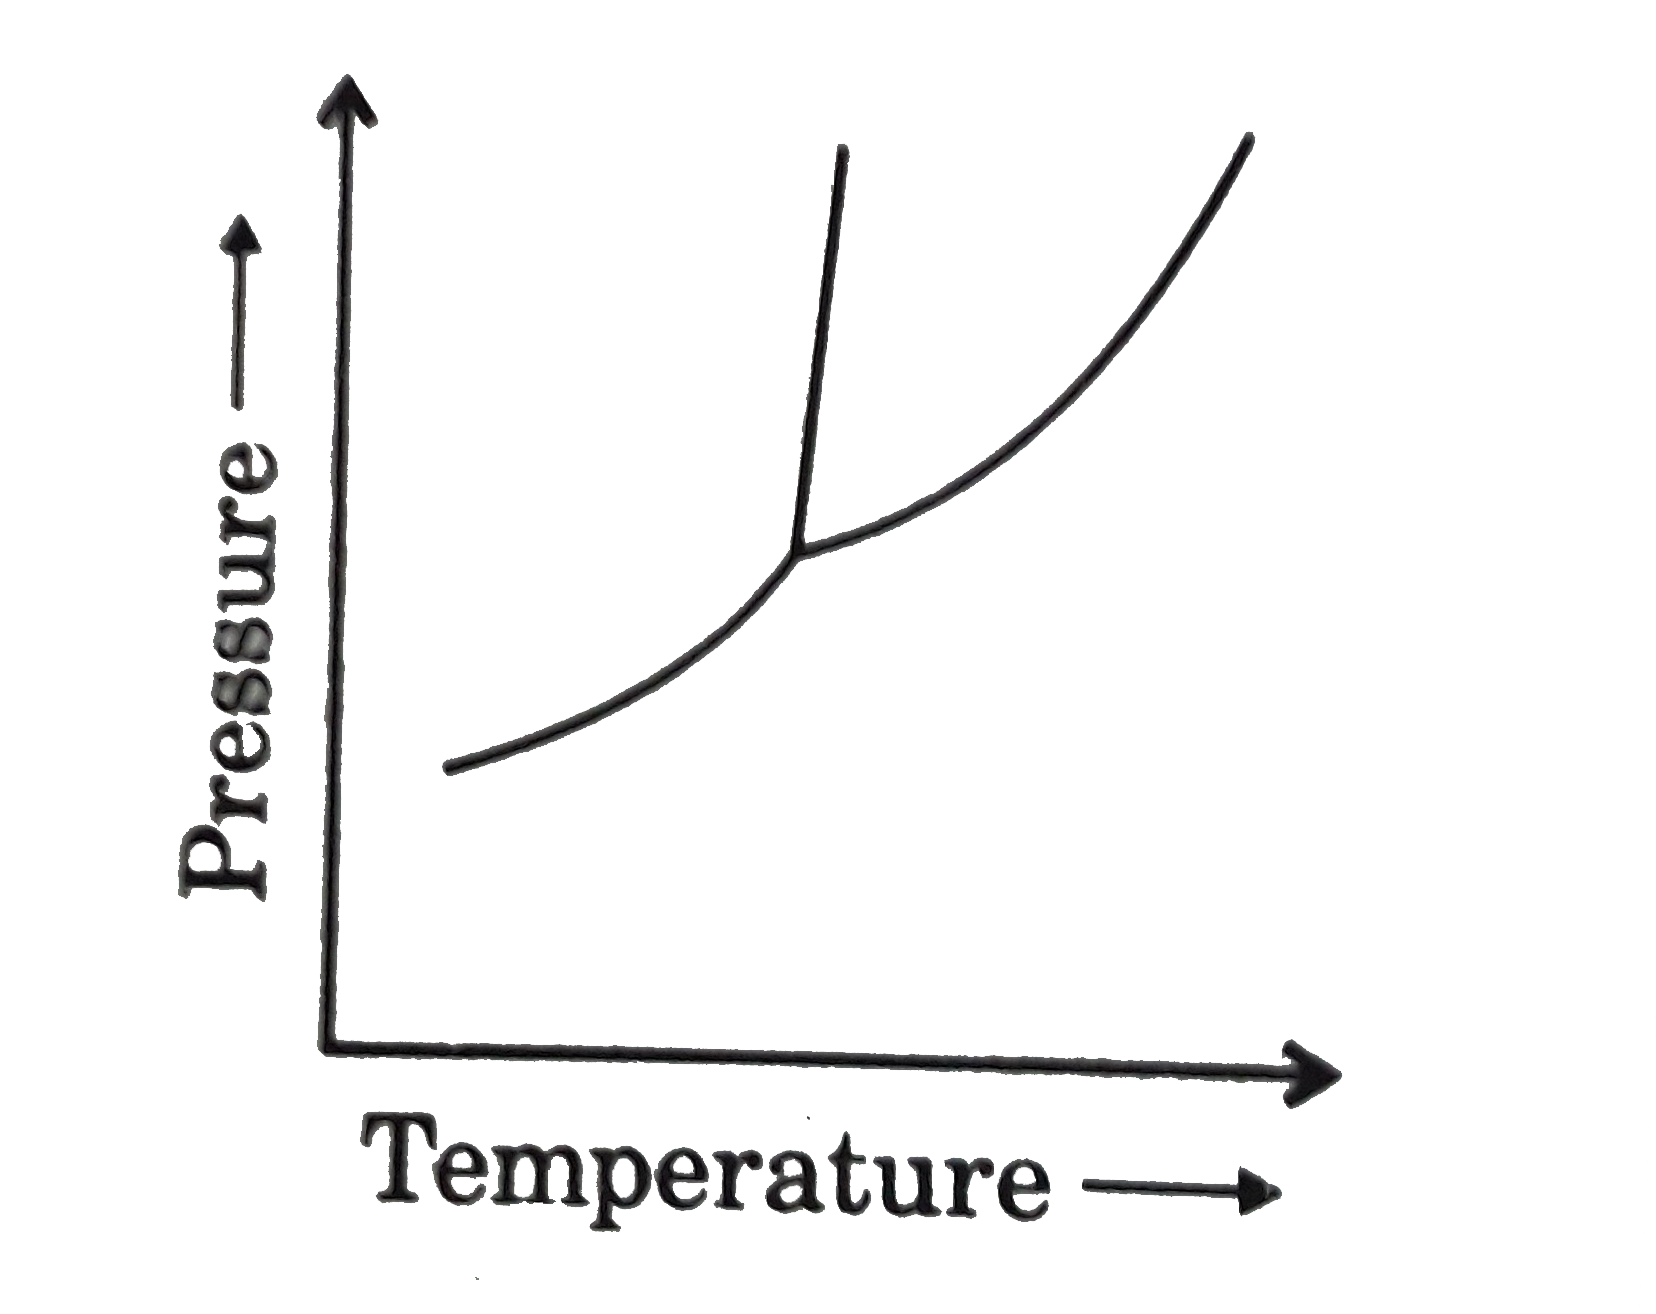
According to this phase diagram, which phases can exist at pressure lower than the triple point pressure ?
 AGas onlyBSolid and gas onlyCLiquid onlyDSolid and liquid only
Which statement is correct about the critical point of a phase diagram?
ASolid, liquid and gas are present in equilibrium.BLiquid and vapour are indistinguishable from one another.CLiquid can be produced by a change in pressure.DVapour can be produced by a change in temperature.
The pressure -temperature (P−T) phase diagram shown below corresponds to the
a. Curve of fusion of solids that expand on solidification.
b. Curve of sublimation of solids that directly go over to the vapour phase.

View SolutionWhich of the following phase diagram is/are not correct for water?
View SolutionThe phase difference corresponding to path difference of x is
View SolutionIn the diagram, the phase difference between points A and D is -
View SolutionWhich of the following phase diagram is/are not correct for water?
View Solution
