Inside two conical pipes there is a drop of water (Figure (a)) and a drop of mercury (Figure (b)). Where does each drop lend to move? 2.53. Which of the curves shown ill the figure depicts correctly the temperature dependence of surface tension? Curve 1 falls off to zero at the boiling- point of the liquid, curve 2 falls off to zero at the critical temperature, curve 3 tends to zero asymptotically, and curve 4 shows that surface tension is temperature independent.
Step by step video & image solution for Inside two conical pipes there is a drop of water (Figure (a)) and a drop of mercury (Figure (b)). Where does each drop lend to move? 2.53. Which of the curves shown ill the figure depicts correctly the temperature dependence of surface tension? Curve 1 falls off to zero at the boiling- point of the liquid, curve 2 falls off to zero at the critical temperature, curve 3 tends to zero asymptotically, and curve 4 shows that surface tension is temperature independent. by Physics experts to help you in doubts & scoring excellent marks in Class 11 exams.
Updated on:21/07/2023Topper's Solved these Questions
Similar Questions
Knowledge Check
Which one of the figures gives the temperature dependance of density of water correctly?
A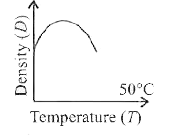 B
B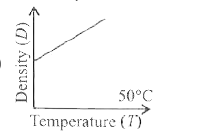 C
C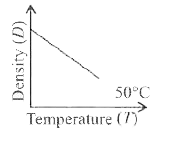 D
D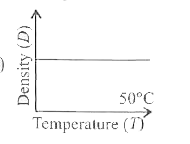
Which curve in figure represents the curve of ideal gas ?
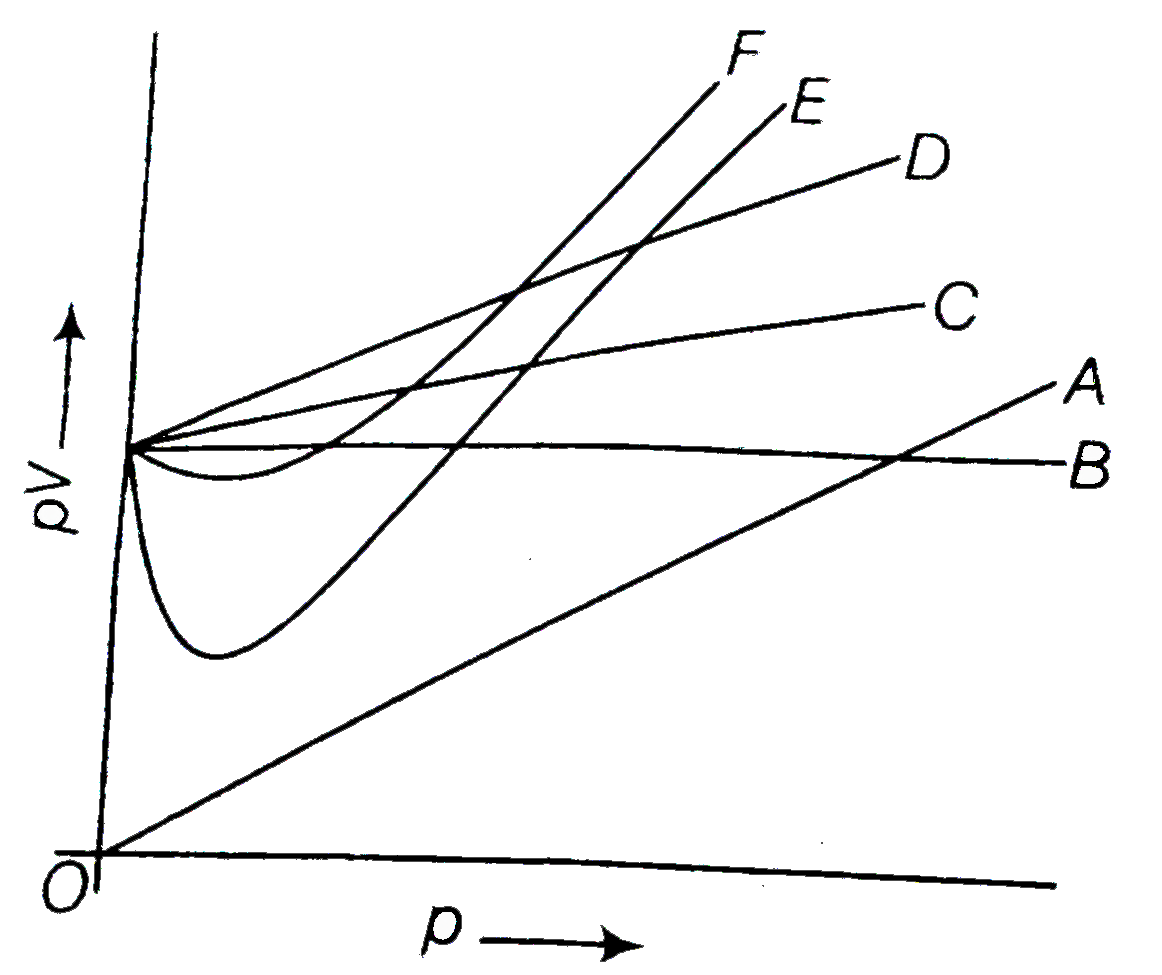 AOnly BBC and DCE and FDA and B
The curve shown results when a liquid is cooled. What temperature is closest to the freezing point of the liquid ?
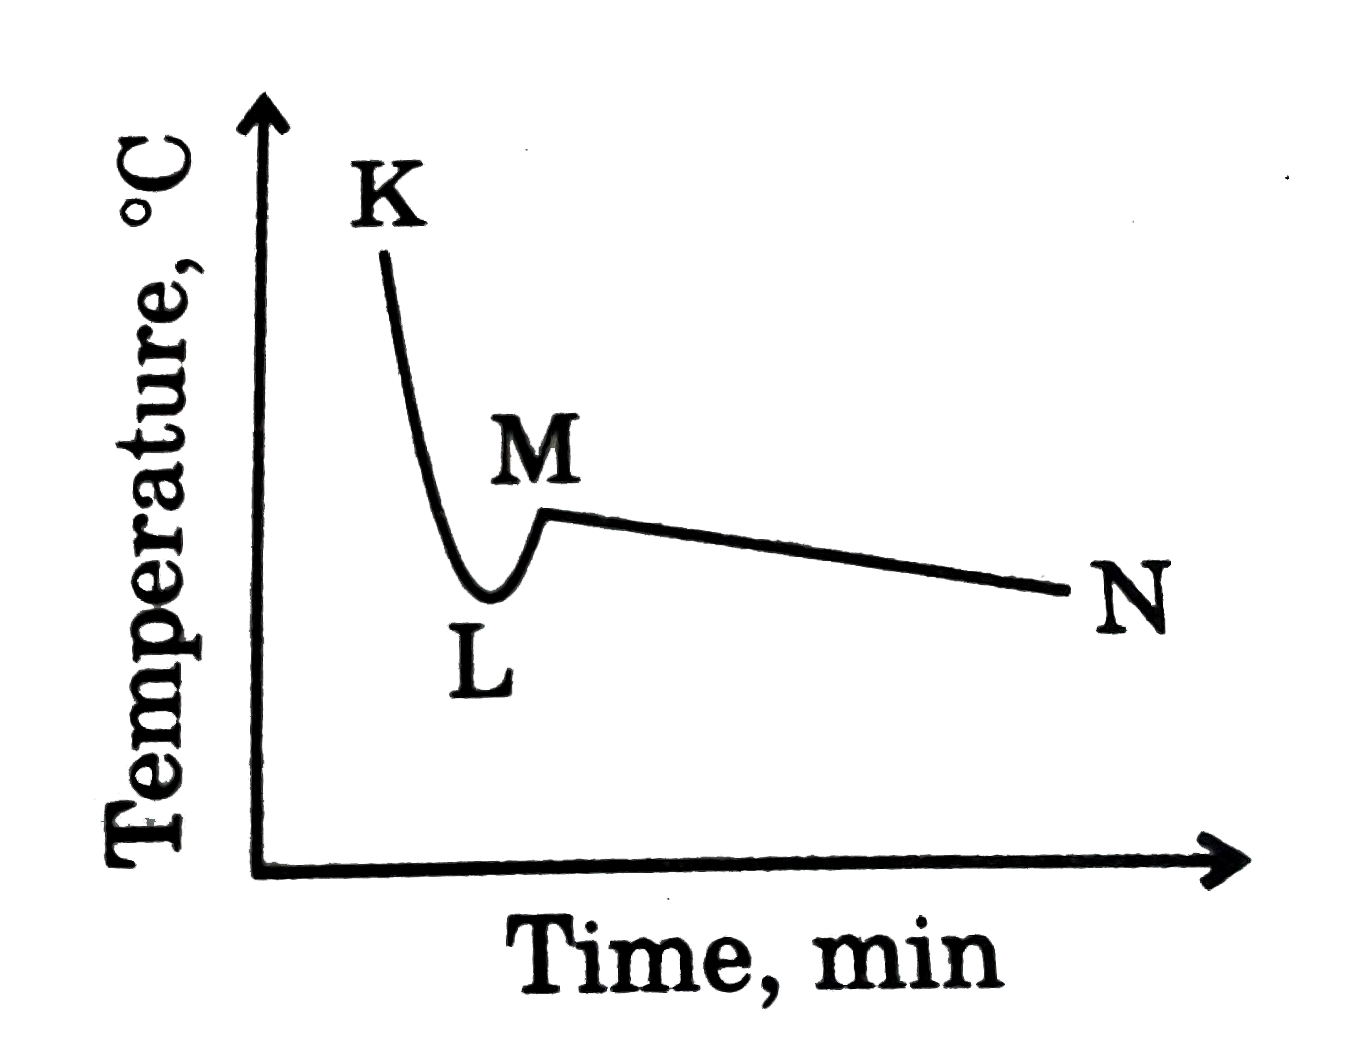 ALBMCL+M2DM+N2
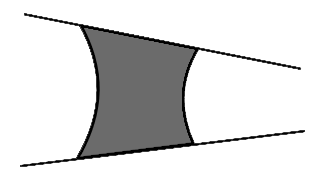
A conical pipe shown in figure has a small water drop. In which direction does the drop will tend to move?
View SolutionWhen does MR curve falls below AR curve ?
View SolutionIf the time period (T)of vibration of a liquid drop depends on surface tension (S) , radius(r) of the drop , and density (ρ) of the liquid , then find the expression of T.
View SolutionIn the figure shown the potential drop across the series resistor is
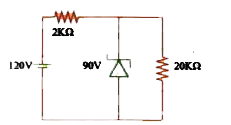
View SolutionIn the figure shown the potential drop across the series resistor is
View Solution

