Figures (a),(b)and(c) depict three cyclic processes in the pV−,VT−,andpT− cooroinates. The ourvi linear sections in Figure (a) are isotherms. Depict the same processes in the pT- and VT-eoordinates (for process (a)), the pV−andpT− coordinates (for process (b)), and the pV−andVT− coordinates (for process (c)).
Step by step video & image solution for Figures (a), (b) and (c) depict three cyclic processes in the pV-, VT-, and pT- cooroinates. The ourvi linear sections in Figure (a) are isotherms. Depict the same processes in the pT- and VT-eoordinates (for process (a)), the pV- and pT- coordinates (for process (b)), and the pV- and VT- coordinates (for process (c)). by Physics experts to help you in doubts & scoring excellent marks in Class 11 exams.
Updated on:21/07/2023Topper's Solved these Questions
Similar Questions
A cyclic process ABCA shown in the V-T diagram is performed with a constant mass of an ideal gas. Show the same process on a p-V diagram, In the figure, CA is parrallel to the B-sxis and BC is parallel to the T-axis.<br><imga≤ocr_imageload∈g=lazysrc=https://d10lpgp6xz60nq.cloudfront.net/physics_imagesHCV_VOL2_C24_S01_010_Q01.pngwh=80%mx-autosty≤=background:white;>
View SolutionWork done by a sample of an ideal gas in a process A is double the work done in another process B. The temperature rises through the same amount in the two processes. If (C_A and C_B) be the molar heat capacities for the two processes,
View Solution
Knowledge Check
Figure shows four PV diagrams. Which of these curves represent isothermal and adiabatic processes?
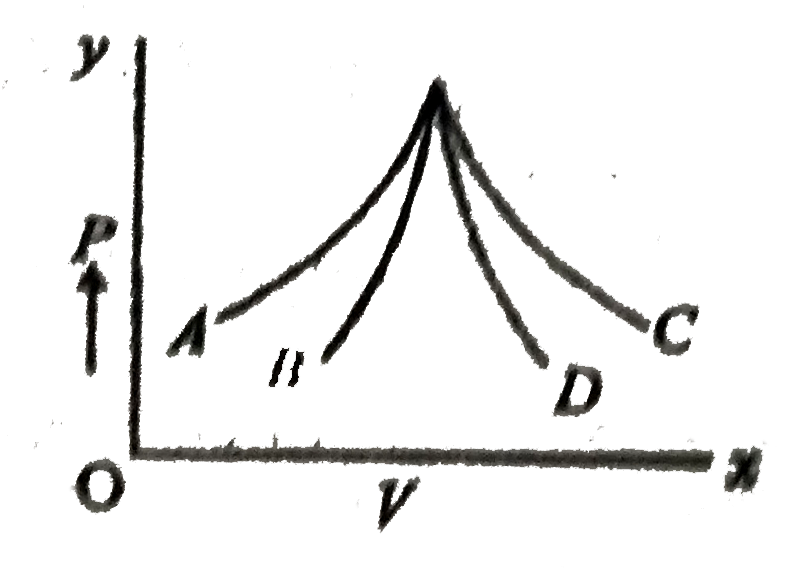 AC and DBA and CCA and BDB and D
In the cyclic process shown on PV diagram, the magnitude of the work done is
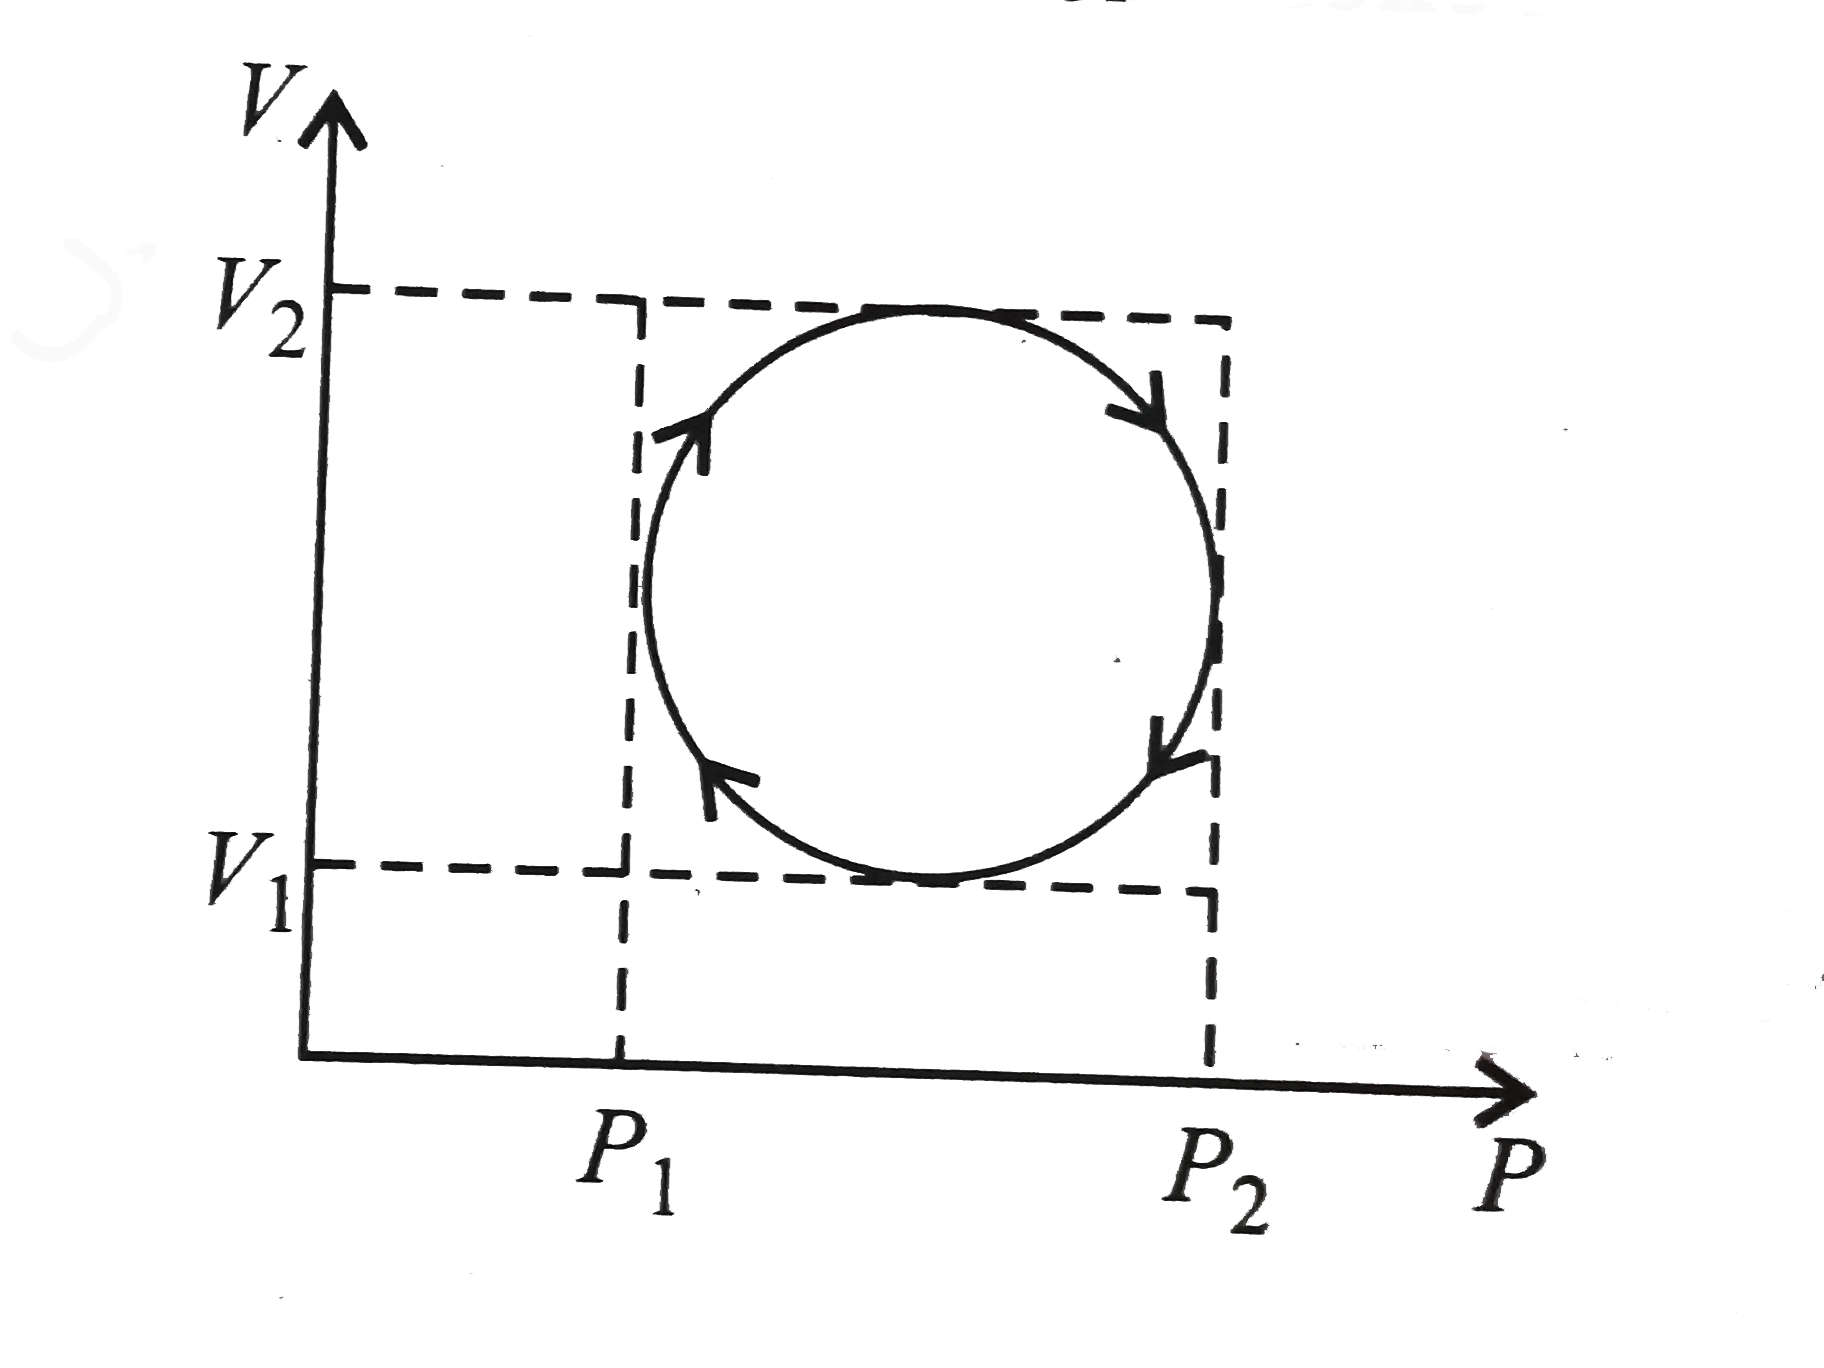 Aπ(P2−P12)2Bπ(V2−V12)2Cπ4(P2−P1)(V2−V1)Dπ(P2V2−P1V1)
For a reversible thermodynamic process for monoatomic gas PVx= constant If for this process x=CpCv, then heat capacity for the process is
A3R2B5R2C0D∞
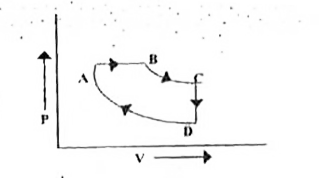
A cyclic process ABCD is shown in the figure P - V diagram. Which of the following curves represent the same process

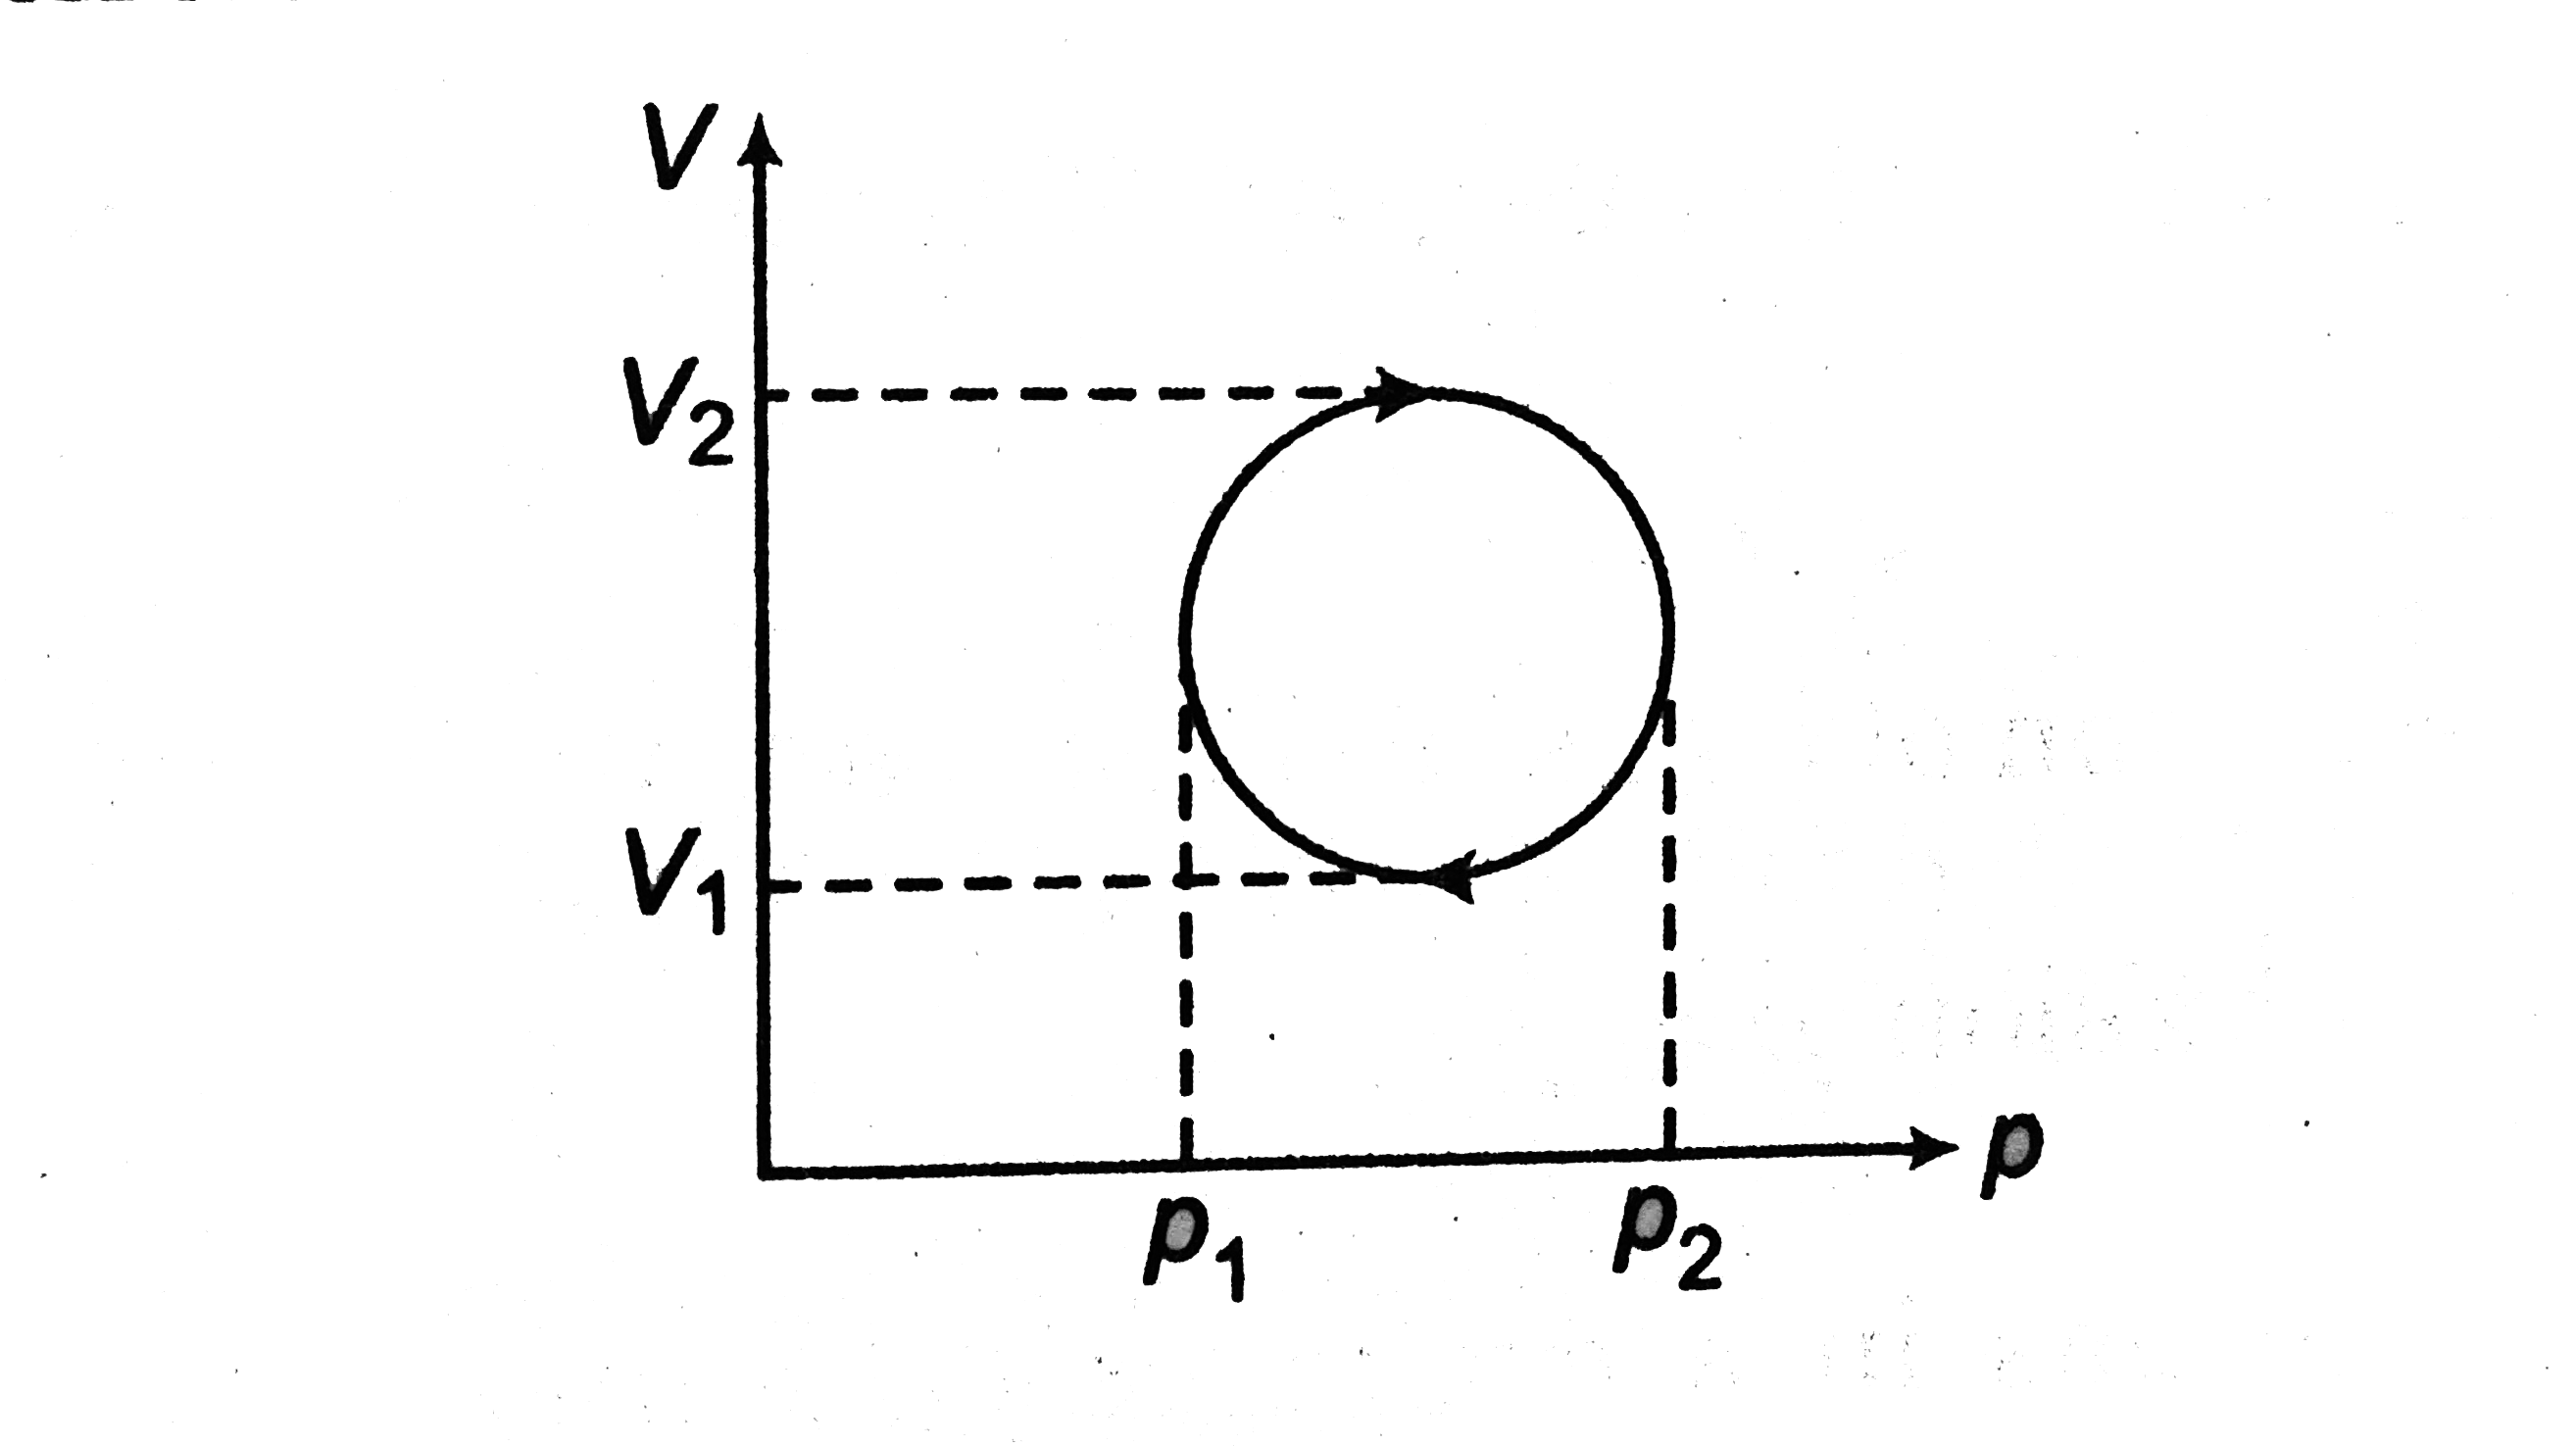
View SolutionThe cyclic process form a circle on a pV diagram as shown in figure. The work done by the gas is
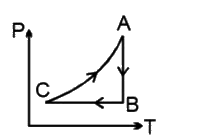
View SolutionIn the figure represent cyclic process. The corresponding PV graph is
View SolutionWhat is the slope for an isothermal process in PV indicator diagram -
View SolutionA cyclic process ABCD is shown in the figure P-V diagram. Which of the following curves represent the same process?
View Solution
