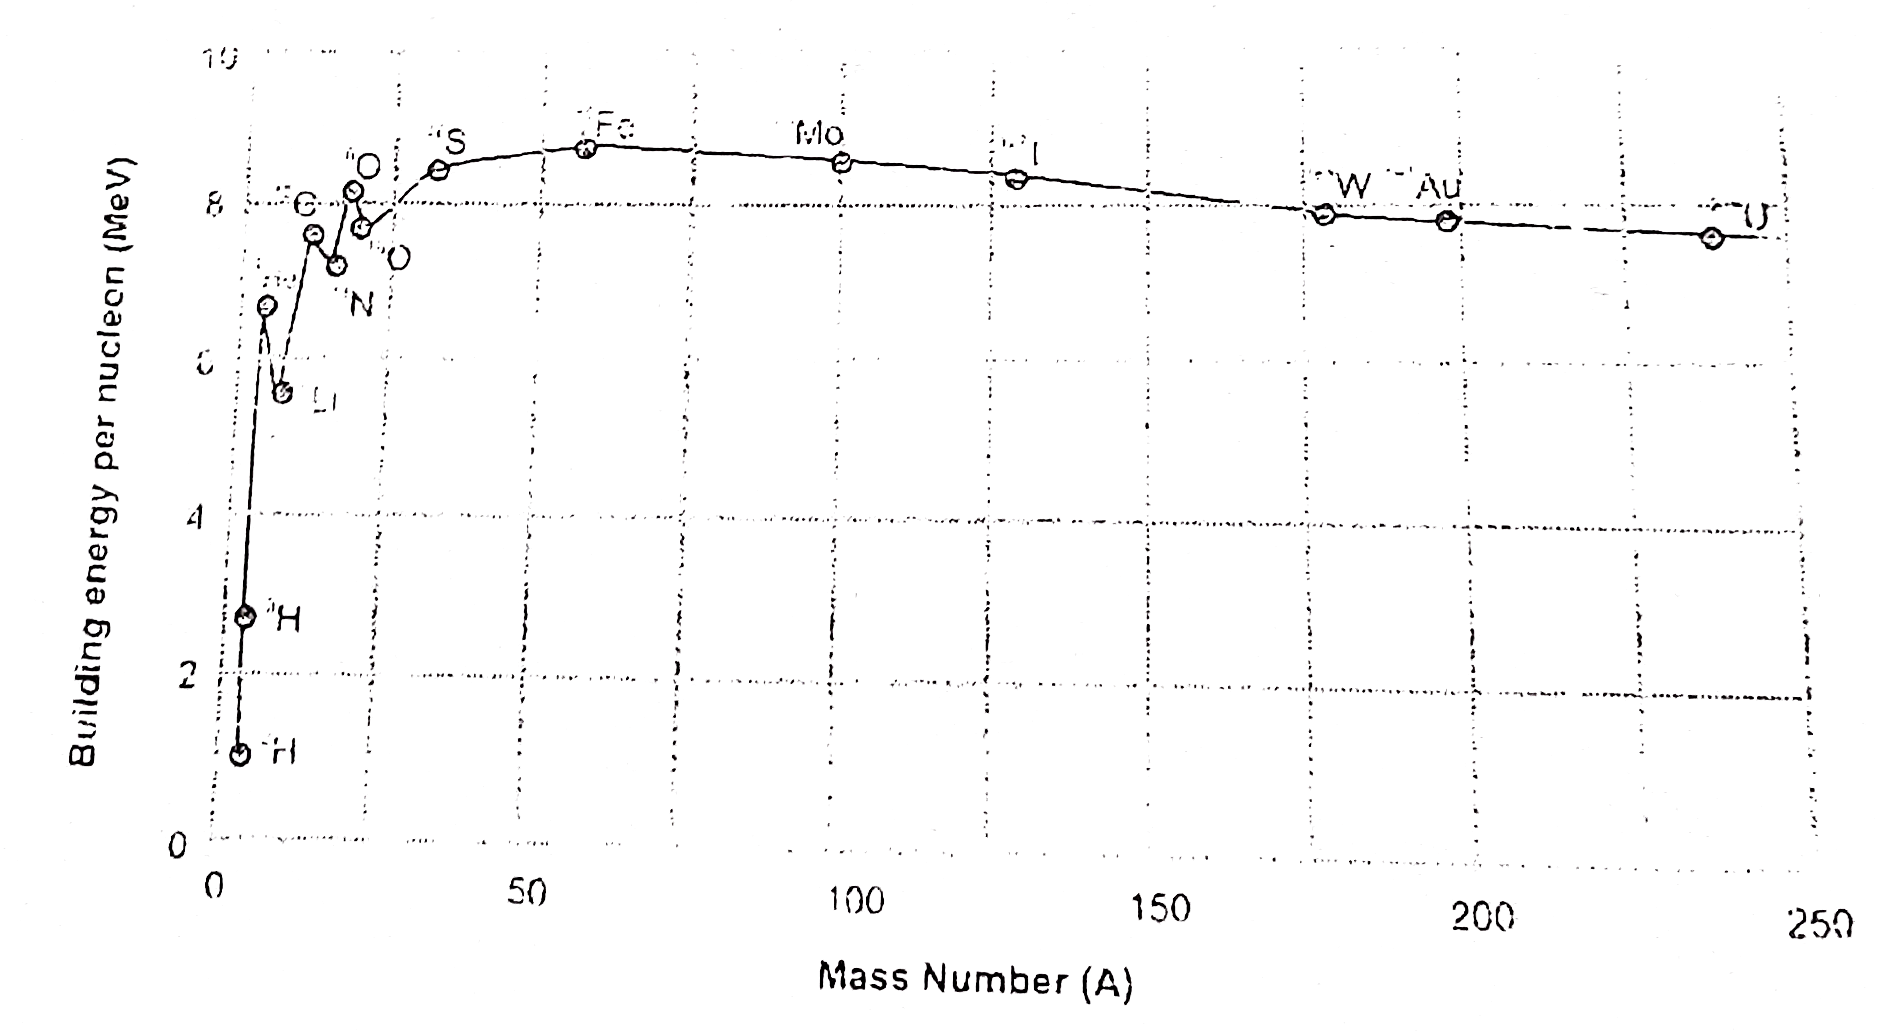
Plot the binding energy per nucleon Ebn versus the mass number A for a large number of nuclei. What are the main features noticed from the plot.Solution in Assamese
Step by step video & image solution for Plot the binding energy per nucleon E_(bn) versus the mass number A for a large number of nuclei. What are the main features noticed from the plot. by Physics experts to help you in doubts & scoring excellent marks in Class 12 exams.
Updated on:21/07/2023Topper's Solved these Questions
Similar Questions
Write down the Biot-Savart's Law in vector form.
View SolutionWhat step can be taken to achieve high revolving power of a telescope?
View SolutionVariation Of Binding Energy Of Per Nucleon With Mass Number
View SolutionDraw the graph showing thervariation of binding energy per nucleon with mass number. Give therason for the decrease of binding energy per nucleon for nuclei with high mass numbers. The binding energy per nucleon for nuclei with high mass number is low due to the large coulomb repulsion between the protons inside these nuclei.
View SolutionLet binding energy per nucleon of nucleus is denoted by Ebn and radius is denoted as r. If mass number of nuclei A,B are 64 and 125 respectively , then
View SolutionDraw a plot of the binding energy per nucleon as a function of mass number for a large number of nuclei , 2 le A le 240 . How do you explain the constancy of binding energy per nucleon in the range 30 lt A lt 170 using the property that nuclear force is short-ranged ?
View SolutionBinding energy per nucleon plot against the mass number for stable nuclei is show in the figure. Which curve is correct ?
View SolutionExplain the process of nuclear fission and nuclear fussion by using the plot of binding energy per nucleon (BE/A) versus the mass number A .
View SolutionDraw the plot of binding energy per nucleon as a function of mass number and write two important conclusion obtained from the graph.
View SolutionAssume that the nuclear binding energy per nucleon (BIA) versus mass number (A) is as shown in the figure. Use this plot to choose the correct choice(s) given below:
View SolutionDraw a plot of BE/A versus mass number A for 2≤A≤170. Use this graph to explain the release of energy in the process of nuclear fusion of two light nuclei.
OR
Using the curve for the binding energy per nucleon as a function of mass number A, state clearly how the release in energy in the processes of nuclear fission and nuclear fusion can be explained.
OR
Draw a plot of the binding energy per nucleon as a function of mass number for a large number of nuclei, 2<A<240. How do you explain the constancy of binding energy per nucleon in the range 30<A<170 using the property that nuclear force is short-ranged ?
View SolutionDraw a plot of the binding energy per nucleon as a function of mass number for a large number of nuclei, 2le Ale 240 . How do you explain the constancy of binding energy per nucleon in the range 30ltA lt170 using the property that nuclear force is short-ranged ?
View SolutionDraw a plot of the binding energy per nucleon as a function of mass number for a large number of nuclei , 2 le A le 240 . How do you explain the constancy of binding energy per nucleon in the range 30 lt A lt 170 using the property that nuclear force is short-ranged ?
View SolutionBinding energy curve shows the variation of Binding energy per nucleon of nuclei with mass number. Binding energy per nucleon is maximum for mass number..
View SolutionDraw the graph showing thervariation of binding energy per nucleon with mass number. Give therason for the decrease of binding energy per nucleon for nuclei with high mass numbers.

The binding energy per nucleon for nuclei with high mass number is low due to the large coulomb repulsion between the protons inside these nuclei.
View Solution
