Plotting a graph for momentum on the X-axis and time on Y-axis . Slope of momentum - time graph gives _________
A
Impulsive force
B
Acceleration
C
Force
D
Rate of force
Text Solution
The correct Answer is:C
|
Topper's Solved these Questions
- LAWS OF MOTIONBook:SURA PUBLICATIONChapter:LAWS OF MOTIONExercise:TEXTBOOK EVALUATION ( FILL IN THE BLANKS )
Explore 5 Videos
- LAWS OF MOTIONBook:SURA PUBLICATIONChapter:LAWS OF MOTIONExercise:TEXTBOOK EVALUATION ( STATE WHETHER THE FOLLOWING STATEMENTS ARE TRUE OR FALES . CORRECT THE STATEMENT IF IT IS FALSE )
Explore 5 Videos
- HALF YEARLY MODEL QUESTION PAPERBook:SURA PUBLICATIONChapter:HALF YEARLY MODEL QUESTION PAPERExercise:MCQ.s
Explore 24 Videos
- MODEL QUESTION PAPER HIGHER LEVELBook:SURA PUBLICATIONChapter:MODEL QUESTION PAPER HIGHER LEVELExercise:Subjective Questions
Explore 25 Videos
Similar Questions
Knowledge Check
A graph is drawn with a force along y-axis and time along x-axis. The area under the graph represent–
AMomentumBCoupleCMoment of the forceDImpulse of the forceFor a first order reaction, when a graph is plotted between log10([A])0([A])t on y-axis and time (t) on x-axis , slope of the graph of the graph is equal to __________.
A−KBKC−K2.303DK2.303Plot the acceleration-time graph of the welocity-time graph given in.
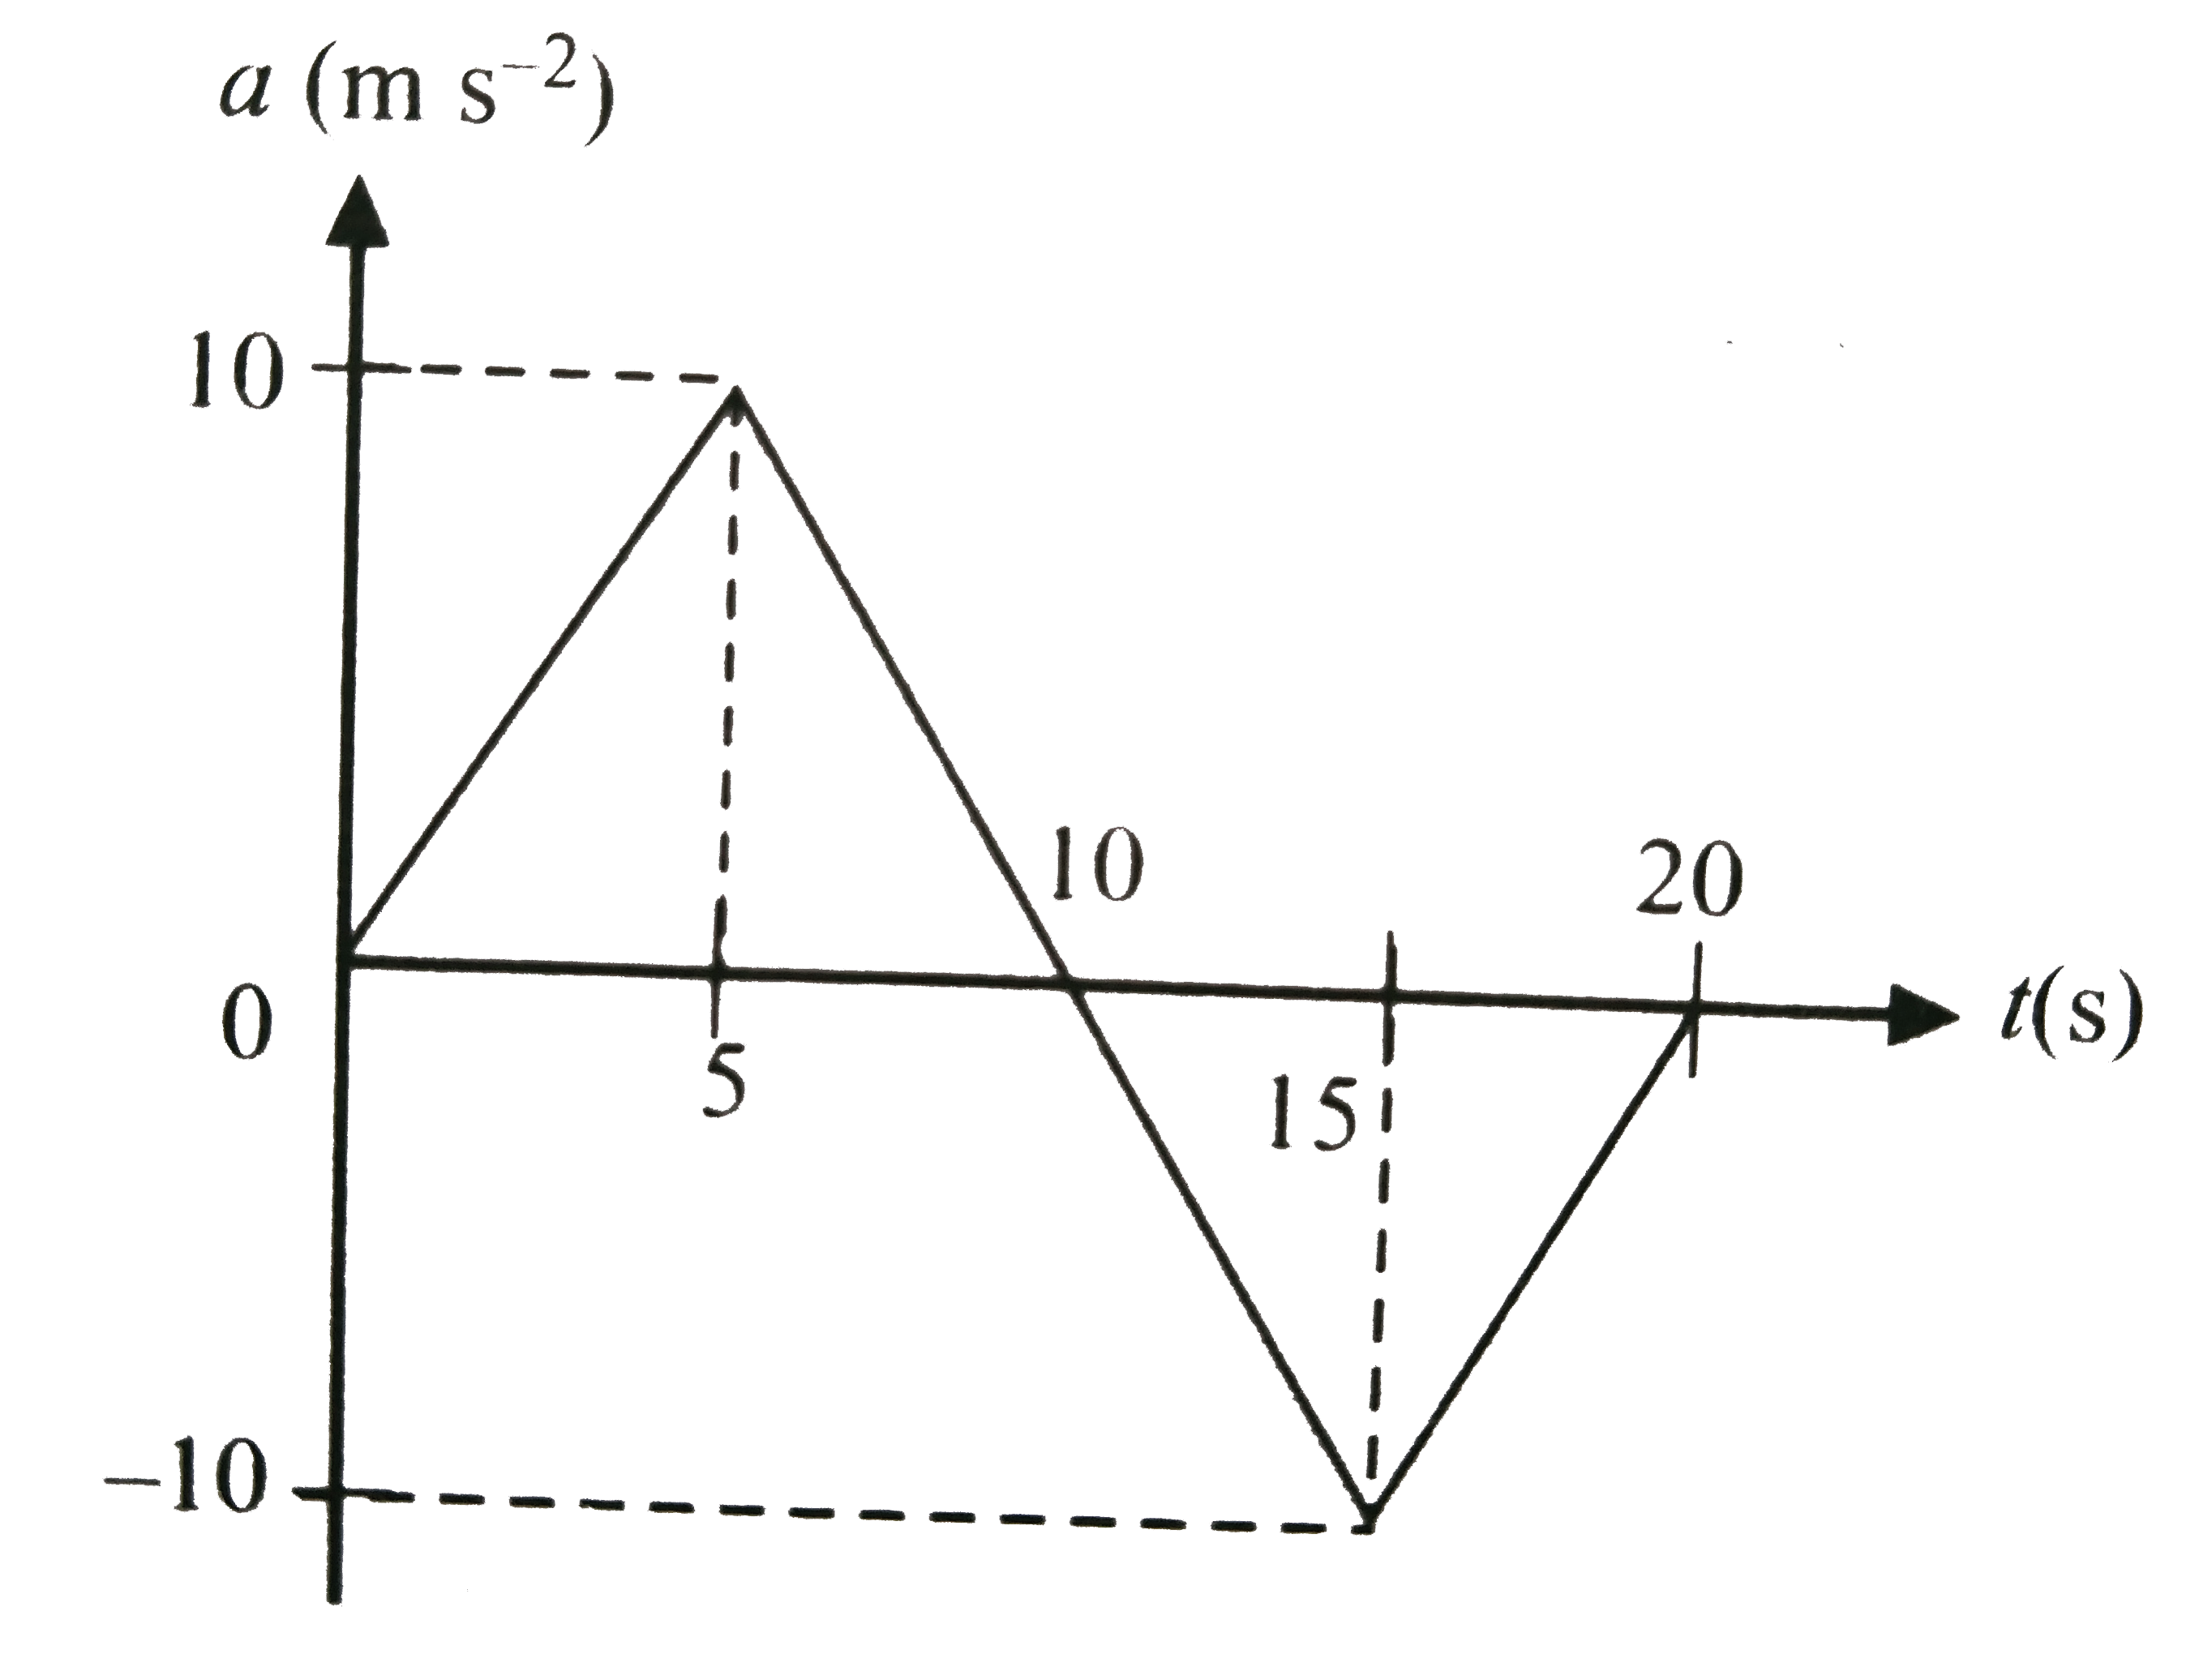 .A
.A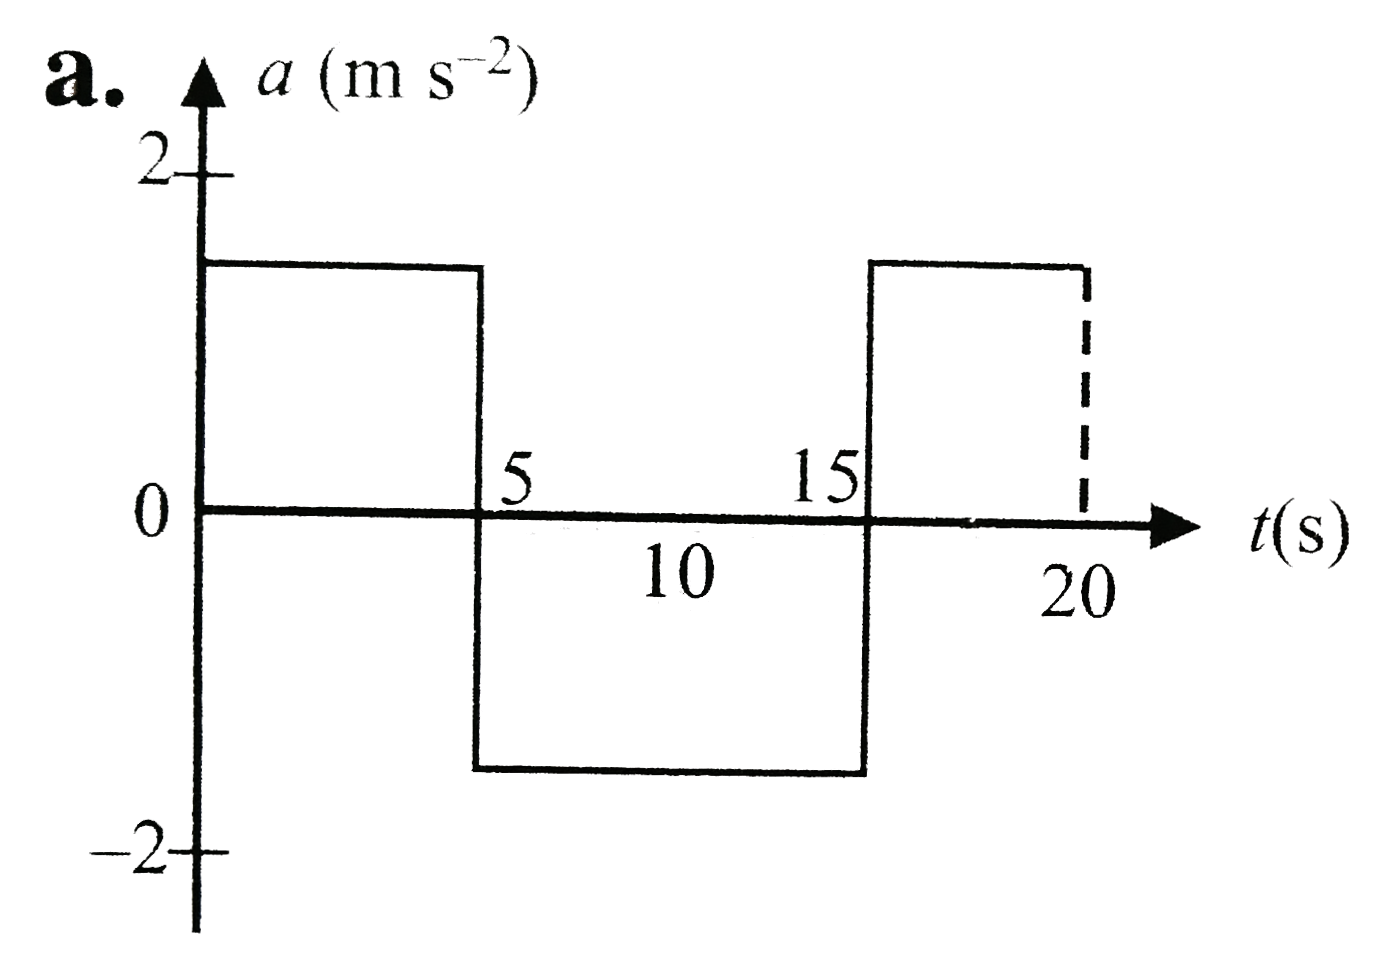 .B
.B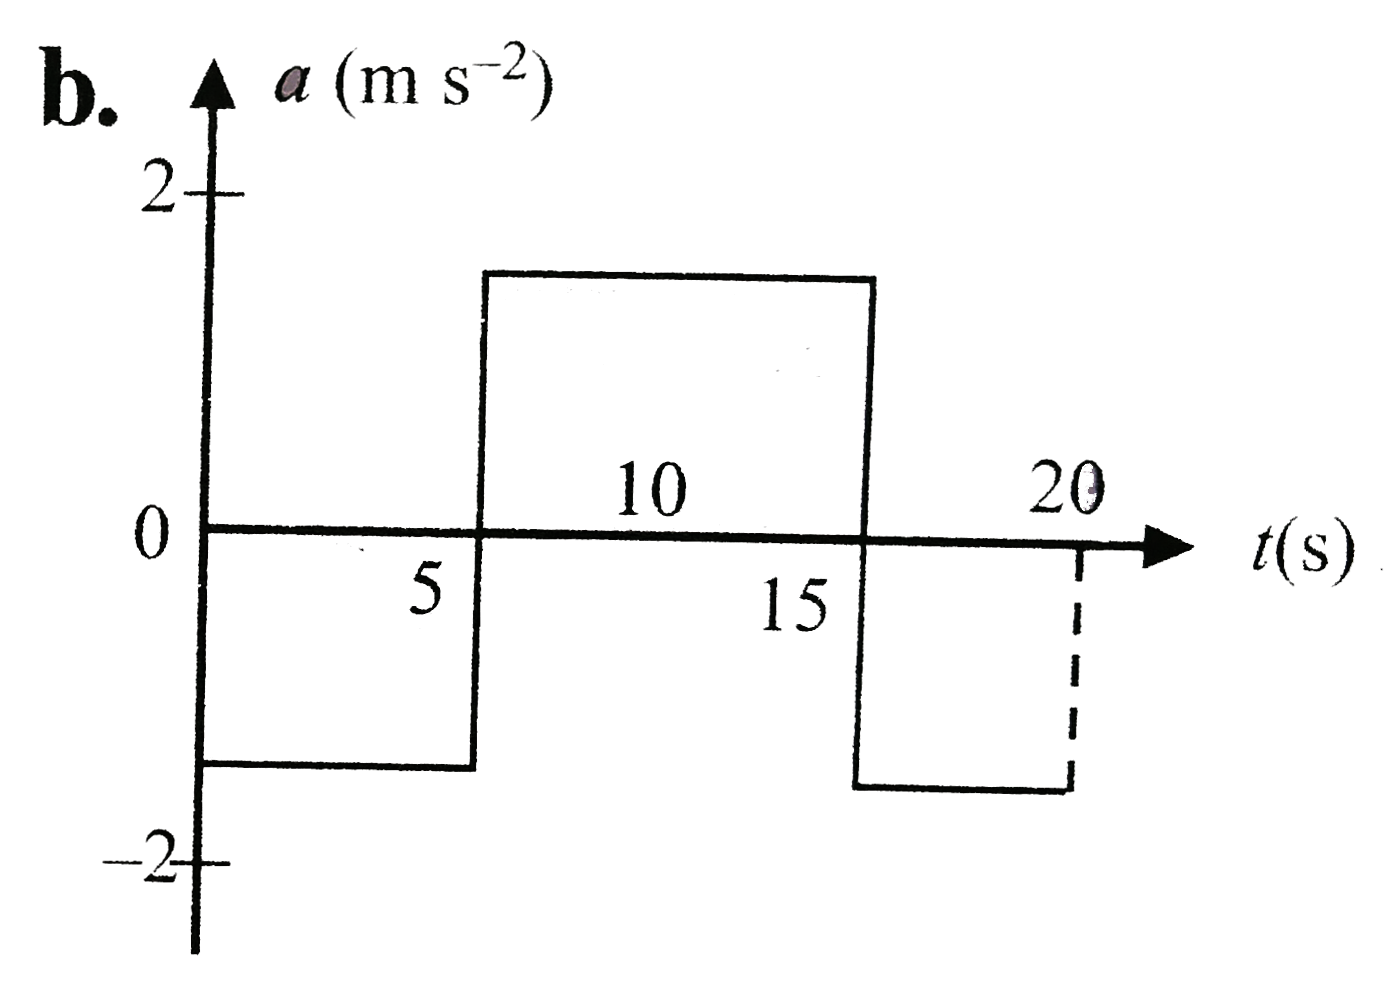 .C
.C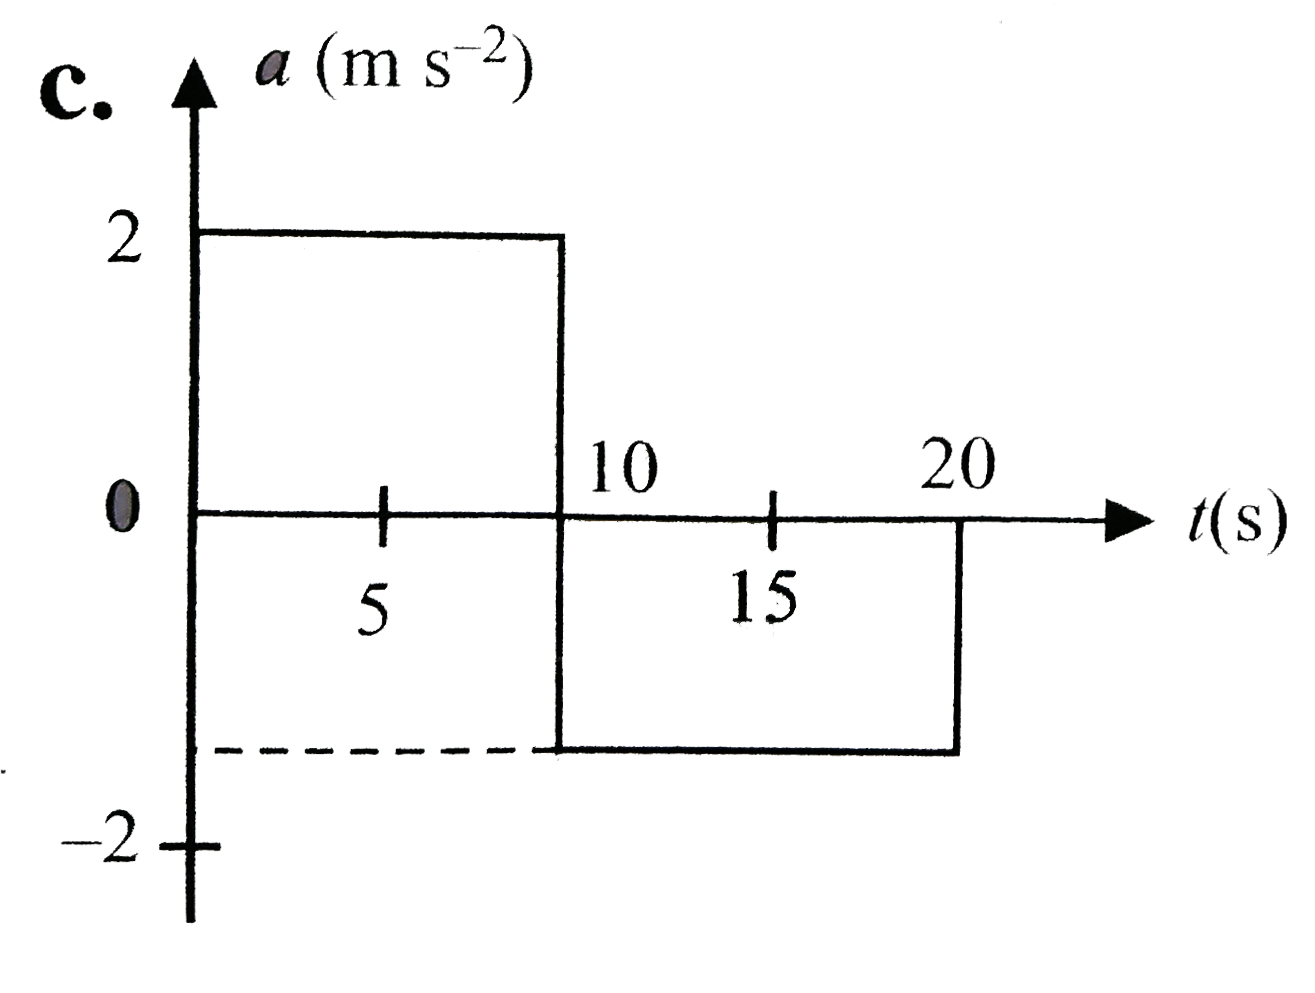 .D
.D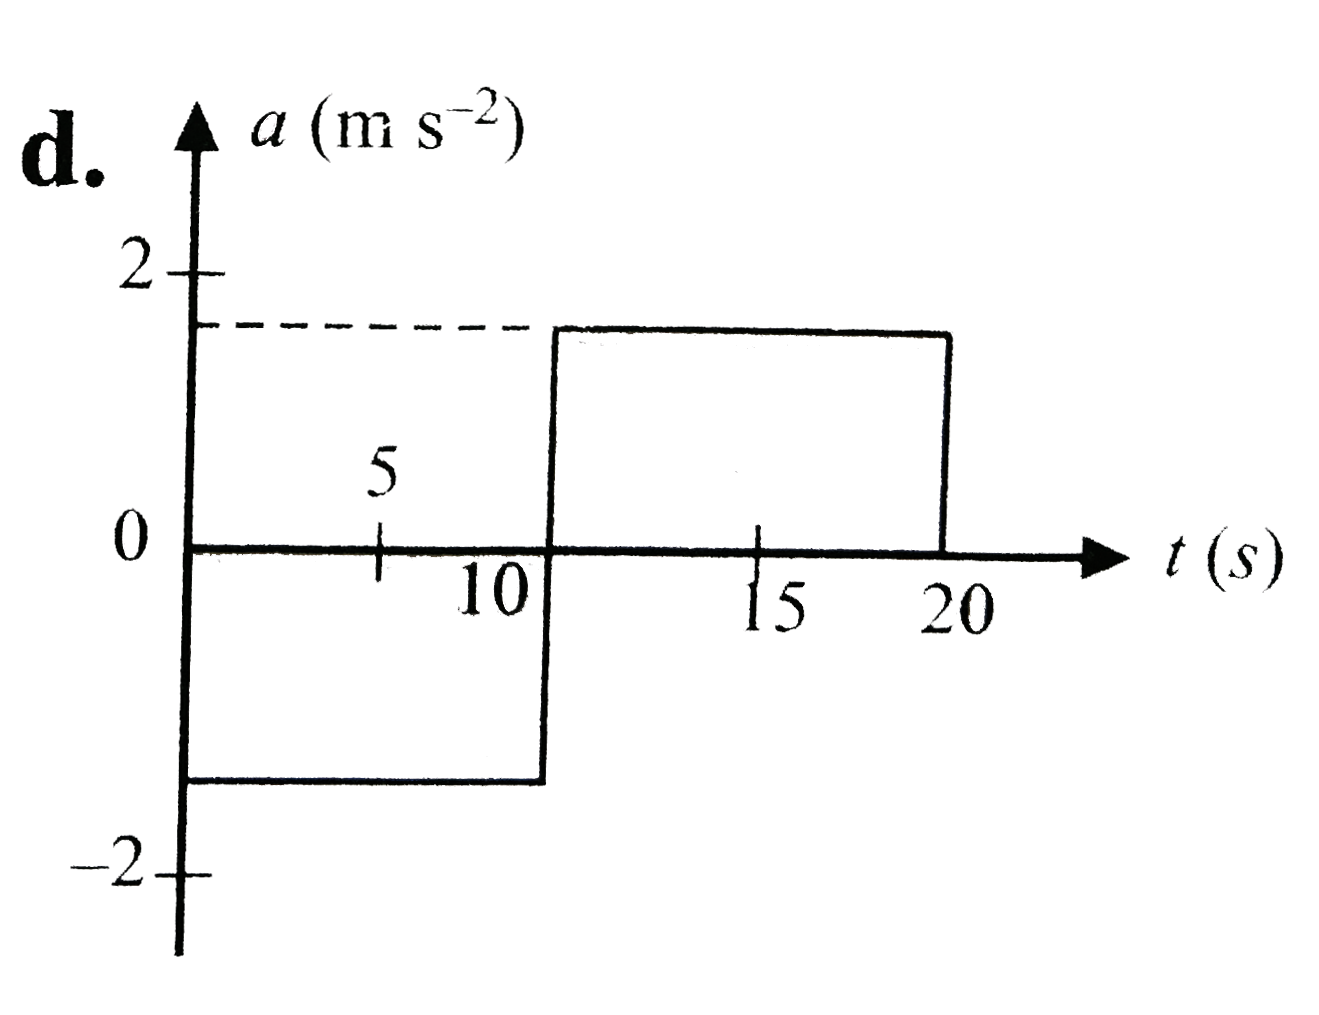 .
.
Draw the position-time graph for an object in uniform motion. Show that the slope of the position-time graph gives the velocity of the object.
View SolutionPlot the acceleration-time graph of the welocity-time graph given in.
 .
.
View SolutionA graph is plotted with PV/T on y-axis and mass of the gas along x-axis for different gases. The graph is
View SolutionA graph is plotted with PV/T on y-axis and mass of the gas along x-axis for different gases. The graph is
View SolutionFor a zero order reaction a graph of conc. (along Y axis) and time (along X-axis) is linear with
View Solution
