A graph is plotted with PV/T on y-axis and mass of the gas along x-axis for different gases. The graph is
a straight line parallel to x-axis for all the gases
a straight line passing through origin with a slope having a constant value for all the gases
a straight line passing through origin with a slope having different values for different gases
a straight line parallel to y-axis for all the gases
Step by step video & image solution for A graph is plotted with PV/T on y-axis and mass of the gas along x-axis for different gases. The graph is by Physics experts to help you in doubts & scoring excellent marks in Class 11 exams.
Updated on:21/07/2023Topper's Solved these Questions
Similar Questions
A graph is plotted by taking pressure along y-axis and centigrade temperature along X-axis for an ideal gas at constant volume. x intercept of the graph is
View SolutionA graph is plotted between PVm along Y-axis and P along X-axis whre Vm is the molar voulume of a real gas Find the intercept along Y-axis .
View Solution
Knowledge Check
A graph is drawn with a force along y-axis and time along x-axis. The area under the graph represent–
AMomentumBCoupleCMoment of the forceDImpulse of the forceA graph is plotted taking .∘C along the Y-axis and .∘F along the X-axis. It is a/an
AparabolaBstraight lineCellipseDcircle(a) Name an instrument that measures electric current in a circuit. Define the unit of electric current.
(b) What do the following symbols, (Fig. 3.58) mean in a circuit diagram ?

(c) An electric circuit consisting of a 0.5m long nichrome wire XY, an ammeter, a voltmeter, four cells of 1.5V each and a plug key was set up.
(i) Draw a diagram of this electric circuit to study the relation between the potential difference maintained between the points X and Y and the electric current flowing through XY.
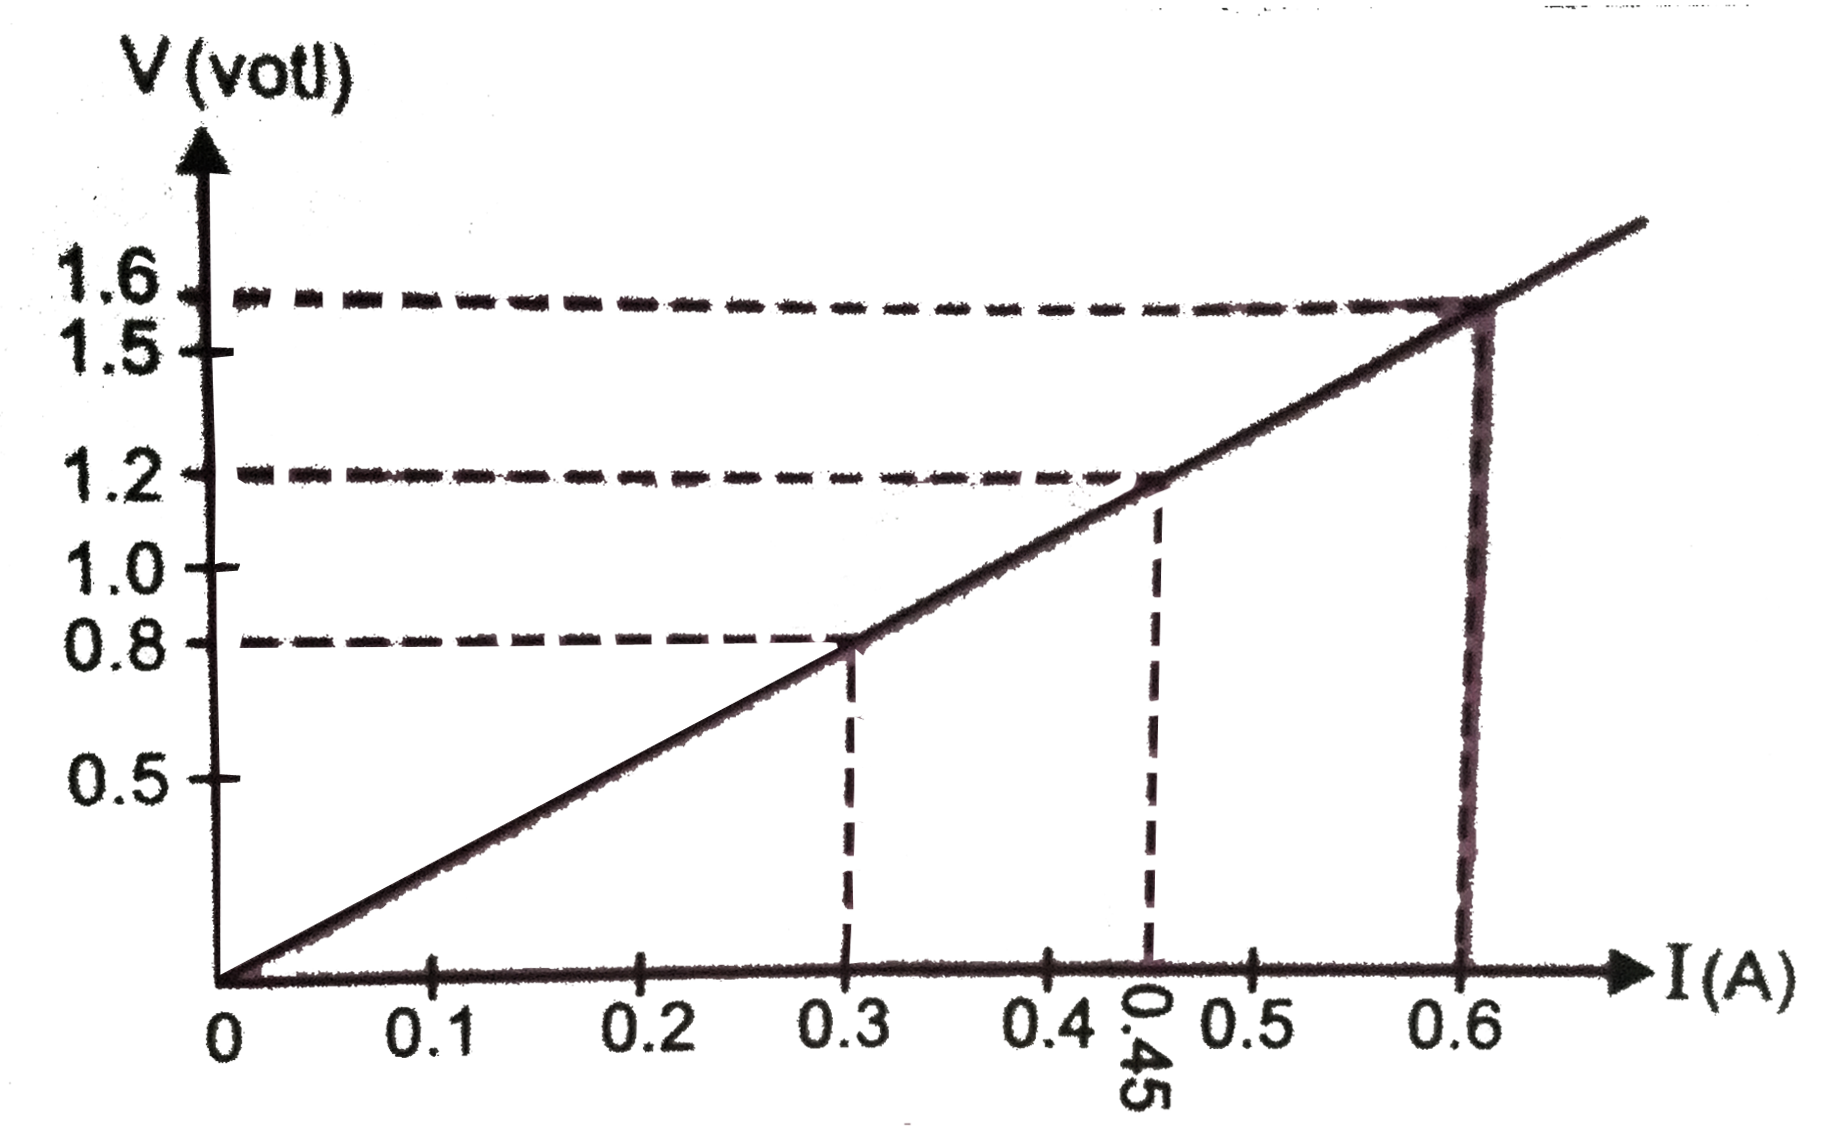
(ii) Graph shown in (Fig. 3.59) was plotted VandI values.
What would be the values of V/I ratios when the potential differences are 0.8V,1.2Vand1.6V respectively ? What conclusion do you draw from these values ?
 .A
.A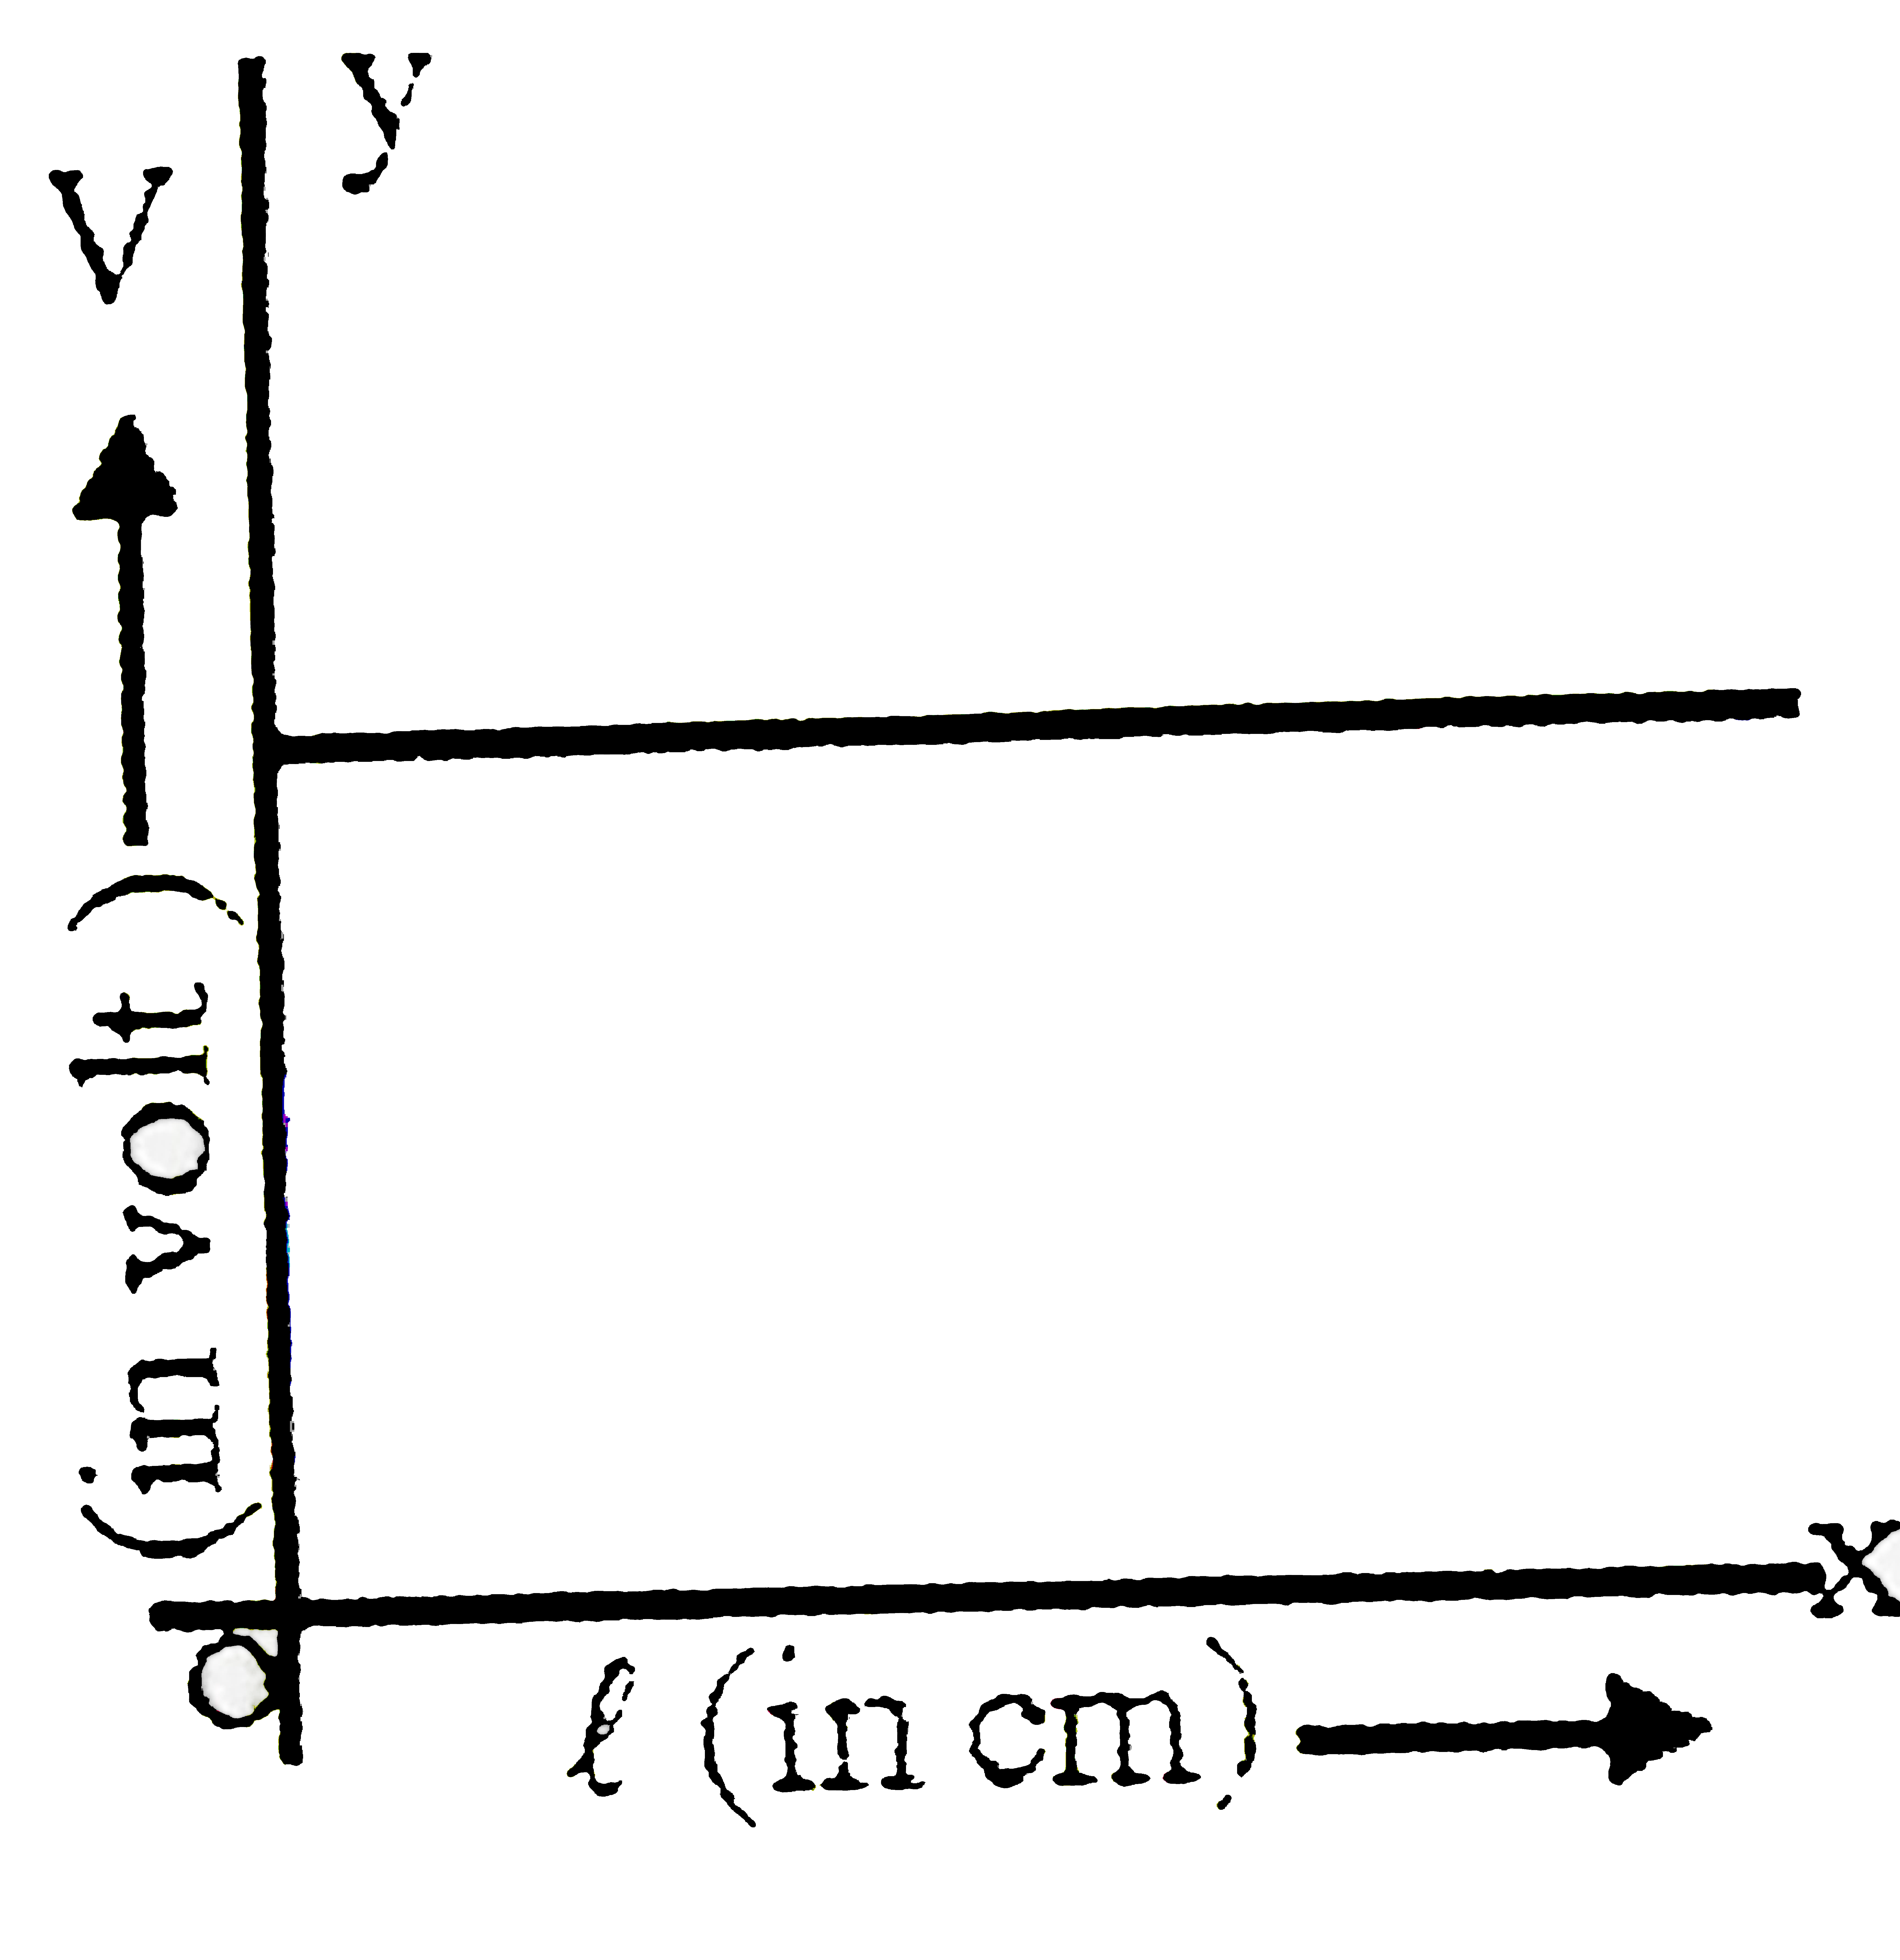 B
B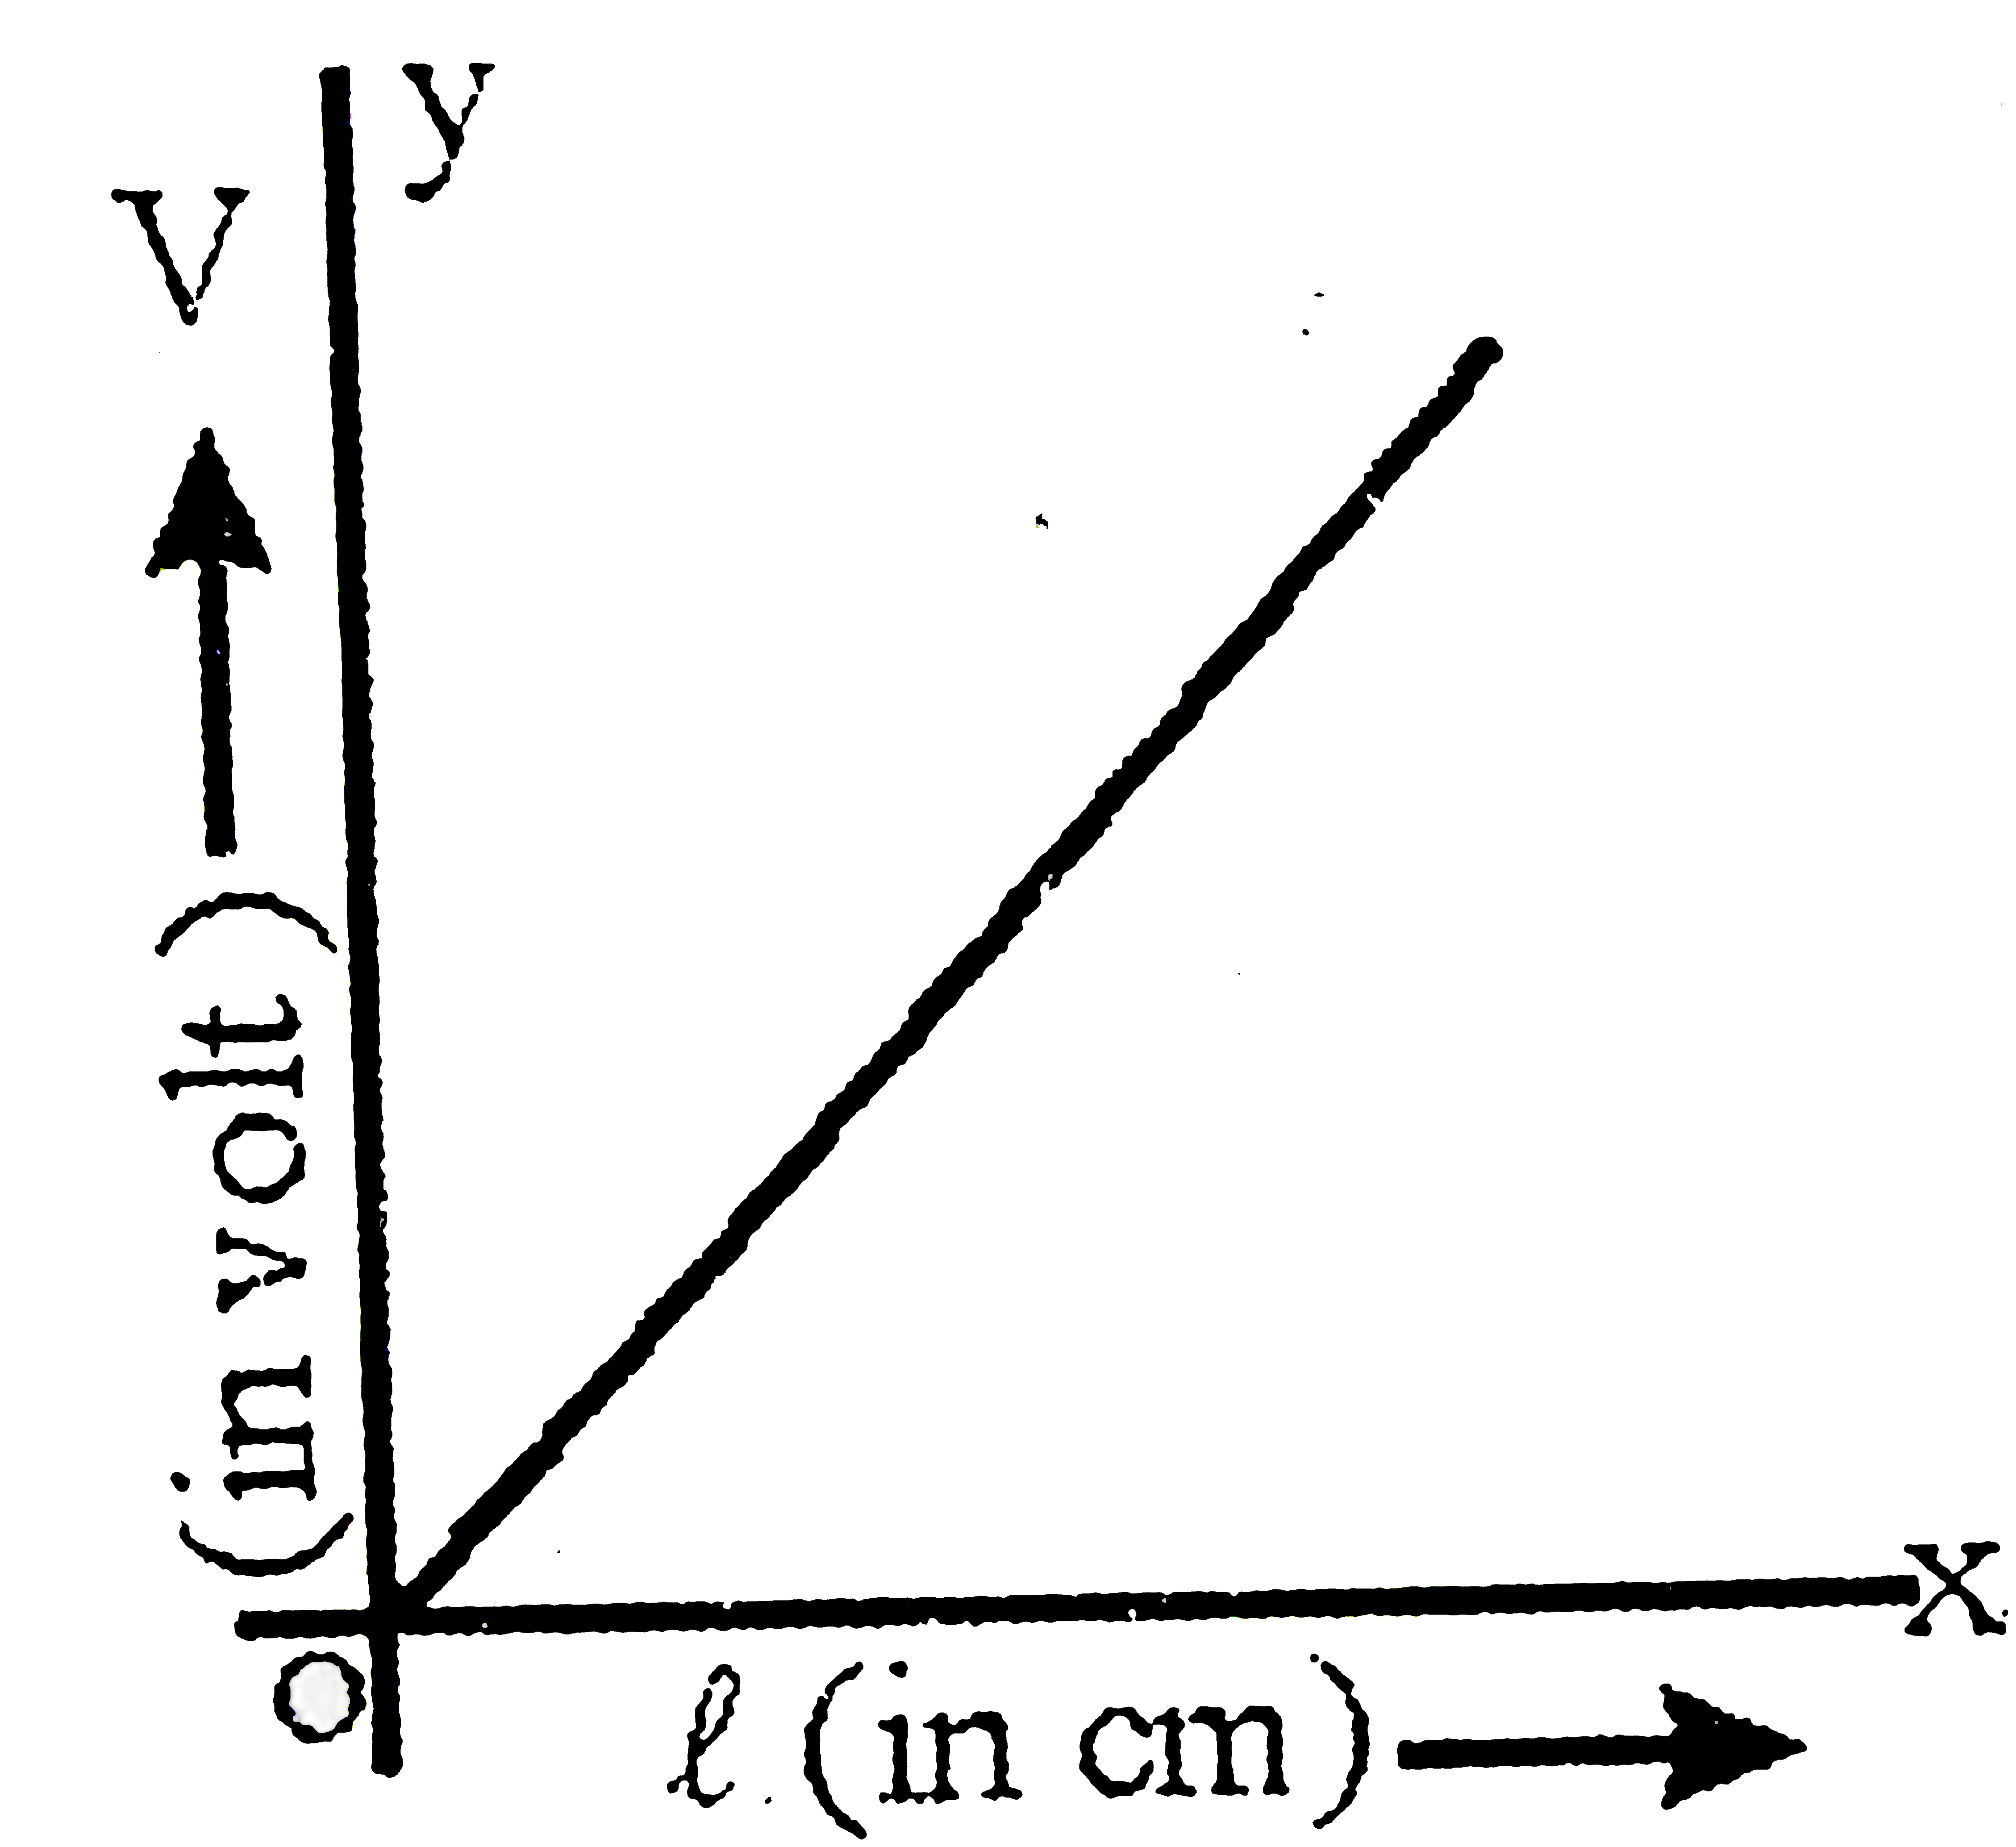 C
C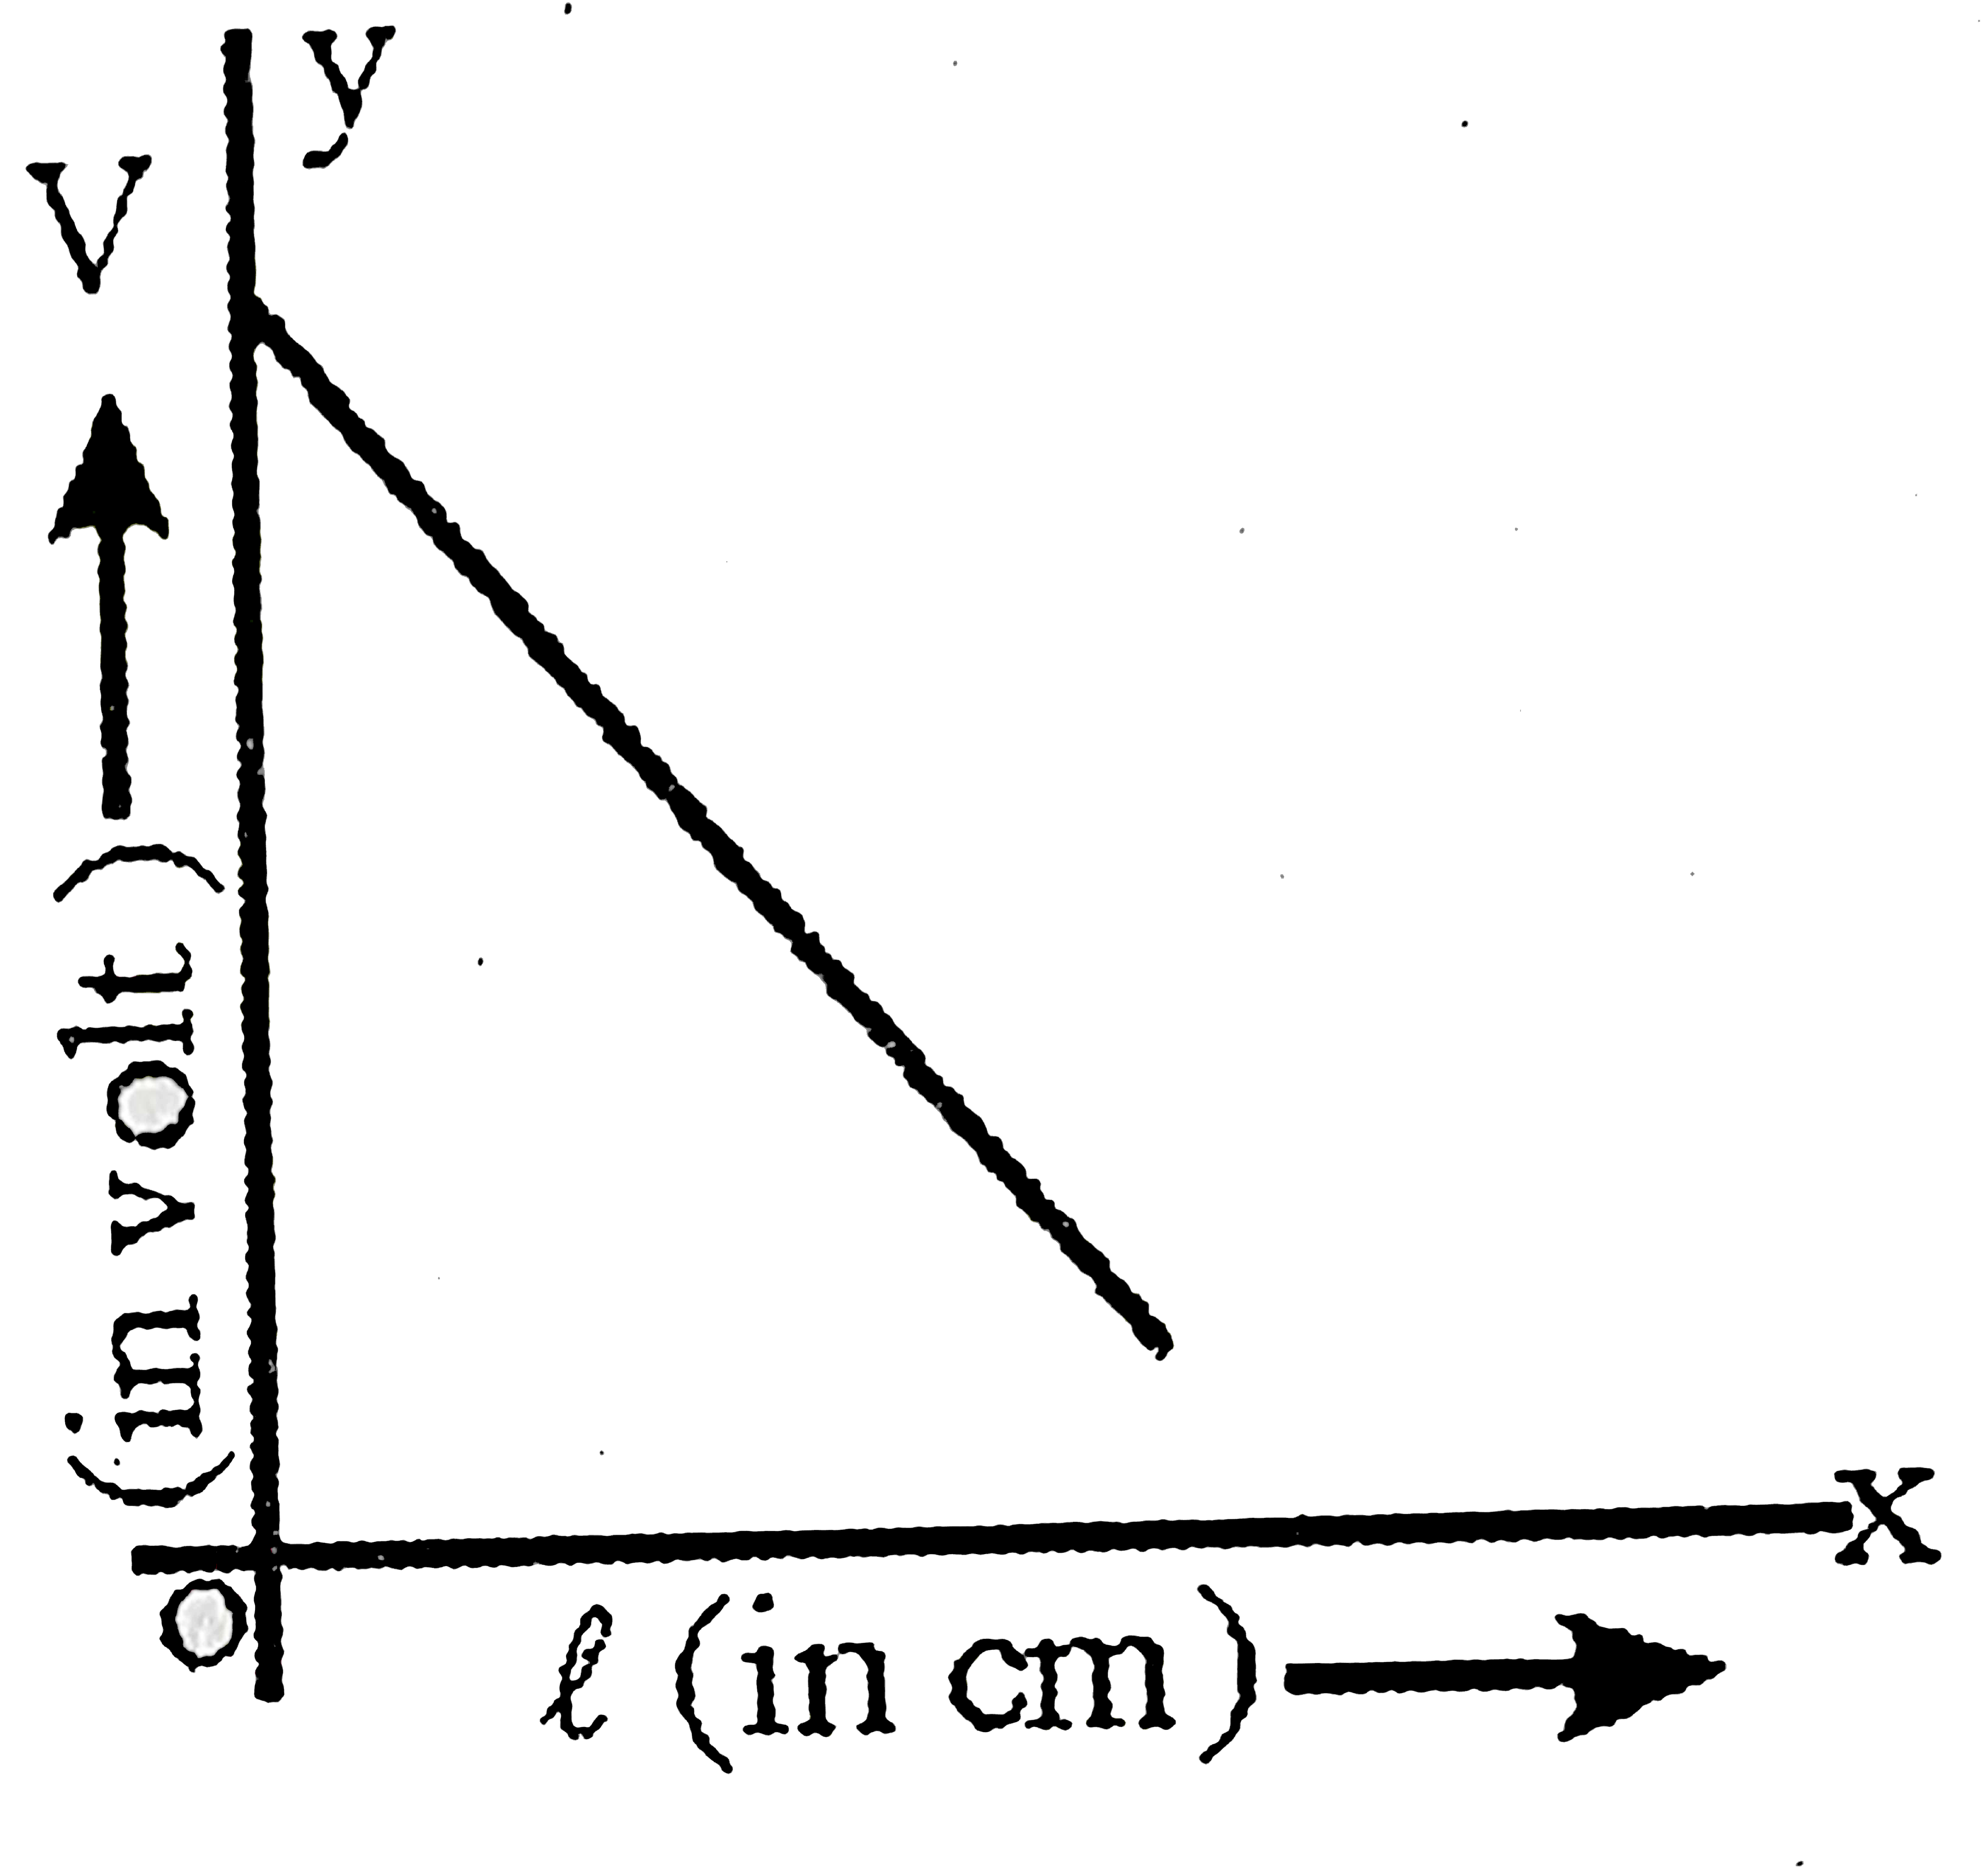 D
D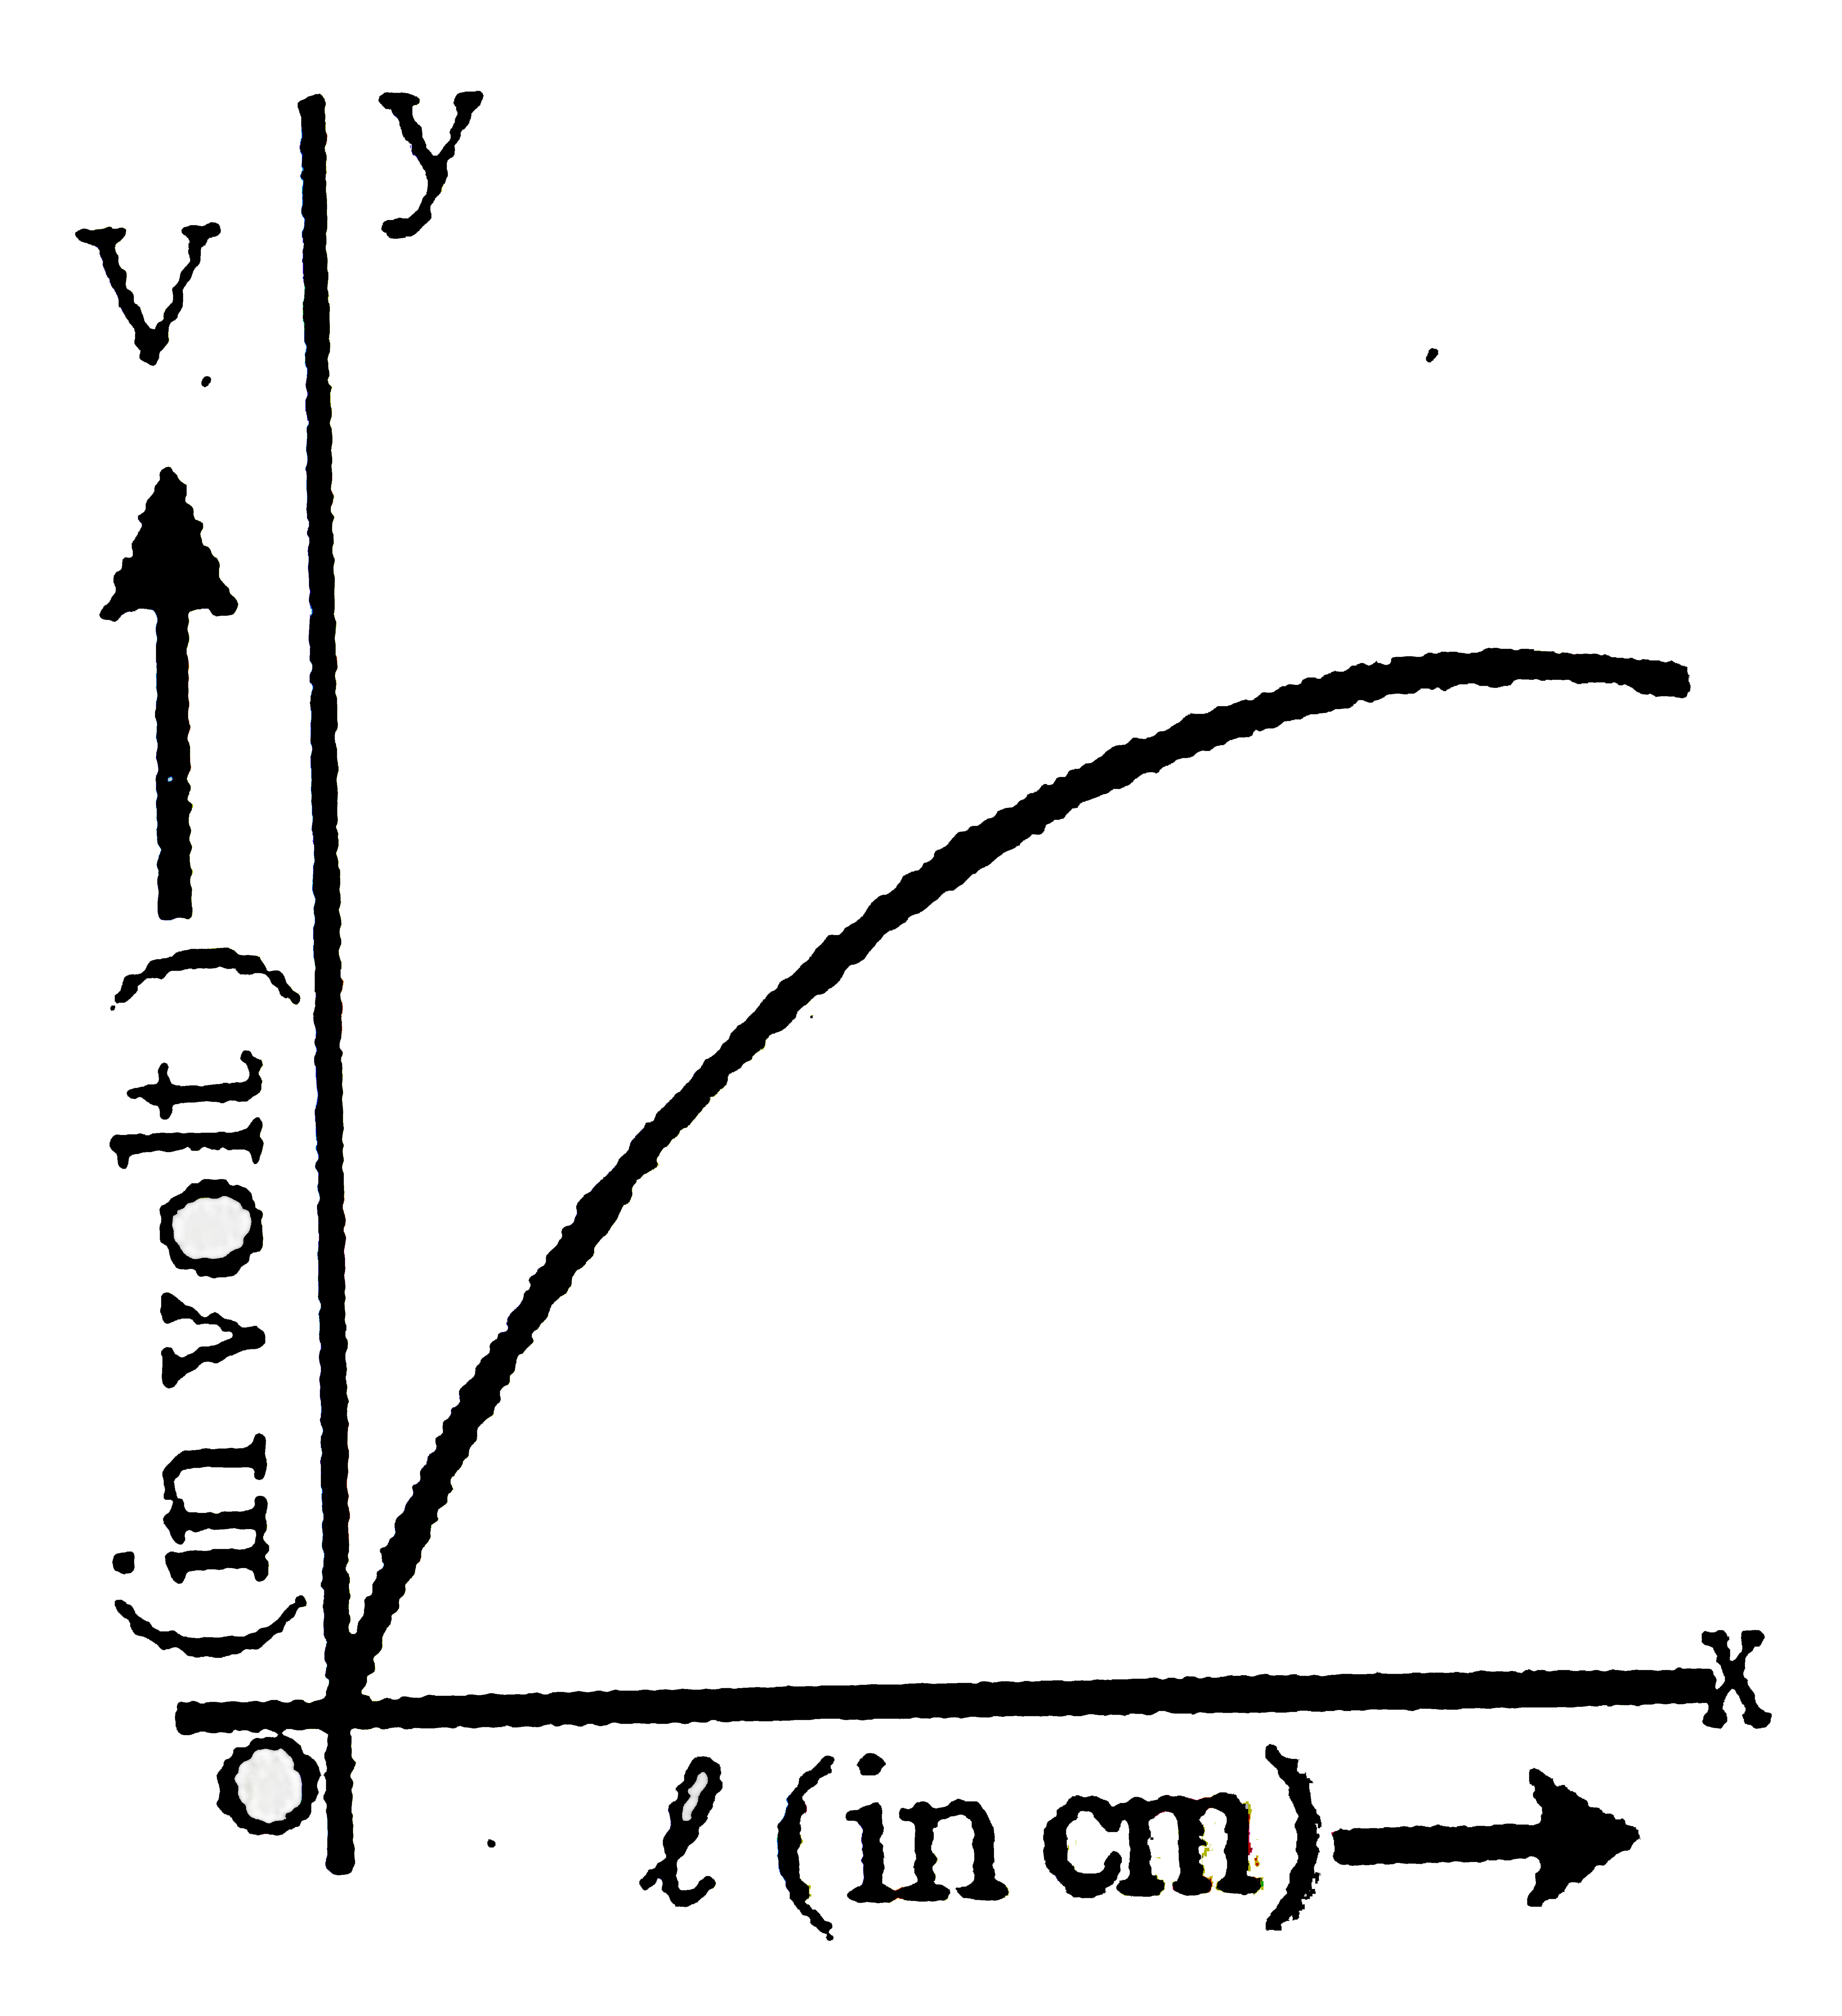
If a graph is plotted by taking spectral emissive power along y-axis and wavelength along X-axis then the area below the graph above wavelength axis is
View SolutionA graph is plotted taking ∘––C along the Y - axis and of along the X - axis .It is a /an
View SolutionA graph is drawn with 1u along x-axis and 1v along the y-axis. If the intercept on the x-axis is 0.5m−1, the focal length of thr lens is (in meter).
View SolutionFor a first order reaction, when a graph is plotted between log10([A])0([A])t on y-axis and time (t) on x-axis , slope of the graph of the graph is equal to __________.
View Solutiona graph between prssure P (along y-axis) and absolute temperature, T(along x-axis) for equal moles of two gases has been drawn . Given that volume of second gas is more than volume of first gas. Which of the following statement is correct?
View Solution