Position - time graph for motion with negative acceleration is


The correct Answer is:B
To draw the position-time graph for motion with negative acceleration, we can follow these steps:
1. Understand the Concept of Negative Acceleration:
- Negative acceleration (deceleration) means that the object is slowing down. This implies that the velocity of the object is decreasing over time.
2. Equation of Motion:
- The equation of motion for an object under constant acceleration is given by:
x=ut+12at2
- For negative acceleration, we can express it as:
x=ut−12|a|t2
- Here, u is the initial velocity, a is the magnitude of acceleration, and t is time.
3. Identify the Shape of the Graph:
- The term −12|a|t2 indicates that the graph will be a downward-opening parabola because the coefficient of t2 is negative.
4. Plotting the Graph:
- On the vertical axis (y-axis), we will plot the position x (in meters).
- On the horizontal axis (x-axis), we will plot time t (in seconds).
- At t=0, the position x will be equal to the initial position (which we can assume as the origin for simplicity).
5. Drawing the Downward Parabola:
- Starting from the origin (0,0), the graph will rise initially (if u>0), reaching a maximum point (the vertex of the parabola) where the velocity becomes zero.
- After reaching the maximum height, the graph will curve downwards, indicating that the object is returning to the ground (or moving back towards the starting point).
6. Labeling Important Points:
- The highest point of the graph (the vertex) represents the maximum displacement where the velocity is zero.
- The point where the graph intersects the time axis again represents when the object returns to the starting position.
Final Graph:
- The final graph will be a downward-opening parabola starting from the origin, peaking at a certain point, and then descending back towards the time axis.
- Negative acceleration (deceleration) means that the object is slowing down. This implies that the velocity of the object is decreasing over time.
- The equation of motion for an object under constant acceleration is given by:
x=ut+12at2
- For negative acceleration, we can express it as:
x=ut−12|a|t2
- Here, u is the initial velocity, a is the magnitude of acceleration, and t is time.
- The term −12|a|t2 indicates that the graph will be a downward-opening parabola because the coefficient of t2 is negative.
- On the vertical axis (y-axis), we will plot the position x (in meters).
- On the horizontal axis (x-axis), we will plot time t (in seconds).
- At t=0, the position x will be equal to the initial position (which we can assume as the origin for simplicity).
- Starting from the origin (0,0), the graph will rise initially (if u>0), reaching a maximum point (the vertex of the parabola) where the velocity becomes zero.
- After reaching the maximum height, the graph will curve downwards, indicating that the object is returning to the ground (or moving back towards the starting point).
- The highest point of the graph (the vertex) represents the maximum displacement where the velocity is zero.
- The point where the graph intersects the time axis again represents when the object returns to the starting position.
- The final graph will be a downward-opening parabola starting from the origin, peaking at a certain point, and then descending back towards the time axis.
Topper's Solved these Questions
- KINEMATICS BOOK - MTG GUIDECHAPTER - KINEMATICS EXERCISE - Topicwise Practice Questions (KINEMATIC EQUATIONS FOR UNIFORMLY ACCELERATED MOTION
48 Videos
- KINEMATICS BOOK - MTG GUIDECHAPTER - KINEMATICS EXERCISE - Topicwise Practice Questions (RELATIVE VELOCITY)
15 Videos
- KINEMATICS BOOK - MTG GUIDECHAPTER - KINEMATICS EXERCISE - Topicwise Practice Questions (ACCELERATION)
12 Videos
- GRAVITATIONBOOK - MTG GUIDECHAPTER - GRAVITATIONEXERCISE - AIPMT/NEET MCQS
32 Videos
- LAWS OF MOTIONBOOK - MTG GUIDECHAPTER - LAWS OF MOTIONEXERCISE - AIPMT /NEET (MCQ)
24 Videos
Similar Questions
Knowledge Check
Position-time graph for motion with zero acceleration is
A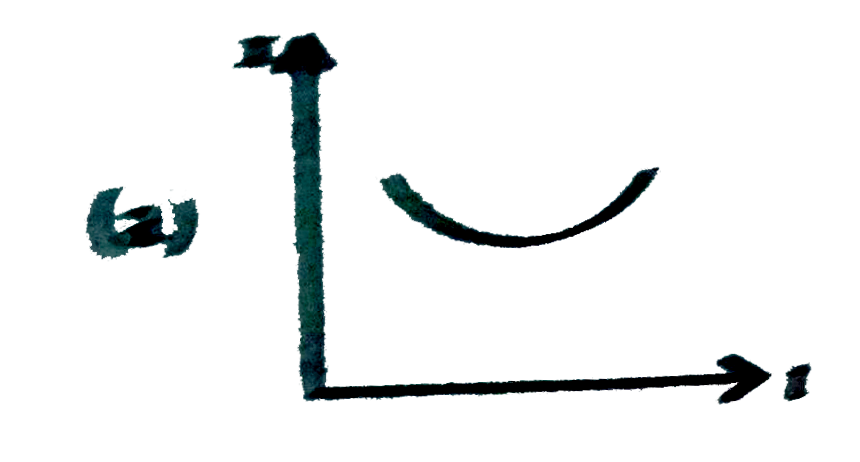 B
B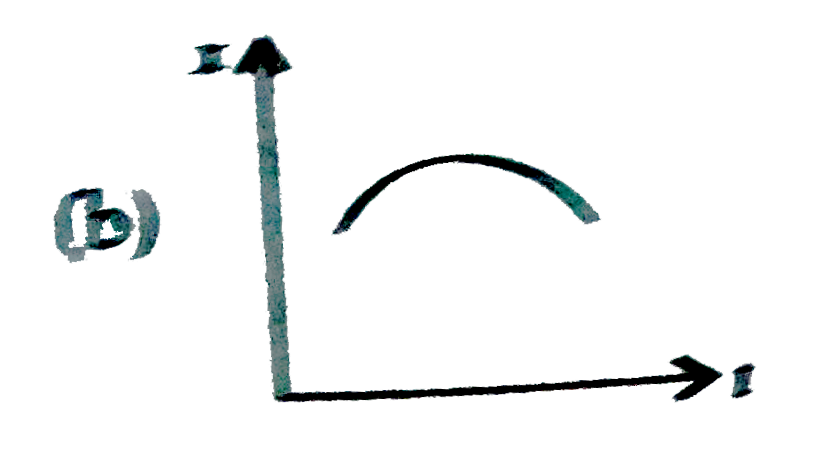 C
C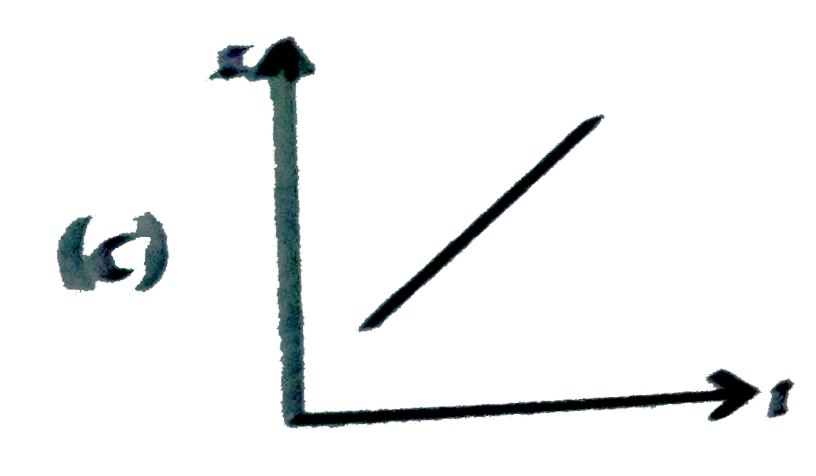 D
D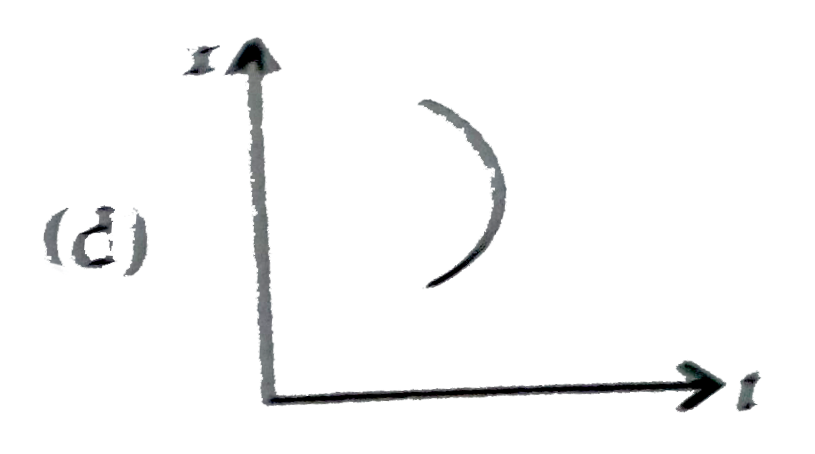
Assertion : The displacement-time graph of a body moving with uniform acceleration is a straight line.
Reason : The displacement is proportional to time for uniformly accelerated motion.AIf both assertion and reason are true and the reason is the correct explanation of the assertion.BIf both assertion and reason are true but reason is not the correct explanation of the assertion.CIf assertion is true but reason is false.DIf the assertion and reason both are falseA body is performing simple harmonic motion of amplitude A and time period T. The figure shown position-time graph of the body . At any time t, acceleration of the body is f, then which of the following graphs is/are appropriate?
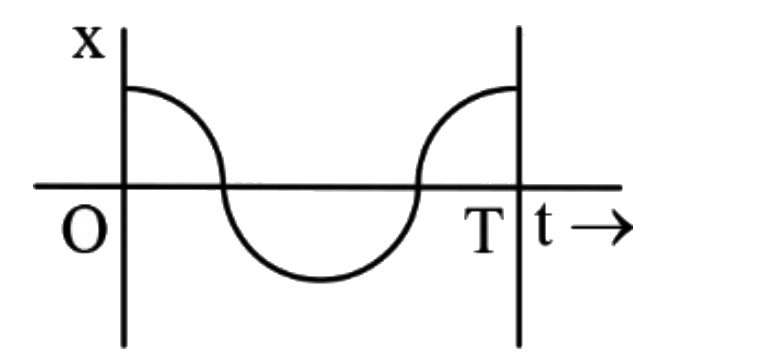 A
A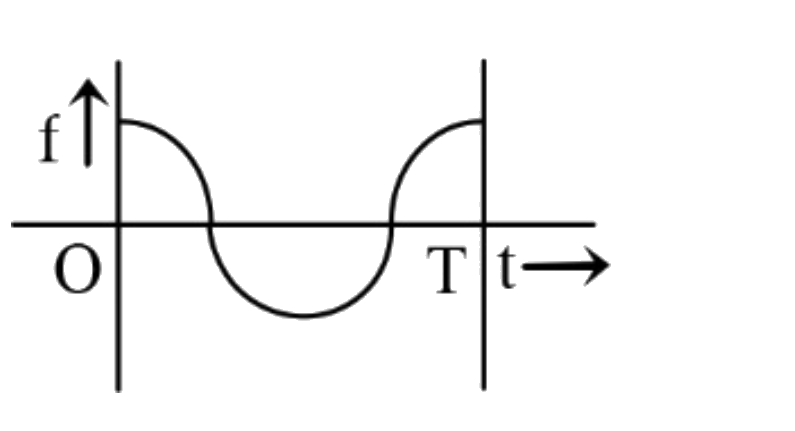 B
B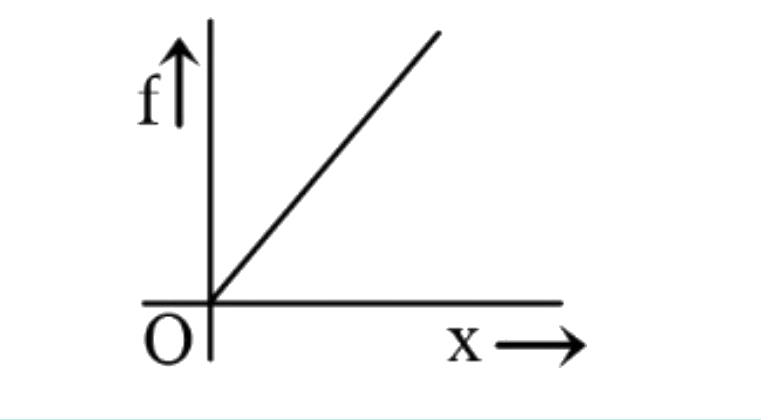 C
C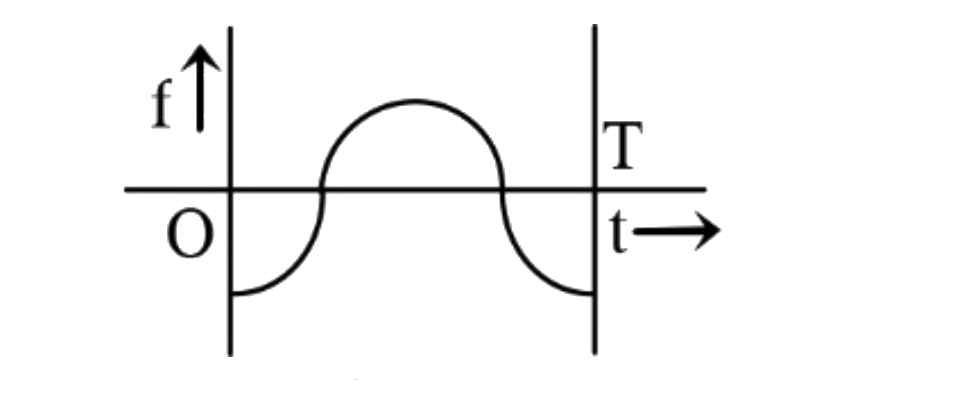 D
D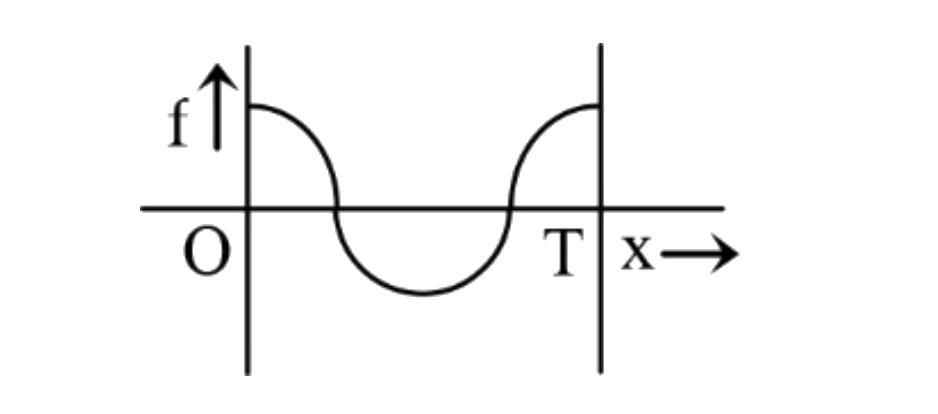
Draw distance time graph of a body moving with :
(i) positive acceleration
(ii) negative acceleration.
View SolutionDraw the velocity-time graph of an object moving with uniform negative acceleration.
View SolutionStatement-1 : The position-time graph of a uniform motion in one dimension of a body can have negative slope.
Statement-2 : When the speed of body decreases with time, the position-time graph of the moving body has negative slope.
View SolutionWhich of the following graphs represents the position time-graph of a particle moving with negative velocity?
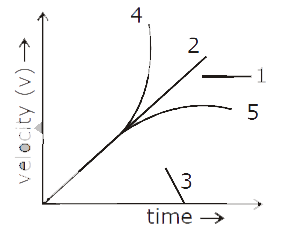
View SolutionFor given velocity time graphs in which case the acceleration is uniform and positive -
View Solution
