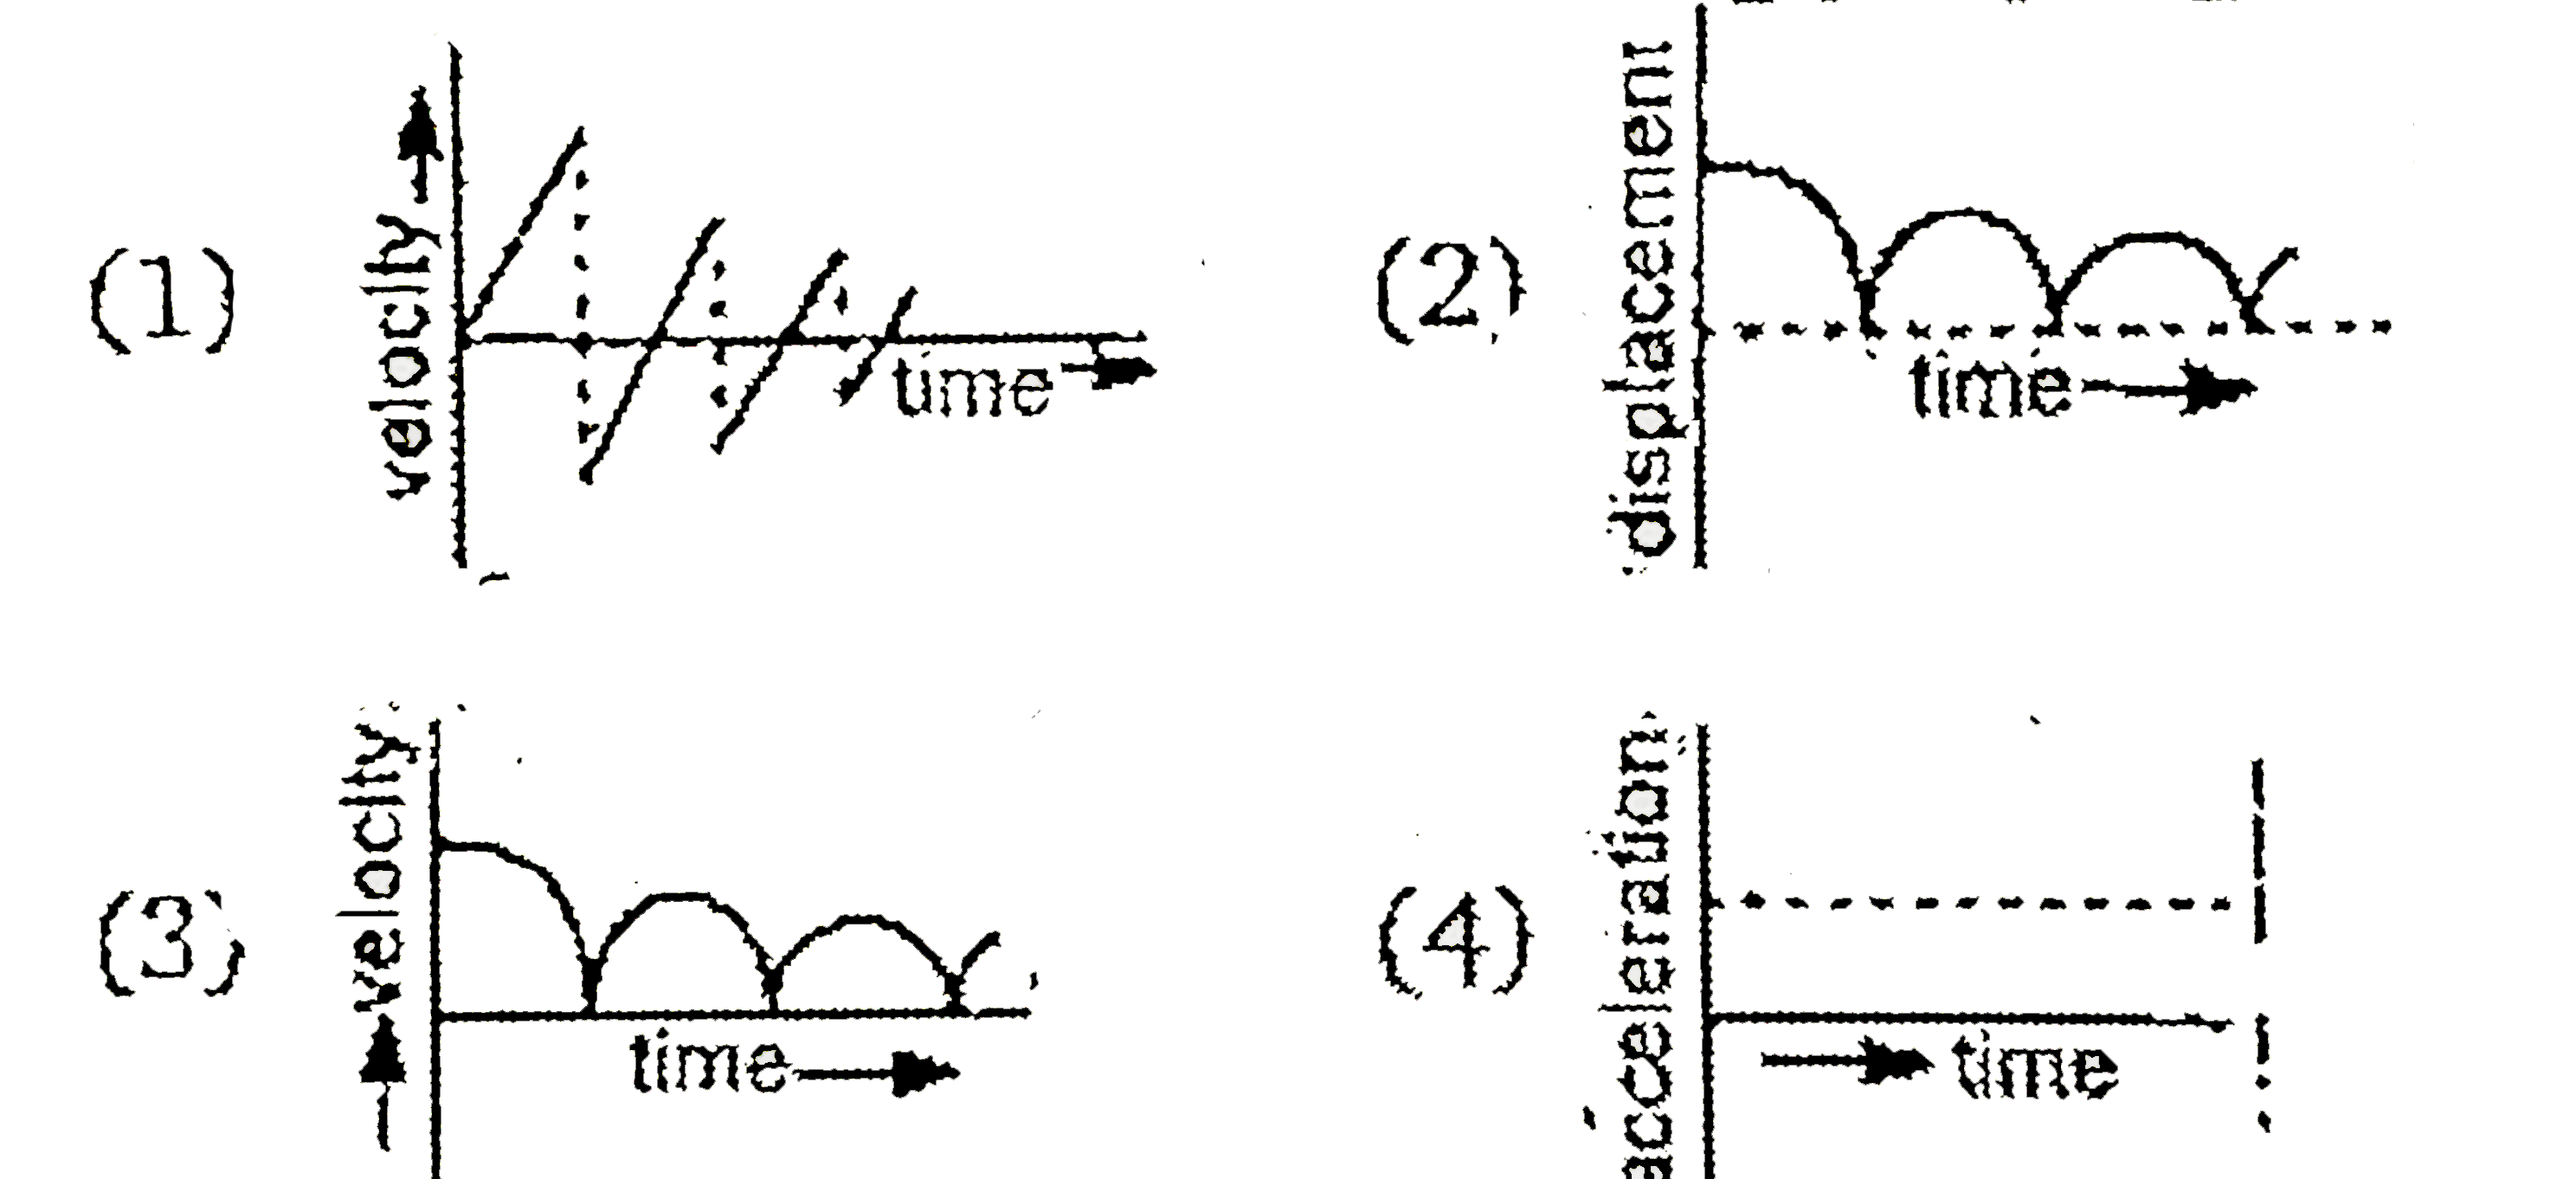
Select the graph (s) which best represent the graph of bouncing ball. Assume ball dropped from height and it losses certain part of energy in each impact,

1,2,3,4
1,2,4
3,2
3,4
The correct Answer is:B
Step by step video, text & image solution for Select the graph (s) which best represent the graph of bouncing ball. Assume ball dropped from height and it losses certain part of energy in each impact, by Physics experts to help you in doubts & scoring excellent marks in Class 11 exams.
Updated on:21/07/2023Topper's Solved these Questions
- IMPULSE AND MOMENTUMBOOK - ANURAG MISHRACHAPTER - IMPULSE AND MOMENTUMEXERCISE - L-2
21 Videos
- IMPULSE AND MOMENTUMBOOK - ANURAG MISHRACHAPTER - IMPULSE AND MOMENTUMEXERCISE - L-3,(P-1)
5 Videos
- IMPULSE AND MOMENTUMBOOK - ANURAG MISHRACHAPTER - IMPULSE AND MOMENTUMEXERCISE - Example
50 Videos
- FORCE ANALYSISBOOK - ANURAG MISHRACHAPTER - FORCE ANALYSISEXERCISE - Matching type
13 Videos
- RIGID BODY MOTIONBOOK - ANURAG MISHRACHAPTER - RIGID BODY MOTIONEXERCISE - MATCH THE COLUMN
12 Videos
Similar Questions
a. A ball is thrown vertically upwards. Aftre some time it trturns to the throuer. Draw the velocity-time graph and speed-time graph.
b. A ball is dropped from some height. After rebounding from the floor, it ascends to the same height. Draw the velocity-time graph and speed-time graph.
View SolutionA tennis ball dropped from a height of 2 m rebounds only 1.5 metre after hitting the ground. What fraction of energy is lost in the impact?
View Solution
Knowledge Check
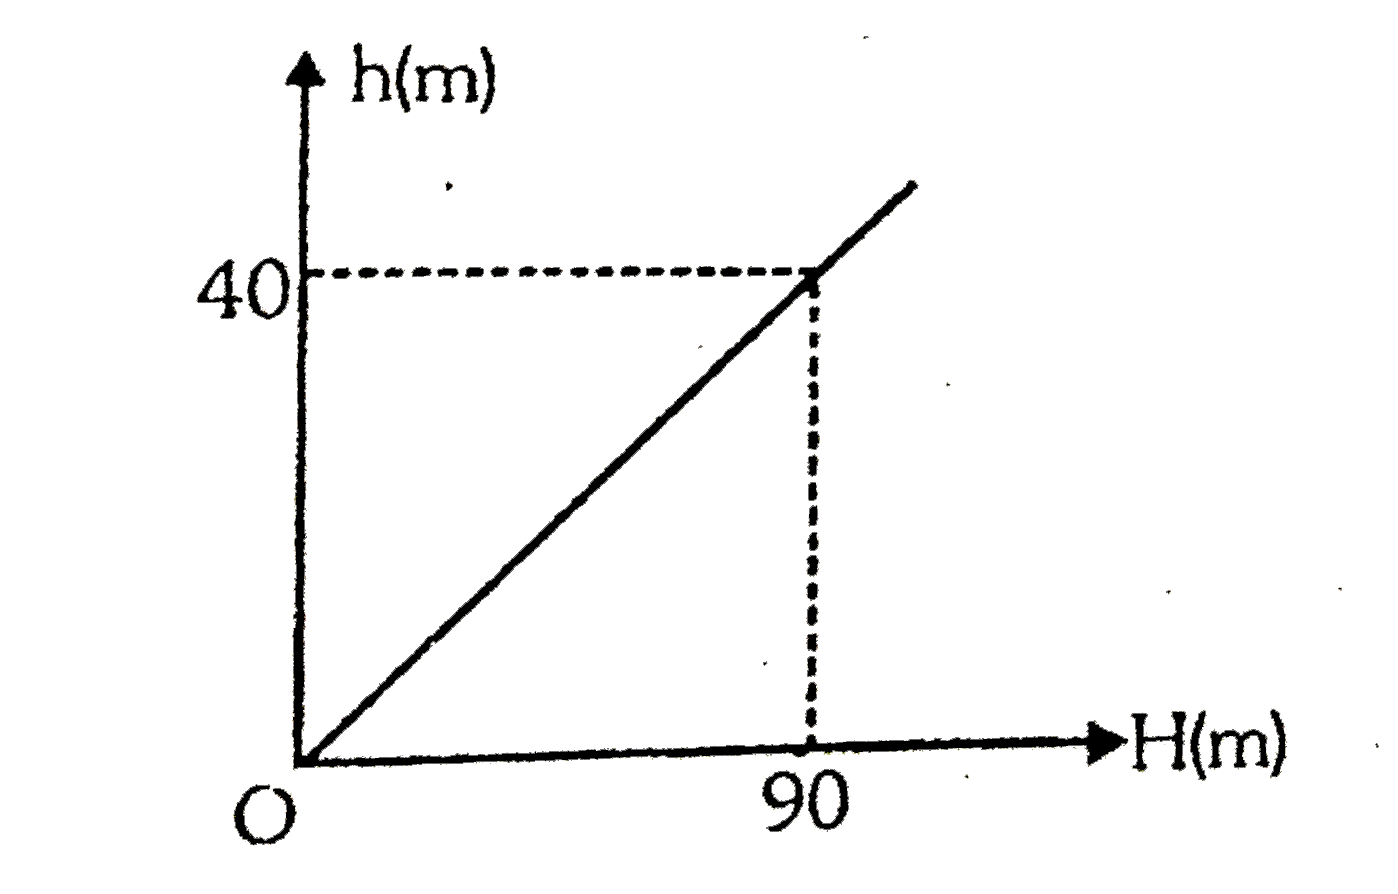
A ball of mass 2kg dropped from a height H above a horizontal surface rebounds to a height h after one bounce. The graph that relates H to h is shown in figure. If the ball was dropped from an initial height of 81 m and made ten bounces, the kinetic energy of the ball immediately after the second impact with the surface was
 A320JB480JC640JDCan't be determined
When a ball is dropped from a certain height the speed of the ball goes on increasing due to
Agravitational forceBbiological forceCmagnetic forceDall of these.An inelastic ball is dropped from a height 100 meter. If due to impact it loses 35% of its energy the ball will rise to a height of
A35 mB65 mC100 mD135 m
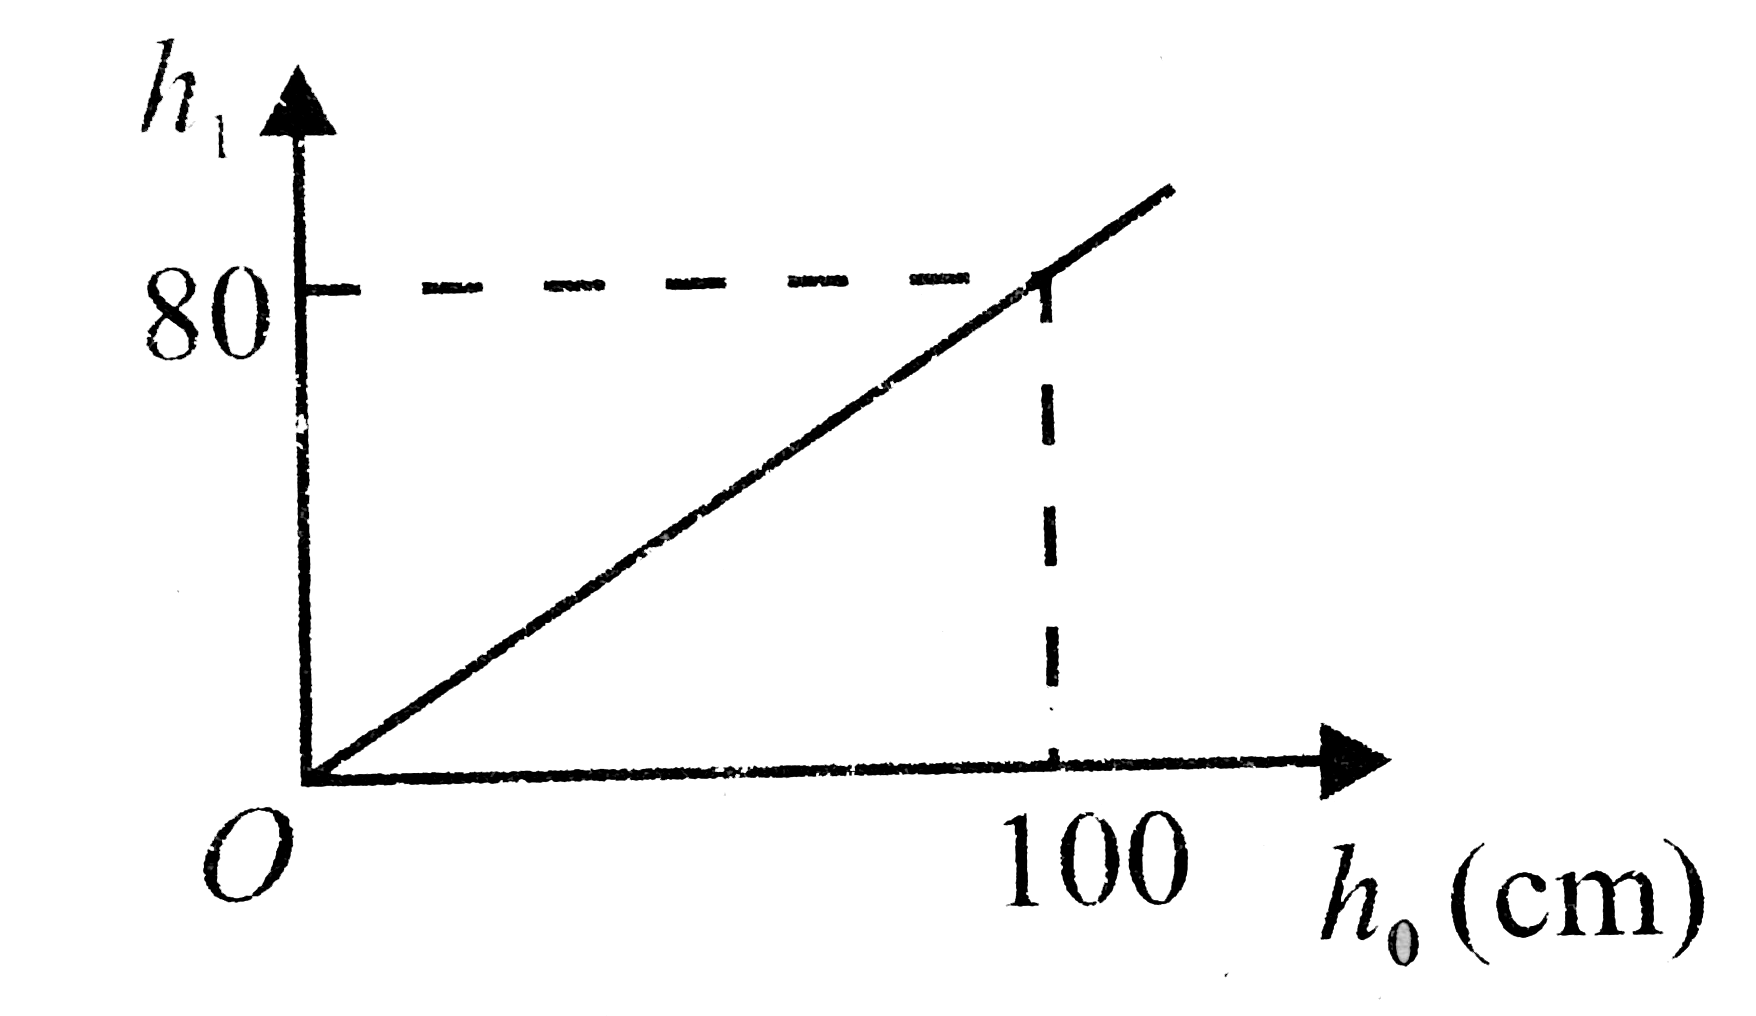
A ball released from a height ho above a horizontal surface rebounds to a height h1, after one bounce. The graph that relates h0 to h1 is shown Fig. If the ball (of the mass m) was dropped from an initial height h and made three bounces, the kinetic energy of the ball immediately after the third impact with the surface was

View SolutionA ball is dropped form a height of 20 cm . Ball rebounds to a height of 10 cm . What is the loss of energy ?
View SolutionA rubber ball falling from a height of 5m rebounds from hard floor to a height of 3.5m. The % loss of energy during the impact is
View SolutionWhich graph in the following figure best represents the variation of velocity with time of a ball which bounces vertically on a hard surface, from the moment when it rebounds from the surface ?
View SolutionA ball is bouncing down a set of stairs. The coefficient of restitution is e. The height of each step is d and the ball bounces one step at each bounce. After each bounce the ball rebounds to a height h above the next lower step. Neglect width of each step in comparison to h and assume the impacts to be effectively head on. Which of the following relative is correct ?
View Solution
