shows a conducting loop being pulled out of a magnetic field with a speed v. Which of lthe four plots shown in may represent the power delivered by the pulling agent as a function of the speed v ?


The correct Answer is:B
Step by step video & image solution for shows a conducting loop being pulled out of a magnetic field with a speed v. Which of lthe four plots shown in may represent the power delivered by the pulling agent as a function of the speed v ? by Physics experts to help you in doubts & scoring excellent marks in Class 12 exams.
Topper's Solved these Questions
- BOOK - HC VERMA ENGLISHCHAPTER - ELECTROMAGNETIC INDUCTIONEXERCISE - Objective 210videos
ELECTROMAGNETIC INDUCTION
- BOOK - HC VERMA ENGLISHCHAPTER - ELECTROMAGNETIC INDUCTIONEXERCISE - EXERCISE98videos
ELECTROMAGNETIC INDUCTION
- BOOK - HC VERMA ENGLISHCHAPTER - ELECTROMAGNETIC INDUCTIONEXERCISE - Worked out examples29videos
ELECTROMAGNETIC INDUCTION
- BOOK - HC VERMA ENGLISHCHAPTER - ELECTRIC FIELD AND POTENTIALEXERCISE - Objective 27videos
ELECTRIC FIELD AND POTENTIAL
- BOOK - HC VERMA ENGLISHCHAPTER - ELECTROMAGNETIC WAVESEXERCISE - Exercise8videos
ELECTROMAGNETIC WAVES
Similar Questions
Fig. Show a rectangular loop MNOP being pulled out of a magnetic field with a uniform velocity v by applying an external force F. The length MN is equal to l and the total resistance of the loop is R. Find(a) the current in the loop,(b) the magnetic force on the loop, (c) the external force F needed to maintain the velocity, (d) the power delivered by the external force and (e) the thermal power developed in the loop.
 View Solution
A body of mass m is acceleratad uniformaly from rest to a speed v in a time T . The instanseous power delivered to the body as a function of time is given by
View SolutionA triangular loop as shown in the figure is started to being pulled out at t=0 form a uniform magnetic field with a constant velocity v. Total resistancee of the loop is constant and equal to R. Then the variation of power produced in the loop with time will be :
 View Solution
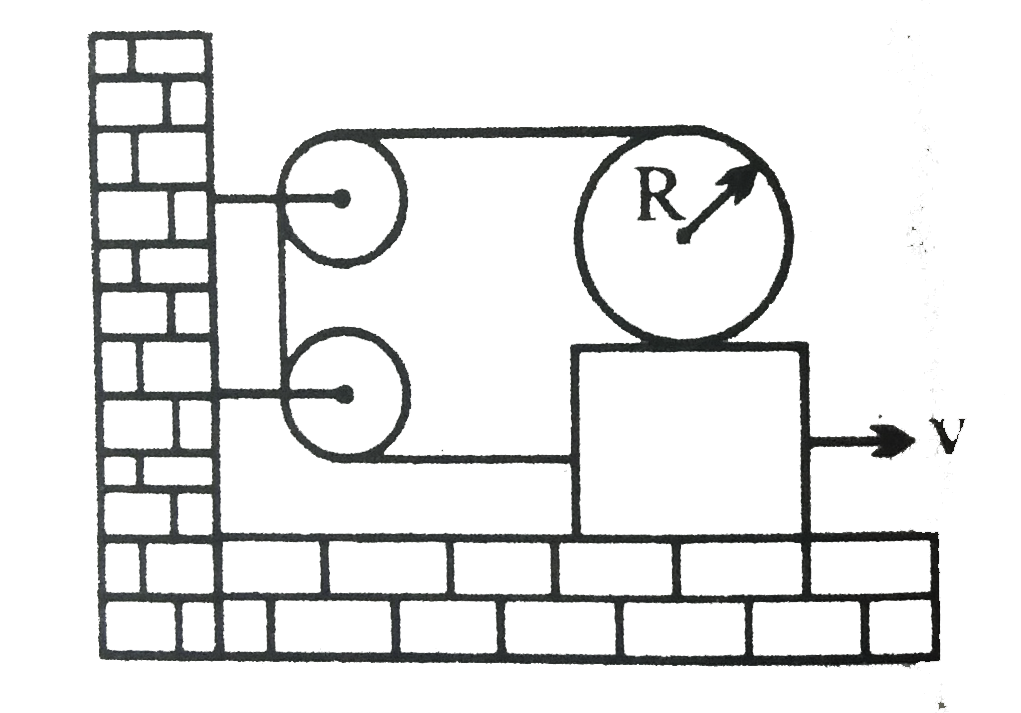
In the figure shown, the plank is being pulled to the right with a constant speed v. If the cylinder does not slip then:
 .View Solution
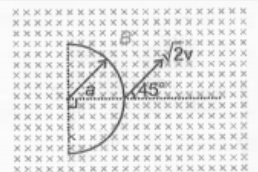
A semicircular conducting wire of radius a is moving perpendicular to a uniform magnetic field B with speed√2vas shown in the figure.The emf induced across the wire Is
 View Solution
A conducting rod of length L slides at a constant velocity V on two parallel conducting rails as shown in figure. The mechanical power required to pull the rod at constant velocity is
 View Solution
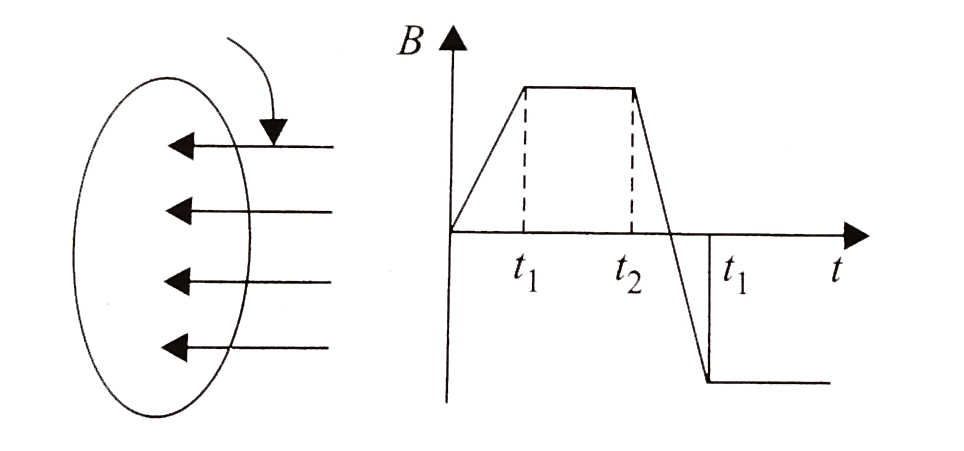
A wire loop is placed in a region of time varying magnetic field which is oriented orthogonally to the plane of the loop as shown in Fig. The graph shows the magnetic field variation as the function of time. Assume the positive emf is the one which drives a current in the clockwise direction and seen by the observer in the direction of B. Which of the following graphs best represents the induced emf as a function of time?
 View Solution
A rectangular loop and a circular loop are moving out of a uniform magnetic field to a field-free region with a constant velocity 'v' as shown in the figure . Explain the which loop do you expect the induced emf to the constant during the passage out of the field region . The magnetic field is normal to the loops .
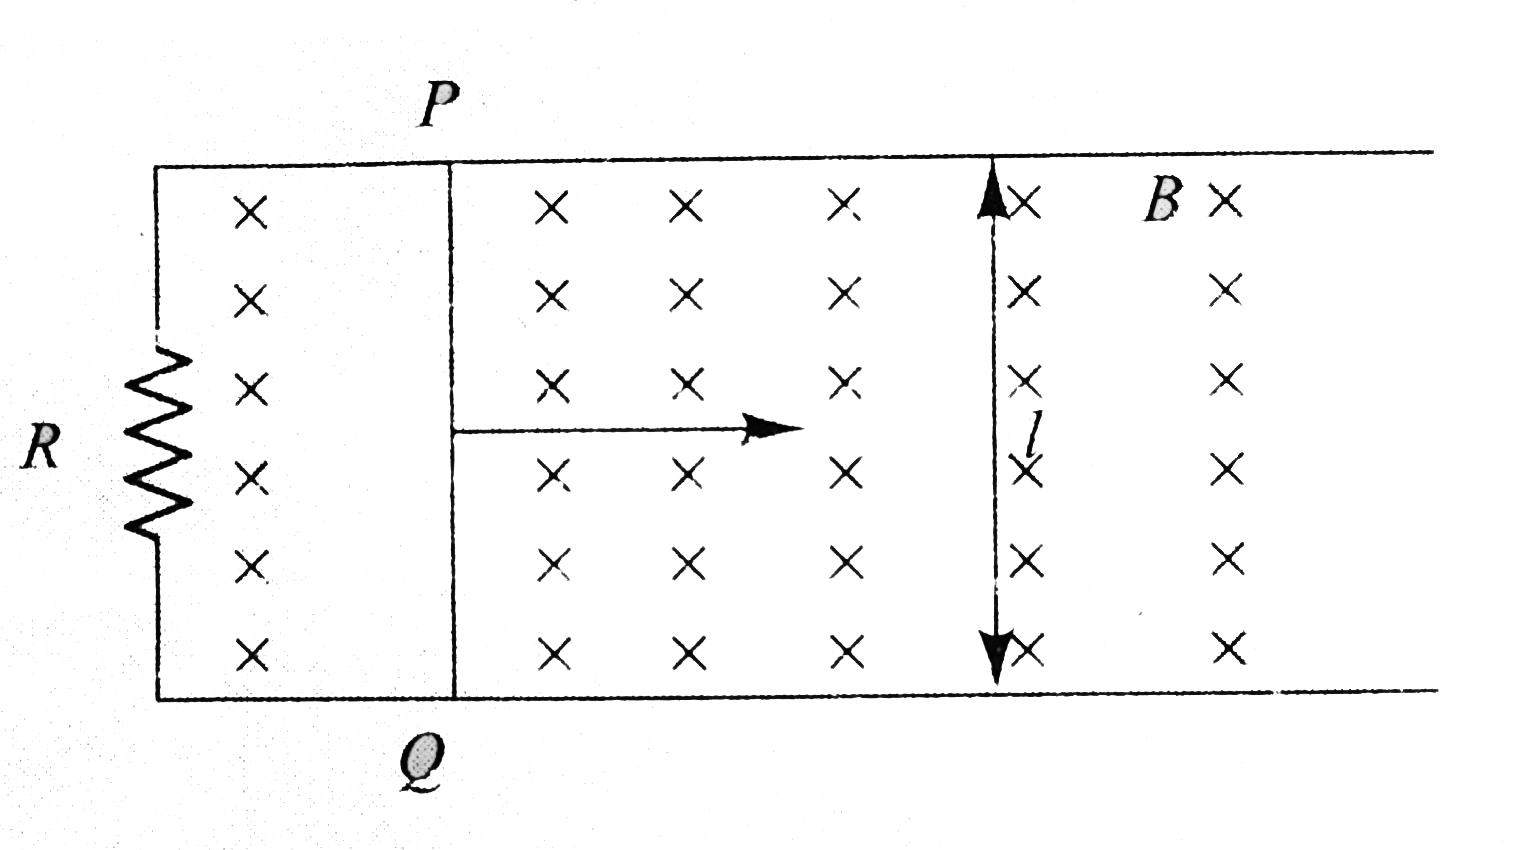
View SolutionA conducting rod of length l slides at constant velocity v on two parallel conducting rails, placed in a uniform and constant magnetic field B perpendicular to the plane of the rails as shown in Fig.3.49. A resistance R is connected between the two ends of the rails.

(a) Idenify the cause which produces change in magnetic flux.
(b) Identify the direction of current in the loop.
( c) Determine the emf induced in the loop.
(d) Compute the electric power dissipated in the resistor.
(e) Calcualte the mechenical power required to pull the rod at a cinstant velovity.View SolutionA horizontal loop abcd is moved across the pole piece of a magnet as shown in the figure. With a constant speed v. When the edge ab of the loop enters the pole pieces at time t=0 sec. Which one of the following graphs presents correctly the induced emf in the coil?
 View Solution

