A horizontal loop abcd is moved across the pole piece of a magnet as shown in the figure. With a constant speed v. When the edge ab of the loop enters the pole pieces at time t=0 sec. Which one of the following graphs presents correctly the induced emf in the coil?


The correct Answer is:D
Step by step video & image solution for A horizontal loop abcd is moved across the pole piece of a magnet as shown in the figure. With a constant speed v. When the edge ab of the loop enters the pole pieces at time t=0 sec. Which one of the following graphs presents correctly the induced emf in the coil? by Physics experts to help you in doubts & scoring excellent marks in Class 12 exams.
Updated on:21/07/2023Topper's Solved these Questions
- ELECTROMAGNETIC INDUCTIONBOOK - CENGAGE PHYSICS ENGLISHCHAPTER - ELECTROMAGNETIC INDUCTIONEXERCISE - Multiple correct Answer Type
3 Videos
- ELECTROMAGNETIC INDUCTIONBOOK - CENGAGE PHYSICS ENGLISHCHAPTER - ELECTROMAGNETIC INDUCTIONEXERCISE - single correct
10 Videos
- ELECTROMAGNETIC INDUCTIONBOOK - CENGAGE PHYSICS ENGLISHCHAPTER - ELECTROMAGNETIC INDUCTIONEXERCISE - Archives Asserton - Reasoning
1 Videos
- ELECTRICAL MEASURING INSTRUMENTSBOOK - CENGAGE PHYSICS ENGLISHCHAPTER - ELECTRICAL MEASURING INSTRUMENTSEXERCISE - M.C.Q
2 Videos
- ELECTRON,PHONTS,PHOTOELECTRIC EFFECT & X-RAYSBOOK - CENGAGE PHYSICS ENGLISHCHAPTER - ELECTRON,PHONTS,PHOTOELECTRIC EFFECT & X-RAYSEXERCISE - dpp 3.3
15 Videos
Similar Questions
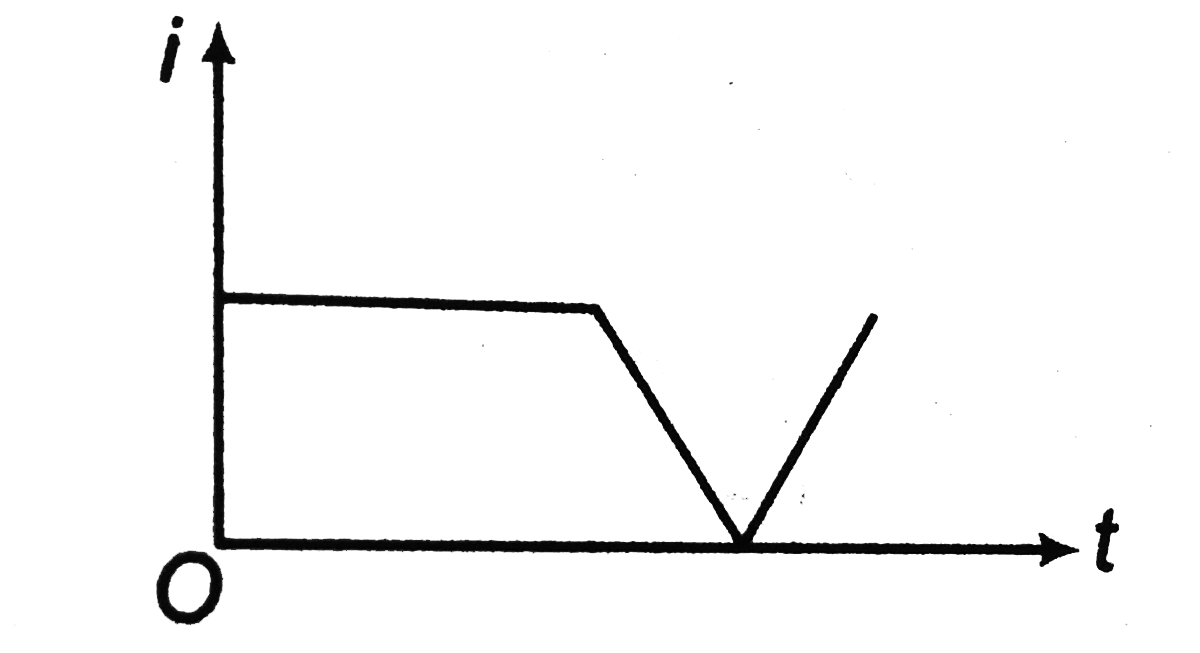
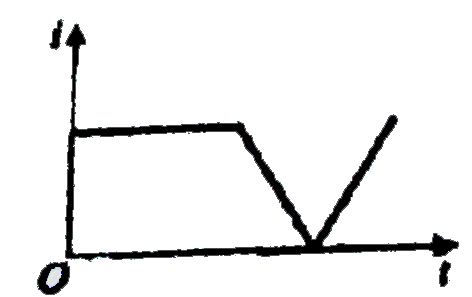
The current i in an inductionn coil varies with time t according to the graph shown in the figure. Which of the following grahs shows athe induced emf (ε) in the coil with time?

View SolutionThe current i in an inductionn coil varies with time t according to the graph shown in the figure. Which of the following grahs shows athe induced emf (ε) in the coil with time?

View SolutionThe current i in an induction coil varies with time according to the graph shown in figure. Which of the following graph shows induced emf in the coil with time:
View SolutionThe current i in an induction coil varies with time t according to the graph shown in the figure-5.250. Which of the following graphs shows the induced EMF in the coil with time ?

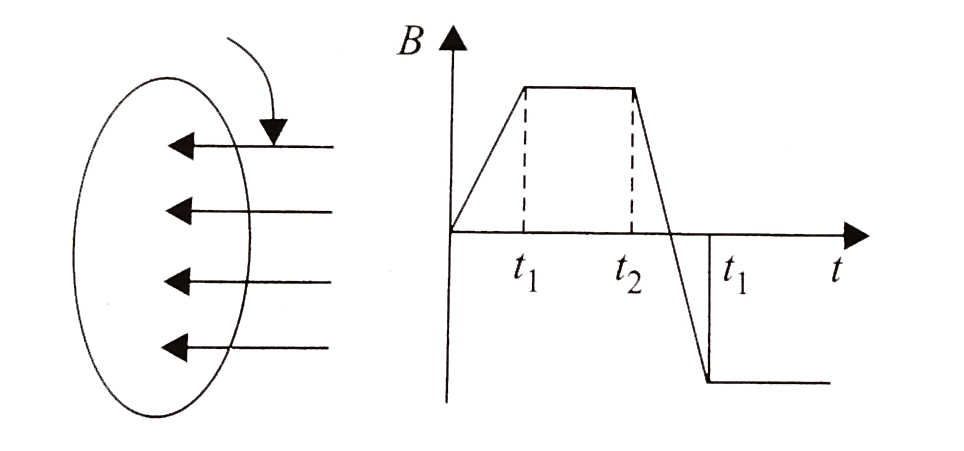
View SolutionA wire loop is placed in a region of time varying magnetic field which is oriented orthogonally to the plane of the loop as shown in Fig. The graph shows the magnetic field variation as the function of time. Assume the positive emf is the one which drives a current in the clockwise direction and seen by the observer in the direction of B. Which of the following graphs best represents the induced emf as a function of time?

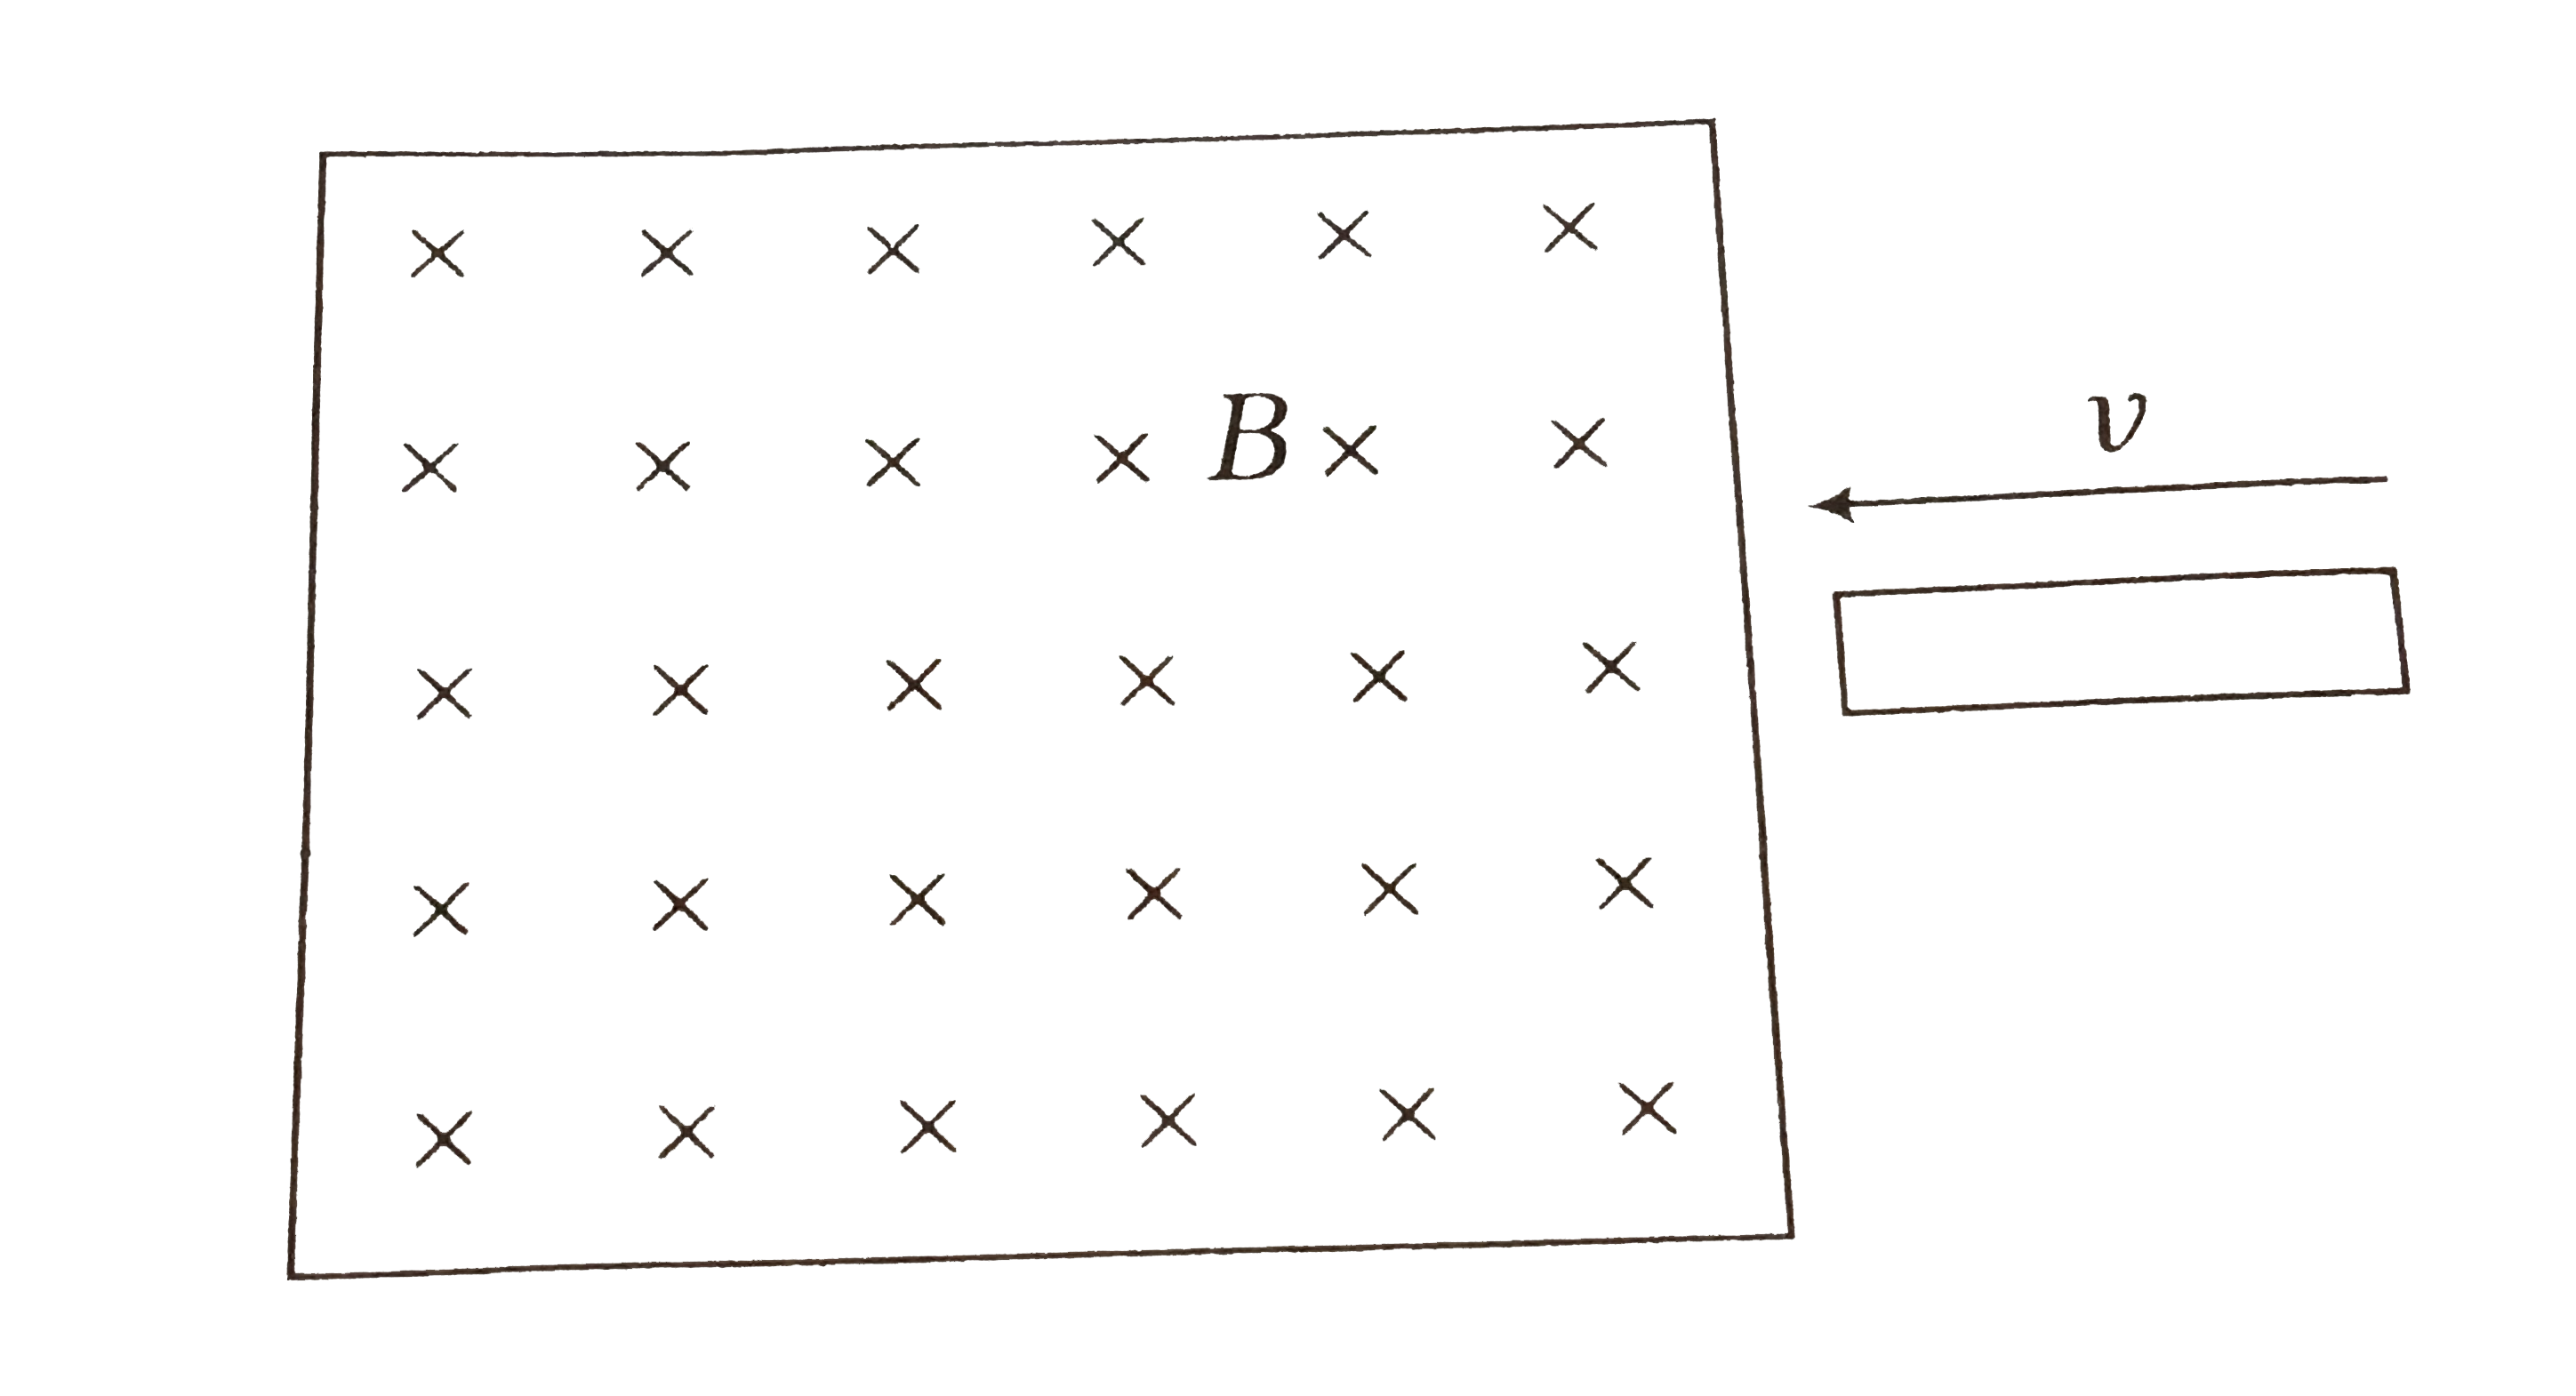
View SolutionThrough a uniform B field, A small rectangular loop is moving towards left with constant velocity as shown in the figure. Counting of time t begins at the moment, the loop starts entering the field.
Plot the variation of flux through the loop with respect to time. Also, plot the variation of induced emf w.r.t. time t.

View SolutionA coil and a magnet moves with their constant speeds 5m/sec and 3m/sec. Respectively , towards each other, then induced emf in coil is 16 m V . If both are moves in same direction , then induced emf in coil :-
View SolutionThe magnetic flux through a coil varies with timet as shown in the diagram. Which graph best represents the variation of the e.m.f. E induced in the coil with time t?
View SolutionIn an L-R circuit connected to a battery of constant emf E, switch is closed at time t=0. If e denotes the induced emf across inductor and I the current in the circuit at any time t. Then which of the following graphs shown the variation of e with i?
View SolutionA small piece of metal wire is dragged across the gap between the pole pieces of a magnet in 0.4 sec. If magnetic flux between the pole pieces is known to be 8×10⁻⁴Wb, then induced emf in the wire, is
View Solution
